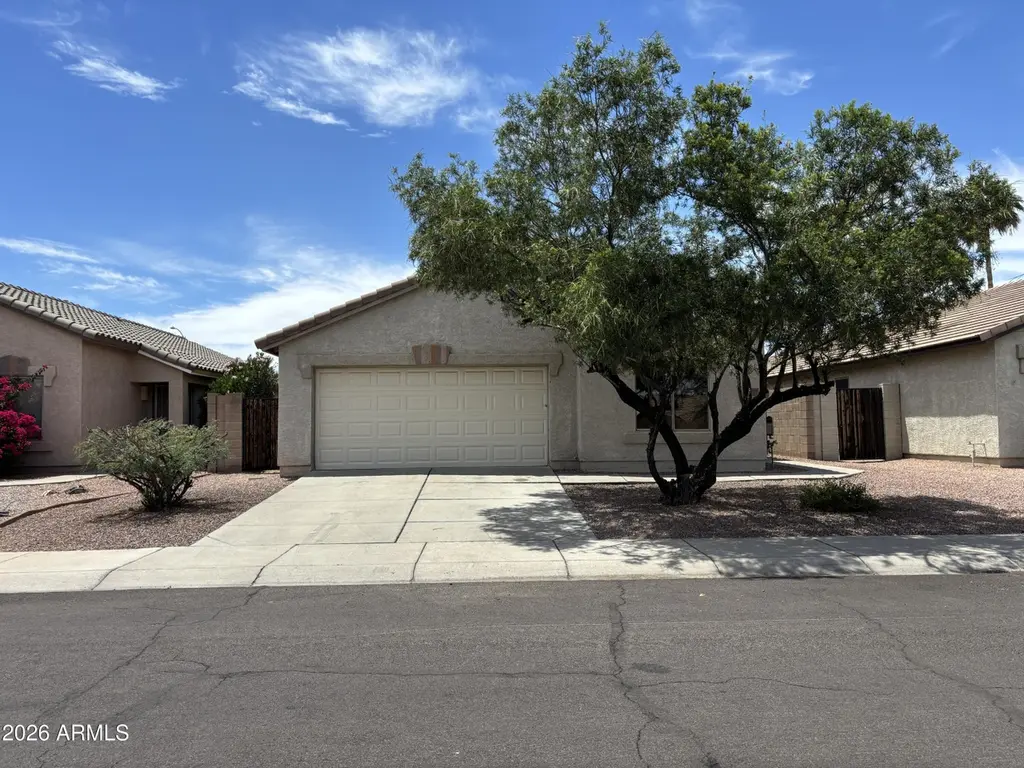
16600 N 162nd Ln · Surprise, AZ
Flood risk 1/10 · Minimal
- FEMA flood zone
- X (shaded)
- Chance of flooding over 30 yrs
- 0.0%
- Est. flood insurance / yr
- $507 – $1,088
Fire risk 3/10 · Minor
- Est. fire insurance / yr
- $610 – $1,132
Heat risk 9/10 · Severe
- Hot days now (above 112°F)
- 7 days/yr
- Hot days in 30 yrs
- 18 days/yr
Wind risk 1/10 · Minimal
- Chance of severe wind over 30 yrs
- —
Air-quality risk 2/10 · Minimal
- Unhealthy air days now
- 1 days/yr
- Unhealthy air days in 30 yrs
- 1 days/yr
Risk factors via First Street. Map © Google.
Why this score? — see what drove the D+ grade
The composite is a weighted blend of 9 inputs, each scored 0–100. Each bar is that input's sub-score; the figure is the points it added to the 100-point composite (weight × sub-score).
- ARV discount +15.0/15.0
- Cash flow +13.3/30.0
- DSCR +4.0/10.0
- Livability +3.7/5.0
- Schools +3.3/10.0
- 1% rule +2.8/10.0
- Rent growth +2.5/5.0
- Condition / age +2.5/5.0
- Appreciation +0.0/10.0
$274,999
🖨 Deal sheet (PDF) 📄 Offer letter ✓ Due diligence
Listing remarks
Absolute Bargain! Unbelievable Price! Priced low for a great value on the best house. It won't last long at this low, low price, so hurry and do your buyer a favor and write me a squeaky clean full price offer today and save yourself all the fun of a full price counter offer!
Key facts
- 5,520 sq ft lot
- 2 garage spots
- Built 1999
Property features AI
Finance
- HOA & community: Community playground; HOA fee $90 quarterly (includes grounds maintenance)
Exterior
- Parking: 2 covered parking spaces; 2 open parking spaces; 2-car garage with garage door opener
- Utilities: City water; Public sewer
- Home design: Single family residence; Fee simple ownership
- Construction: Stucco and painted wood-frame construction; Tile roof
- Exterior features: Private yard; Front and back desert landscaping; Front sprinklers with auto-timer
Interior
- Kitchen: Built-in microwave; Dishwasher; Garbage disposal
- Bedrooms: 3 possible bedrooms
- Flooring: Carpet; Tile
- Bathrooms: 2 full bathrooms
- Heating & cooling: Natural gas heating; Central air; Ceiling fans
- Interior features: Double vanity in master bath; Eat-in kitchen with breakfast bar; Full bathroom in master bedroom
- Laundry & utility: Indoor laundry area; Washer/dryer hookup only
Neighborhood map
What this means for you Summary
Snapshot
- This is a 3-bed/2.0-bath single-family listed at $275k.
Deal economics
- At list price, monthly cash flow is $-2 ($-27/yr) — negative.
- To cash-flow at today's rent, offer at most $275k (0.1% below list).
- To meet the 1% rule (rent ≥ 1% of price), the offer needs to be $214k (22.2% below list).
- Recommended offer: $214k (22.2% below list) — sets the bar for 1% rule.
- Cap rate 6.3% vs local median 3.3% in Surprise — top-decile yield for the area; either an underpriced asset or a hidden risk that comps aren't pricing in. Stress-test before assuming the spread holds.
Location & tenants
- Location reads 74/100 on livability (#19 in AZ, #4,616 nationally) — a middle-class / working-renter tenant base. Strengths: crime A+, housing A+, employment A-; Watch: health & safety D+, amenities D-, commute F.
- Dysart Unified District (4243) (suburban): math 34% / reading 40% proficiency, ranked #73 of 249 in AZ (top 29%) — families likely to look elsewhere, expect single-tenant / working-renter base with shorter leases.
- Zoned schools: Kingswood Elementary School (math 29% / reading 33%, grade F, #525 of 1,109 statewide, top 48%, 791 students, 59% FRL); Cimarron Springs Middle School (math 45% / reading 49%, grade D+, #40 of 218 statewide, top 19%, 589 students, 35% FRL); Willow Canyon High School (math 36% / reading 44%, grade F, #70 of 381 statewide, top 18%, 1,787 students, 32% FRL) — zoned schools at 42% FRL track the district average.
- Market conditions: Rents flat; 406 active listings in the ZIP; 40 comparable units currently listed for rent nearby; rentals at typical pace (median 27d on market — plan ~3-4 weeks tenant-placement turnaround); solid renter incomes; 36,011 units permitted in Maricopa County in 2024 (12,801 in 5+ unit buildings).
- This rent runs 32% of the median local income ($81k/yr) — at the standard rent-burdened threshold; future hikes will face affordability resistance.
Forward outlook
- Local home prices are declining (-3.0%/yr); year-one equity from $2k of loan paydown is wiped out by about $8k of value loss. Plan a longer hold.
- Maricopa County population projected at +38% by 2050 — long-run rental-demand tailwind backs the buy-and-hold thesis.
Negotiation context
- Only 4 days on market — expect competitive offers; lowballing is unlikely to land.
- 4 sale attempts since 24y ago with the ask held roughly flat each time — persistent listings suggest the price (not the market) is what's stuck; bring a comps-based counter.
Risks & watch-outs
- Climate carrying-cost: extreme-heat days projected 7→18/yr by 2055 (HVAC capex compounding) — expect insurance premiums to compound above CPI over the hold.
Questions for the listing agent
- What do current leases actually rent for vs. the listed asking? Can we see a recent rent roll and the last 12 months of T-12 income?
- What does the HOA fee cover, when was the last increase, and are there any pending special assessments or reserve-fund shortfalls?
- Is there a deadline driving the sale (1031 exchange, divorce, estate, relocation)? That informs how much negotiation room exists.
- The area grade is low — what's the realistic commute time and amenity access for the typical tenant pool here? Any planned neighborhood developments (good or bad) we should know about?
- What's the average days-on-market for RENTAL listings here right now (not sales)? A rising rental-DOM trend means longer vacancies and softer asking-rent achievability than the comps imply.
- What's the recent tenant-quality profile in this submarket — average credit score on applications, eviction rate, late-payment / NSF rate, and stable-employment percentage? A property-management company in the area should have these aggregated.
- How much new for-sale + rental construction is in the pipeline within 1–3 miles? Heavy new supply typically softens prices + rents 12–24 months out; constrained supply supports both.
Investment metrics
- 1% rule
- 0.78% ✗
- Cap rate
- 6.28%
- Cash-on-cash
- -0.04%
- DSCR
- 1.00
- GRM
- 10.7
CMA / ARV
- ARV (on-the-fly)
- $378,636
- Comps found
- 12
Show comp detail 12 sales within ~0.75 mi
| Address | Dist | Beds/Ba | Sqft | Sold | Price | $/sf | Match |
|---|---|---|---|---|---|---|---|
| 16600 N 162nd Ln | 0.00mi | 3/2.0 | 1,668 (0%) | 1mo | $318,000 | $191 | 100 |
| 16247 W Post Dr | 0.08mi | 4/2.0 (+1) | 1,617 (-3%) | 0mo | $405,000 | $250 | 86 |
| 15969 W Statler St | 0.35mi | 3/2.5 | 1,734 (+4%) | 0mo | $430,000 | $248 | 75 |
| 15899 N 161st Dr | 0.43mi | 4/2.0 (+1) | 1,682 (+1%) | 2mo | $415,000 | $247 | 72 |
| 15713 N 160th Ave | 0.62mi | 3/2.0 | 1,753 (+5%) | 1mo | $355,000 | $203 | 62 |
| 16329 W Rimrock St | 0.42mi | 3/2.5 | 1,864 (+12%) | 1mo | $431,000 | $231 | 58 |
| 16039 N 165th Ln | 0.50mi | 4/2.5 (+1) | 1,558 (-7%) | 2mo | $353,900 | $227 | 57 |
| 15820 N 164th Ln | 0.55mi | 4/2.0 (+1) | 1,775 (+6%) | 2mo | $395,000 | $223 | 57 |
| 16303 W Sandia Park Dr | 0.40mi | 2/2.0 (-1) | 1,850 (+11%) | 1mo | $385,000 | $208 | 57 |
| 15877 N 161st Dr | 0.44mi | 3/2.0 | 1,884 (+13%) | 1mo | $391,000 | $208 | 57 |
| 16218 N 159th Ave | 0.48mi | 3/2.0 | 1,458 (-13%) | 1mo | $359,000 | $246 | 56 |
| 17733 N Escalante Ln | 0.67mi | 2/1.5 (-1) | 1,870 (+12%) | 1mo | $405,000 | $217 | 40 |
Match score weights: distance 35% · size 25% · config 20% · recency 20%. Top-matched comps best support the ARV.
Projected returns pro-forma
-3.0% appreciation · 0.14% rent growth · sell at horizon
- IRR
- -19.3%
- Equity multiple
- 0.34×
- Total profit
- $-50,791
- Equity at exit
- $41,003
- IRR
- -18.5%
- Equity multiple
- 0.12×
- Total profit
- $-68,009
- Equity at exit
- $23,777
Cash invested: $77,000 (down + closing). Projections, not guarantees.
Landlord ↔ Tenant lean methodology
- Overall (STATE)
- 87 Strongly Landlord-Friendly
- State Arizona
- 87 Strongly Landlord-Friendly · R+3
- County
- — inherits STATE
- City
- — inherits STATE
ZIP-level market 85374
- Home prices YoY
- -18.3%
- Rents YoY
- 0.1%
- Active inventory
- 406
- Price-to-rent
- 10.7×
Monthly cashflow live
- Estimated rent
- $2,141 high interval (Pro) →
- Mortgage (P&I)
- −$1,442
- Tax from tax record
- −$107 /mo · $1,280/yr
- Insurance
- −$115
- HOA
- −$30
- Vacancy / Maint / Mgmt
- −$450
- Net cashflow
- $-2
Break-even live
Sensitivity live
| Price | -10% $153 | -5% $76 | +0% $-2 | +5% $-80 | +10% $-158 |
|---|---|---|---|---|---|
| Rent | -10% $-171 | -5% $-87 | +0% $-2 | +5% $82 | +10% $167 |
| Rate | -1.0pp $136 | -0.5pp $68 | base $-2 | +0.5pp $-74 | +1.0pp $-146 |
UW: 25.0% down · 7.5% · 30yr · 1.5% tax · 5.0% vac · 8.0% maint · 8.0% mgmt
Financing live
Cash to close
- Down payment
- $68,750
- Closing costs
- $8,250
- Reserves months
- —
- Total cash needed
- —
Loan-product check · same deal, 3 products live
Conventional
25% down · 7.5% · 30yr
- Down + closing
- —
- Monthly P&I
- —
- Monthly cashflow
- —
- DSCR
- —
- Eligible?
- —
Personal DTI + credit; lowest rate.
DSCR
20% down · 8.5% · 30yr
- Down + closing
- —
- Monthly P&I
- —
- Monthly cashflow
- —
- DSCR
- —
- Eligible?
- —
No personal income docs; deal must DSCR.
Hard money
10% down · 12.0% · 12mo
- Down + closing
- —
- Monthly P&I
- —
- Monthly cashflow
- —
- DSCR
- —
- Eligible?
- —
Short-term bridge; refi at stabilization.
Rent comps 40 comps
| Address | Beds | Baths | Sqft | Rent | $/sqft | DOM | Units | Dist |
|---|---|---|---|---|---|---|---|---|
| 16755 N Sarival Ave Surprise, AZ | 1.0–3.0 | 1.0–2.0 | 1015 | $2,255 | $2.22 | 0d | 1 | 0.15mi |
| 16212 N 162nd Ave Surprise, AZ | 3.0 | 2.0 | 1309 | $1,889 | $1.44 | 7d | 1 | 0.23mi |
| 16712 N 160th Ave Surprise, AZ | 2.0 | 1.5 | 1199 | $1,750 | $1.46 | 13d | 1 | 0.33mi |
| 16712 N 160th Ave Surprise, AZ | 2.0 | 2.0 | 1200 | $1,850 | $1.54 | 26d | 1 | 0.33mi |
| 16723 N 160th Ave Surprise, AZ | 3.0 | 2.0 | 1320 | $2,600 | $1.97 | 26d | 1 | 0.34mi |
| 16719 N 160th Ave Surprise, AZ | 3.0 | 2.0 | 1320 | $1,795 | $1.36 | 26d | 1 | 0.35mi |
| 16559 W Post Dr Surprise, AZ | 3.0 | 2.0 | 1603 | $1,789 | $1.12 | 24d | 1 | 0.35mi |
| 16612 W Cottonwood St Surprise, AZ | 3.0 | 2.0 | 1603 | $1,749 | $1.09 | 1d | 1 | 0.41mi |
| 16612 W Cottonwood St Surprise, AZ | 3.0 | 2.0 | 1603 | $1,749 | $1.09 | 20d | 1 | 0.41mi |
| 15919 W Tasha Dr Surprise, AZ | 3.0 | 2.0 | 1458 | $1,845 | $1.27 | 1d | 1 | 0.43mi |
| 15911 W Tasha Dr Surprise, AZ | 3.0 | 2.5 | 1734 | $1,880 | $1.08 | 46d | 1 | 0.45mi |
| 15943 W Central St Surprise, AZ | 3.0 | 2.0 | 1576 | $1,895 | $1.20 | 7d | 1 | 0.47mi |
| 16184 N 159th Ave Surprise, AZ | 4.0 | 3.0 | 2214 | $2,700 | $1.22 | 46d | 1 | 0.52mi |
| 16536 W Rock Springs Ln Surprise, AZ | 2.0 | 2.0 | 1414 | $1,995 | $1.41 | 13d | 1 | 0.53mi |
| 15743 W Elm St Surprise, AZ | 3.0 | 2.0 | 1065 | $2,500 | $2.35 | 7d | 1 | 0.60mi |
| 15847 W Bridgewood Dr Surprise, AZ | 3.0 | 2.0 | 2200 | $3,850 | $1.75 | 46d | 1 | 0.61mi |
| 16663 W Rimrock St Surprise, AZ | 4.0 | 2.5 | 2192 | $2,195 | $1.00 | 1d | 1 | 0.61mi |
| 15738 W Elm St Surprise, AZ | 3.0 | 2.0 | 1220 | $1,595 | $1.31 | 26d | 1 | 0.62mi |
| 16523 W Saguaro Ln Surprise, AZ | 3.0 | 2.0 | 1621 | $2,175 | $1.34 | 4d | 1 | 0.64mi |
| 16829 W Cottonwood St Surprise, AZ | 3.0 | 2.0 | 1534 | $1,850 | $1.21 | 26d | 1 | 0.65mi |
| 15724 W Smokey Dr Surprise, AZ | 3.0 | 2.0 | 1220 | $1,800 | $1.48 | 26d | 1 | 0.67mi |
| 16545 N 157th Ave Surprise, AZ | 3.0 | 2.0 | 1065 | $1,725 | $1.62 | 46d | 1 | 0.70mi |
| 17460 N Estrella Vista Dr Surprise, AZ | 2.0 | 2.0 | 1627 | $3,200 | $1.97 | 46d | 1 | 0.72mi |
| 15893 W Arrowhead Dr Surprise, AZ | 2.0 | 2.0 | 1099 | $1,700 | $1.55 | 7d | 1 | 0.73mi |
| 16344 W Crater Ln Surprise, AZ | 2.0 | 1.5 | 1495 | $3,200 | $2.14 | 46d | 1 | 0.76mi |
| 16630 N Reems Rd Surprise, AZ | 1.0–3.0 | 1.0–2.0 | 989 | $2,050 | $2.07 | 1d | 11 | 0.82mi |
| 15883 W Cisa Rio Ln Surprise, AZ | 2.0 | 2.0 | 1414 | $2,200 | $1.56 | 46d | 1 | 0.83mi |
| 15528 N 156th Ln Surprise, AZ | 3.0 | 2.0 | 1668 | $1,849 | $1.11 | 6d | 1 | 0.85mi |
| 17647 N 167th Dr Surprise, AZ | 4.0 | 3.0 | 1789 | $2,035 | $1.14 | 15d | 1 | 0.87mi |
| 15866 W Cisa Rio Ln Surprise, AZ | 2.0 | 2.0 | 1414 | $3,200 | $2.26 | 46d | 1 | 0.88mi |
| 15473 W Tasha Cir Surprise, AZ | 4.0 | 2.0 | 2090 | $4,500 | $2.15 | 46d | 1 | 0.91mi |
| 17783 N El Dorado Way Surprise, AZ | 2.0 | 2.0 | 1647 | $2,100 | $1.28 | 46d | 1 | 0.91mi |
| 15797 W Caribbean Ln Surprise, AZ | 3.0 | 2.0 | 1988 | $1,791 | $0.90 | 15d | 1 | 0.94mi |
| 18121 N Key Estrella Dr Surprise, AZ | 3.0 | 2.0 | 1909 | $3,500 | $1.83 | 46d | 1 | 0.95mi |
| 16270 W Cactus Valley Ln Surprise, AZ | 2.0 | 2.0 | 1338 | $1,875 | $1.40 | 46d | 1 | 0.97mi |
| 17009 W Marconi Ave Surprise, AZ | 3.0 | 2.0 | 1419 | $1,862 | $1.31 | 46d | 1 | 1.02mi |
| 16166 N 170th Ln Surprise, AZ | 3.0 | 2.0 | 1366 | $1,775 | $1.30 | 26d | 1 | 1.04mi |
| 16037 W Custer Ln Surprise, AZ | 4.0 | 2.0 | 2050 | $2,045 | $1.00 | 46d | 1 | 1.05mi |
| 15672 W Port au Prince Ln Surprise, AZ | 3.0 | 2.0 | 1423 | $1,745 | $1.23 | 46d | 1 | 1.07mi |
| 17057 W Manchester Dr Surprise, AZ | 3.0 | 2.0 | 1681 | $1,695 | $1.01 | 13d | 1 | 1.07mi |
HOA detail
- Monthly dues
- $30 · $360/yr
Listing history 10 events
-
2026-05-19$274,999 Active
-
2014-04-01historical
-
2014-01-20price $162,500
-
2014-01-02$170,000 Active
-
2014-01-02$170,000
-
2014-01-02historical
-
2002-09-19soldstatus $122,500
-
2002-09-12soldstatus $99,100
-
2002-07-07historical
-
2002-02-18$127,200
ⓘ Source: listings_history table (triggers on properties + properties_extension) + one-shot
backfill from property_details.listing_events for pre-trigger history.
Tax reassessment forecast AZ · Resets to sale price
- Current annual tax
- $1,280 · $107/mo
- Projected year-2 tax
- $1,815 · $151/mo
- Expected delta
- +$535/yr (+$45/mo · 41.8%)
ⓘ Screening estimate from a state-policy table — verify with the county assessor before closing.
Climate risk First Street
- Flood 1/10 Low FEMA zone X (shaded) · 0% chance over 30 yrs
- Wildfire 3/10 Moderate
- Heat 9/10 Extreme 7 d/yr ≥112°F today · 18 d/yr by 30 yrs out
- Wind 1/10 Low
- Air quality 2/10 Low 1 unhealthy d/yr today · 1 by 30 yrs out
Nearby sold comps map
Loading sold comps map…
Walkable amenities ~0.75 mi
Loading nearby amenities…
Taxation est. · year 1
- Rental income
- $25,688
- − Mortgage interest
- −$15,404
- − Property taxes
- −$1,280
- − Insurance
- −$1,375
- − Repairs & maintenance
- −$2,055
- − Management
- −$2,055
- − HOA
- −$360
- − Depreciation
- −$8,000
- Taxable loss
- −$4,842
- Est. tax savings @ 24.0%
- +$1,162
- After-tax cash flow
- $1,135/yr
For passive investors: Depreciation is non-cash, so a rental often shows a tax loss while cash-flowing — sheltering income. Rental losses are passive: they offset passive income freely, and up to $25,000/yr can offset ordinary (W-2) income if you actively participate and your MAGI is under $100k (phasing out to $0 by $150k); unused losses carry forward. On sale, claimed depreciation is recaptured at up to 25%, and gains may owe capital-gains tax (a 1031 exchange can defer both). Figures are a year-1 estimate at your 24.0% rate — not tax advice; consult a CPA.
Schools (NCES district)
- District
- Dysart Unified District (4243)
- NCES district ID
- 0402690
- Math proficiency
- 34% ▼ -10.00%
- Reading proficiency
- 40% ▼ -5.00%
- Median HH income
- $58,033
- Composite
- 32.76/100
- National rank
- #5634
- State rank
- #73 of 249 in AZ
Livability — Surprise
- Score
- 74/100
- State rank
- #19
- US rank
- #4616
Category grades
Schools grade is shown separately in the Schools card above.
Census & demographics
- Census place
- Surprise, AZ
- County
- Maricopa County · 4,537,380 people
- City population
- 160,031
- Metro
- Phoenix-Mesa-Chandler, AZ
- Population (ZIP)
- 41,420
- Household income
- $81,201
- Rent vs Own
- Severe rent burden
- 1120.0
Population outlook (Maricopa County) Hauer SSP2
- Today (2025)
- 4,979,203 people
- By 2030
- 5,378,229 · +8.0%
- By 2040
- 6,156,598 · +23.6%
- By 2050
- 6,872,376 · +38.0%
- By 2075
- 8,401,270 · +68.7%
- By 2100
- 9,247,439 · +85.7%
Race, ethnicity, and origin ACS 2023
- Neighborhood character
- Predominantly White (78%)
- Race & ethnicity
- White 78% Hispanic / Latino 12% Two or more races 8% Black 4% Asian 2%
- Hispanic origin (detail)
- Mexican 10%
- Common ancestry
- Romanian 4% Portuguese 3% Lithuanian 3%
- Foreign-born
- 8% · Canada
- Languages at home
- 91% English-only · Spanish 5% Other Indo-European 1% Russian/Polish/Slavic 0%
Political lean MEDSL · Maricopa
- 2024 margin
- Toss-up / Even · D 47.7% · R 51.2% · Other 1.1%
- 2008→2024 swing
- +7.1pp toward D · 2008: -10.6pp · 2024: -3.5pp
- All cycles
- 2024: R+3.5 2020: D+2.2 2016: R+3.5 2012: R+12.0 2008: R+10.6
Not yet ingested
- Civics
- —
Market trends
- HPI YoY
- ▼ -56.93%
- Current HPI
- 254.7782
- Rent YoY
- ▲ 0.14%
- Metro
- Phoenix-Mesa-Chandler, AZ
- State GDP YoY
- ▲ 4.54%
- F500 in state
- 20
Industry mix (Fortune 500 HQ in AZ)
| Industry | F500 HQs | Revenue |
|---|---|---|
| Technology | 2 | $13B |
|
||
| Mining / Metals | 1 | $23B |
|
||
| Environmental Services | 1 | $16B |
|
||
| Metals / Steel | 1 | $14B |
|
||
| Technology Distribution | 1 | $9B |
|
||
| Homebuilding | 1 | $8B |
|
||
Price history
+150.0% since first listed13 events — show timeline
- 2026-06-04 Sold (Public Records) $318,000 Public Records
- 2026-06-04 Sold (MLS) $318,000 ARMLS
- 2026-05-23 Pending — ARMLS
- 2026-05-19 Listed $274,999 ARMLS
- 2014-04-01 Listing Removed — ARMLS
- 2014-01-20 Price Changed $162,500 ARMLS
- 2014-01-02 Listed $170,000 ARMLS
- 2014-01-02 Listed $170,000 ARMLS
- 2014-01-02 Listing Removed — ARMLS
- 2002-09-19 Sold (Public Records) $122,500 Public Records
- 2002-09-12 Sold (Public Records) $99,100 Public Records
- 2002-07-07 Listing Removed — ARMLS
- 2002-02-18 Listed $127,200 ARMLS
Property tax history
+0.9%/yrLatest (2025): $1,280 · +0.7% YoY. Source: county tax records.
Cash-flow waterfall
monthlySold comps — $/sqft
last 12 mo · ≤1 miLoading sold comps…