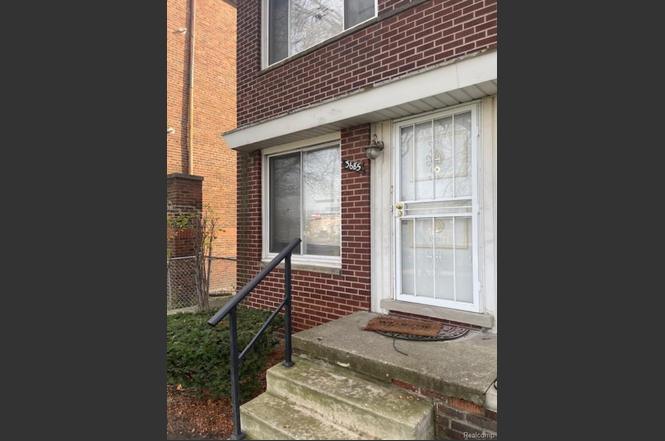
3685 Oakman Blvd #18 · Detroit, MI
Flood risk 1/10 · Minimal
- FEMA flood zone
- X (unshaded)
- Chance of flooding over 30 yrs
- 0.0%
- Est. flood insurance / yr
- $507 – $1,088
Fire risk 1/10 · Minimal
- Est. fire insurance / yr
- $784 – $1,456
Heat risk 3/10 · Minor
- Hot days now (above 97°F)
- 7 days/yr
- Hot days in 30 yrs
- 15 days/yr
Wind risk 2/10 · Minimal
- Chance of severe wind over 30 yrs
- —
Air-quality risk 4/10 · Minor
- Unhealthy air days now
- 4 days/yr
- Unhealthy air days in 30 yrs
- 6 days/yr
Risk factors via First Street. Map © Google.
Why this score? — see what drove the B+ grade
The composite is a weighted blend of 9 inputs, each scored 0–100. Each bar is that input's sub-score; the figure is the points it added to the 100-point composite (weight × sub-score).
- Cash flow +30.0/30.0
- 1% rule +10.0/10.0
- DSCR +10.0/10.0
- Appreciation +10.0/10.0
- ARV discount +7.5/15.0
- Livability +3.7/5.0
- Rent growth +2.5/5.0
- Condition / age +2.5/5.0
- Schools +1.3/10.0
$37,000
🖨 Deal sheet 📄 Offer letter ✓ Due diligence
Listing remarks MLS
Nice rehabbed 2 bedroom townhouse in quiet condo community. Newer windows and kitchen cabinets. Full unfinished clean basement. New furnace with central air. New rear porch with banister. Rear assigned parking space. Buyer to verify all measurements.
Key facts
- $300 HOA
- Built 1965
- Listed 96 days
Tags
Neighborhood map
What this means for you Summary
Snapshot
- This is a 2-bed/1.5-bath condo listed at $37k.
Deal economics
- At list price, monthly cash flow is $334 ($4k/yr) — positive.
- The deal already cash-flows at list — no discount required.
- Meets the 1% rule at list price ($1k rent vs $37k).
- Recommended offer: $34k (9.0% below list) — sets the bar for market timing.
- Cap rate 17.1% vs local median 10.2% in Detroit — top-decile yield for the area; either an underpriced asset or a hidden risk that comps aren't pricing in. Stress-test before assuming the spread holds.
Location & tenants
- Location reads 73/100 on livability (#218 in MI) — a middle-class / working-renter tenant base. Strengths: amenities A+, commute A+, cost of living A+; Watch: schools F, crime F, employment F.
- Detroit Public Schools Community District (urban): math 10% / reading 24% proficiency, ranked #499 of 540 in MI (top 92%) — low school quality limits family demand, transient renter base, plan for 1-2y turnover; 90% free/reduced lunch — lower-income household profile, screen leases tightly.
- Market conditions: 244 active listings in the ZIP; 40 comparable units currently listed for rent nearby; rentals lingering (median 44d on market — plan ~5-8 weeks vacancy on turnover, expect pricing pressure); 50% of comp listings sitting > 30 days — soft ceiling on asking rent; lower-income renter base — watch delinquency; 2,639 units permitted in Wayne County in 2024 (1,216 in 5+ unit buildings).
- This rent runs 38% of the median local income ($34k/yr) — at the standard rent-burdened threshold; future hikes will face affordability resistance.
Forward outlook
- In year one you build about $4k of equity ($256 loan paydown + $4k appreciation (10.0% local appreciation)).
- Wayne County population projected at -17% by 2050 — secular population decline; favor cash flow + early exit over multi-decade hold.
- At projected returns (10.0% appreciation + 3.0% rent growth), your $10k cash investment doubles in ~2 years — after that, you're playing with house money.
- By year 8, paydown + projected appreciation supports a ~$34k cash-out refi (75% LTV) — recoverable capital for the next deal without selling this one.
Negotiation context
- It's been on market 96 days — a 9% lower offer ($34k) is reasonable based on typical stale-listing flexibility.
- 2 sale attempts since 2y ago; this cycle's ask has dropped $8k (18%) from the opening price — seller is motivated, your offer sets the floor, not the list.
Risks & watch-outs
- Watch-outs: HOA is 27% of rent.
Questions for the listing agent
- It's been on market 96 days. Have you received any prior offers? Is the seller open to a 9% concession, seller financing, or rate buy-down credit?
- Built in 1965 — when were the roof, HVAC, electrical panel, plumbing, and water heater last replaced?
- What does the HOA fee cover, when was the last increase, and are there any pending special assessments or reserve-fund shortfalls?
- Any open or pending special assessments — roof, HVAC, plumbing, elevator, façade? What's the per-unit balance and payoff schedule, and is the seller paying it off at close or rolling it to the buyer?
- Why hasn't it sold? Are there any deal-killer items the seller is aware of (foundation, flood, title, zoning, code violations)?
- Is there a deadline driving the sale (1031 exchange, divorce, estate, relocation)? That informs how much negotiation room exists.
- Schools are F-rated, which usually means shorter tenancies and higher turnover. Who's the typical renter profile here, and what's been the actual vacancy rate?
- Crime grade is F in this area — have there been break-ins, vandalism, or insurance claims at this property in the last 3 years? What carrier currently insures it and at what premium?
- What's the average days-on-market for RENTAL listings here right now (not sales)? A rising rental-DOM trend means longer vacancies and softer asking-rent achievability than the comps imply.
- What's the recent tenant-quality profile in this submarket — average credit score on applications, eviction rate, late-payment / NSF rate, and stable-employment percentage? A property-management company in the area should have these aggregated.
- How much new apartment / multifamily construction is in the pipeline within 1–3 miles? Heavy new supply (>2% of stock underway) typically softens rents 12–24 months out; light construction supports rent growth.
Investment metrics
- 1% rule
- 2.96% ✓
- Cap rate
- 17.12%
- Cash-on-cash
- 38.68%
- DSCR
- 2.72
- GRM
- 2.8
CMA / ARV
No comps found within radius.
Projected returns pro-forma
10.0% appreciation · 3.0% rent growth · sell at horizon
- IRR
- 54.3%
- Equity multiple
- 5.02×
- Total profit
- $41,603
- Equity at exit
- $33,333
- IRR
- 47.9%
- Equity multiple
- 11.25×
- Total profit
- $106,158
- Equity at exit
- $71,883
Cash invested: $10,360 (down + closing). Projections, not guarantees.
Landlord ↔ Tenant lean methodology
- Overall (STATE)
- 62 Landlord-Friendly
- State Michigan
- 62 Landlord-Friendly · EVEN
- County
- — inherits STATE
- City
- — inherits STATE
ZIP-level market 48204
- Home prices YoY
- 18.5%
- Active inventory
- 244
- Price-to-rent
- 2.8×
Monthly cashflow live
- Estimated rent
- $1,094 high interval (Pro) →
- Mortgage (P&I)
- −$194
- Tax from tax record
- −$21 /mo · $252/yr
- Insurance
- −$15
- HOA
- −$300
- Vacancy / Maint / Mgmt
- −$230
- Net cashflow
- $334
Break-even live
UW: 25.0% down · 7.5% · 30yr · 1.5% tax · 5.0% vac · 8.0% maint · 8.0% mgmt
Financing live
Cash to close
- Down payment
- $9,250
- Closing costs
- $1,110
- Reserves months
- —
- Total cash needed
- —
Loan-product check · same deal, 3 products live
Conventional
25% down · 7.5% · 30yr
- Down + closing
- —
- Monthly P&I
- —
- Monthly cashflow
- —
- DSCR
- —
- Eligible?
- —
Personal DTI + credit; lowest rate.
DSCR
20% down · 8.5% · 30yr
- Down + closing
- —
- Monthly P&I
- —
- Monthly cashflow
- —
- DSCR
- —
- Eligible?
- —
No personal income docs; deal must DSCR.
Hard money
10% down · 12.0% · 12mo
- Down + closing
- —
- Monthly P&I
- —
- Monthly cashflow
- —
- DSCR
- —
- Eligible?
- —
Short-term bridge; refi at stabilization.
Rent comps 40 comps
| Address | Beds | Baths | Sqft | Rent | $/sqft | DOM | Units | Dist |
|---|---|---|---|---|---|---|---|---|
| 12032 Santa Rosa Dr Unit 1 Detroit, MI | 3.0 | 1.0 | 900 | $1,423 | $1.58 | 5d | 1 | 0.23mi |
| 12415 Monica St Detroit, MI | 2.0 | 1.0 | 1000 | $1,200 | $1.20 | 44d | 1 | 0.23mi |
| 12019 Stoepel St Detroit, MI | 2.0 | 1.0 | 1000 | $943 | $0.94 | 5d | 1 | 0.26mi |
| 12663 Stoepel St Detroit, MI | 2.0 | 1.0 | 1100 | $1,050 | $0.95 | 22d | 1 | 0.36mi |
| 12663 Stoepel St Unit 1 Detroit, MI | 2.0 | 1.0 | 750 | $975 | $1.30 | 18d | 1 | 0.36mi |
| 12303 Cloverlawn St Detroit, MI | 3.0 | 1.5 | 1454 | $1,400 | $0.96 | 44d | 1 | 0.36mi |
| 12703 Northlawn St Detroit, MI | 2.0 | 1.0 | 1365 | $1,053 | $0.77 | 20d | 1 | 0.51mi |
| 11704 Broadstreet Ave Detroit, MI | 3.0 | 1.0 | 1200 | $1,050 | $0.88 | 44d | 1 | 0.65mi |
| 4336 Buena Vista St Detroit, MI | 3.0 | 1.0 | 1300 | $1,100 | $0.85 | 44d | 1 | 0.66mi |
| 9917 Woodside St Apt 1 Detroit, MI | 2.0 | 1.0 | 800 | $800 | $1.00 | 44d | 1 | 0.67mi |
| 2926 Ewald Cir Detroit, MI | 2.0 | 1.0 | 800 | $900 | $1.12 | 17d | 1 | 0.67mi |
| 4268 Cortland St Unit 1 Detroit, MI | 2.0 | 1.0 | 1000 | $1,050 | $1.05 | 44d | 1 | 0.69mi |
| 12144 Washburn St Detroit, MI | 3.0 | 1.0 | 1200 | $1,200 | $1.00 | 15d | 1 | 0.74mi |
| 9789 Chenlot St Unit 1 Detroit, MI | 2.0 | 1.0 | 1000 | $1,000 | $1.00 | 5d | 1 | 0.78mi |
| 4203 Tyler St Detroit, MI | 2.0 | 1.0 | 950 | $895 | $0.94 | 44d | 1 | 0.80mi |
| 11411 Wyoming Ave Apt 205 Detroit, MI | 1.0 | 1.0 | 800 | $1,000 | $1.25 | 11d | 1 | 0.81mi |
| 11411 Wyoming Ave Detroit, MI | 1.0 | 1.0 | 750 | $850 | $1.13 | 24d | 1 | 0.81mi |
| 4287 W Grand St Unit 4289 Detroit, MI | 3.0 | 1.0 | 1250 | $1,000 | $0.80 | 44d | 1 | 0.84mi |
| 2690 Ewald Cir Detroit, MI | 1.0–2.0 | 1.0 | 750 | $900 | $1.20 | 24d | 4 | 0.88mi |
| 4045 Clements St Detroit, MI | 3.0 | 1.0 | 850 | $1,150 | $1.35 | 44d | 1 | 0.94mi |
| 4045 Clements St Detroit, MI | 3.0 | 1.0 | 850 | $1,150 | $1.35 | 24d | 1 | 0.94mi |
| 3824 Tyler St Apt 1 Detroit, MI | 3.0 | 1.0 | 900 | $1,523 | $1.69 | 17d | 1 | 0.94mi |
| 13979 Cherrylawn St Detroit, MI | 3.0 | 1.0 | 1296 | $1,334 | $1.03 | 20d | 1 | 0.94mi |
| 13620 Kentucky St Detroit, MI | 3.0 | 1.0 | 1248 | $1,200 | $0.96 | 5d | 1 | 0.95mi |
| 3783 Tyler St Unit Lower Detroit, MI | 3.0 | 1.0 | 1000 | $1,150 | $1.15 | 44d | 1 | 0.96mi |
| 12468 Mendota St Detroit, MI | 2.0 | 1.0 | 1100 | $1,100 | $1.00 | 44d | 1 | 0.98mi |
| 12468 Mendota St Detroit, MI | 2.0 | 1.0 | 1100 | $1,000 | $0.91 | 24d | 1 | 0.98mi |
| 3740 Tyler St Unit 1 Detroit, MI | 3.0 | 1.0 | 1300 | $1,300 | $1.00 | 5d | 1 | 1.01mi |
| 3812 W Grand St Detroit, MI | 2.0 | 1.0 | 1100 | $1,025 | $0.93 | 17d | 1 | 1.05mi |
| 9353 Kentucky St Detroit, MI | 2.0 | 1.0 | 800 | $999 | $1.25 | 17d | 1 | 1.10mi |
| 10345 Crocuslawn Ave Unit 2 Detroit, MI | 2.0 | 1.0 | 850 | $950 | $1.12 | 44d | 1 | 1.13mi |
| 10303 Morley St #1 Detroit, MI | 2.0 | 1.0 | 950 | $950 | $1.00 | 44d | 1 | 1.16mi |
| 10359 Violetlawn St Unit 1 Detroit, MI | 2.0 | 1.0 | 1200 | $985 | $0.82 | 44d | 1 | 1.17mi |
| 9376 Otsego St Detroit, MI | 3.0 | 1.0 | 873 | $1,396 | $1.60 | 44d | 1 | 1.18mi |
| 3224 Monterey St Unit 2E Detroit, MI | 2.0 | 1.0 | 1200 | $1,350 | $1.12 | 44d | 1 | 1.19mi |
| 9022 Northlawn St Detroit, MI | 2.0 | 1.0 | 1100 | $1,300 | $1.18 | 24d | 1 | 1.21mi |
| 10002 Manor Unit 2 Detroit, MI | 3.0 | 1.0 | 1100 | $1,150 | $1.05 | 44d | 1 | 1.22mi |
| 10002 Manor Unit 1 Detroit, MI | 2.0 | 1.0 | 1000 | $1,050 | $1.05 | 44d | 1 | 1.22mi |
| 12775 Plymouth Rd Unit 16 Detroit, MI | 2.0 | 1.0 | 1009 | $825 | $0.82 | 44d | 1 | 1.28mi |
| 12775 Plymouth Rd Apt 11 Detroit, MI | 1.0 | 1.0 | 725 | $635 | $0.88 | 44d | 1 | 1.28mi |
HOA detail condo
- Monthly dues
- $300 · $3,600/yr
- Likely covers
- parking
- Assessments
- None detected in remarks — confirm with the listing agent.
Listing history 9 events
-
2025-04-07soldstatus $34,000
-
2025-02-24status Pending 250-char remark
Show marketing remark (250 chars)
Nice rehabbed 2 bedroom townhouse in quiet condo community. Newer windows and kitchen cabinets. Full unfinished clean basement. New furnace with central air. New rear porch with banister. Rear assigned parking space. Buyer to verify all measurements.
-
2025-02-24status Pending
Show marketing remark (250 chars)
Nice rehabbed 2 bedroom townhouse in quiet condo community. Newer windows and kitchen cabinets. Full unfinished clean basement. New furnace with central air. New rear porch with banister. Rear assigned parking space. Buyer to verify all measurements.
-
2025-01-29price $37,000 250-char remark
Show marketing remark (250 chars)
Nice rehabbed 2 bedroom townhouse in quiet condo community. Newer windows and kitchen cabinets. Full unfinished clean basement. New furnace with central air. New rear porch with banister. Rear assigned parking space. Buyer to verify all measurements.
-
2025-01-29price $37,000
Show marketing remark (250 chars)
Nice rehabbed 2 bedroom townhouse in quiet condo community. Newer windows and kitchen cabinets. Full unfinished clean basement. New furnace with central air. New rear porch with banister. Rear assigned parking space. Buyer to verify all measurements.
-
2025-01-22price $42,000 250-char remark
Show marketing remark (250 chars)
Nice rehabbed 2 bedroom townhouse in quiet condo community. Newer windows and kitchen cabinets. Full unfinished clean basement. New furnace with central air. New rear porch with banister. Rear assigned parking space. Buyer to verify all measurements.
-
2025-01-21price $42,000
-
2024-11-20$45,000 Active 250-char remark
Show marketing remark (250 chars)
Nice rehabbed 2 bedroom townhouse in quiet condo community. Newer windows and kitchen cabinets. Full unfinished clean basement. New furnace with central air. New rear porch with banister. Rear assigned parking space. Buyer to verify all measurements.
-
2024-11-20$45,000 Active
Show marketing remark (250 chars)
Nice rehabbed 2 bedroom townhouse in quiet condo community. Newer windows and kitchen cabinets. Full unfinished clean basement. New furnace with central air. New rear porch with banister. Rear assigned parking space. Buyer to verify all measurements.
ⓘ Source: listings_history table (triggers on properties + properties_extension) + one-shot
backfill from property_details.listing_events for pre-trigger history.
Tax reassessment forecast MI · Partial reset (capped growth)
- Current annual tax
- $252 · $21/mo
- Projected year-2 tax
- $411 · $34/mo
- Expected delta
- +$159/yr (+$13/mo · 63.1%)
ⓘ Screening estimate from a state-policy table — verify with the county assessor before closing.
Climate risk First Street
- Flood 1/10 Low FEMA zone X (unshaded) · 0% chance over 30 yrs
- Wildfire 1/10 Low
- Heat 3/10 Moderate 7 d/yr ≥97°F today · 15 d/yr by 30 yrs out
- Wind 2/10 Low
- Air quality 4/10 Moderate 4 unhealthy d/yr today · 6 by 30 yrs out
Nearby sold comps map
Loading sold comps map…
Walkable amenities ~0.75 mi
Loading nearby amenities…
Taxation est. · year 1
- Rental income
- $13,129
- − Mortgage interest
- −$2,073
- − Property taxes
- −$252
- − Insurance
- −$185
- − Repairs & maintenance
- −$1,050
- − Management
- −$1,050
- − HOA
- −$3,600
- − Depreciation
- −$1,076
- Taxable income
- $3,843
- Est. tax owed @ 24.0%
- −$922
- After-tax cash flow
- $3,085/yr
For passive investors: Depreciation is non-cash, so a rental often shows a tax loss while cash-flowing — sheltering income. Rental losses are passive: they offset passive income freely, and up to $25,000/yr can offset ordinary (W-2) income if you actively participate and your MAGI is under $100k (phasing out to $0 by $150k); unused losses carry forward. On sale, claimed depreciation is recaptured at up to 25%, and gains may owe capital-gains tax (a 1031 exchange can defer both). Figures are a year-1 estimate at your 24.0% rate — not tax advice; consult a CPA.
Schools (NCES district)
- District
- Detroit Public Schools Community District
- NCES district ID
- 2601103
- Math proficiency
- 10% ▼ -2.00%
- Reading proficiency
- 24% ▲ 6.00%
- Median HH income
- $25,815
- Composite
- 13.06/100
- National rank
- #9564
- State rank
- #499 of 540 in MI
Livability — Detroit
- Score
- 73/100
- State rank
- #218
- US rank
- #5427
Category grades
Schools grade is shown separately in the Schools card above.
Census & demographics
- Census place
- Detroit, MI
- County
- Wayne County · 1,562,939 people
- City population
- 572,865
- Metro
- Detroit-Warren-Dearborn, MI
- Population (ZIP)
- 20,696
- Household income
- $34,468
- Rent vs Own
- Severe rent burden
- 1418.0
Population outlook (Wayne County) Hauer SSP2
- Today (2025)
- 1,675,273 people
- By 2030
- 1,620,300 · -3.3%
- By 2040
- 1,502,341 · -10.3%
- By 2050
- 1,384,039 · -17.4%
- By 2075
- 1,124,592 · -32.9%
- By 2100
- 881,193 · -47.4%
Race, ethnicity, and origin ACS 2023
- Neighborhood character
- Predominantly Black (86%)
- Race & ethnicity
- Black 86% Two or more races 7% Hispanic / Latino 5% White 4% Native American 2%
- Hispanic origin (detail)
- Mexican 4%
- Common ancestry
- Hispanic 1% Romanian 1%
- Foreign-born
- 2% · Canada
- Languages at home
- 95% English-only · Spanish 4%
Political lean MEDSL · Wayne
- 2024 margin
- Strong D (+29.0) · D 62.7% · R 33.7% · Other 3.6%
- 2008→2024 swing
- -20.5pp toward R · 2008: 49.5pp · 2024: 29.0pp
- All cycles
- 2024: D+29.0 2020: D+38.1 2016: D+37.3 2012: D+46.9 2008: D+49.5
Not yet ingested
- Civics
- —
Market trends
- HPI YoY
- ▲ 36.51%
- Current HPI
- 234.0465
- Rent YoY
- —
- Metro
- Detroit-Warren-Dearborn, MI
- State GDP YoY
- ▲ 1.37%
- F500 in state
- 28
Industry mix (Fortune 500 HQ in MI)
| Industry | F500 HQs | Revenue |
|---|---|---|
| Automotive Parts | 3 | $48B |
|
||
| Automotive | 2 | $372B |
|
||
| Chemicals | 1 | $45B |
|
||
| Automotive Retail | 1 | $29B |
|
||
| Healthcare / Medical Devices | 1 | $23B |
|
||
| Automotive Technology | 1 | $20B |
|
||
Price history
-24.4% since first listed9 events — show timeline
- 2025-04-07 Sold (Public Records) $34,000 Public Records
- 2025-02-24 Pending — MiRealSource-MiMLS
- 2025-02-24 Pending — REALCOMP
- 2025-01-29 Price Changed $37,000 MiRealSource-MiMLS
- 2025-01-29 Price Changed $37,000 REALCOMP
- 2025-01-22 Price Changed $42,000 MiRealSource-MiMLS
- 2025-01-21 Price Changed $42,000 REALCOMP
- 2024-11-20 Listed $45,000 REALCOMP
- 2024-11-20 Listed $45,000 MiRealSource-MiMLS
Property tax history
-3.6%/yrLatest (2025): $252 · -54.8% YoY. Source: county tax records.
Cash-flow waterfall
monthlySold comps — $/sqft
last 12 mo · ≤1 miLoading sold comps…