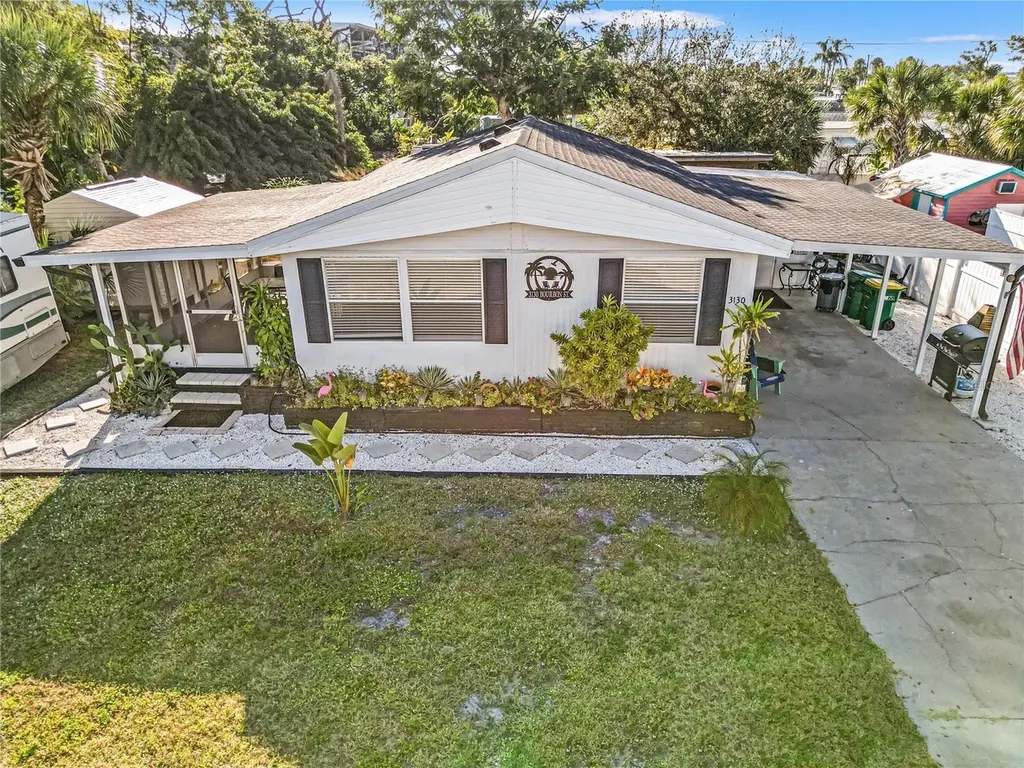
3130 Bourbon St · Grove City, FL
Flood risk 9/10 · Severe
- FEMA flood zone
- AE
- Chance of flooding over 30 yrs
- 0.99%
- Est. flood insurance / yr
- $1,737 – $8,500
Fire risk 1/10 · Minimal
- Est. fire insurance / yr
- $947 – $1,759
Heat risk 10/10 · Severe
- Hot days now (above 107°F)
- 7 days/yr
- Hot days in 30 yrs
- 29 days/yr
Wind risk 10/10 · Severe
- Chance of severe wind over 30 yrs
- 99.0%
Air-quality risk 2/10 · Minimal
- Unhealthy air days now
- 1 days/yr
- Unhealthy air days in 30 yrs
- 1 days/yr
Risk factors via First Street. Map © Google.
Why this score? — see what drove the C- grade
The composite is a weighted blend of 9 inputs, each scored 0–100. Each bar is that input's sub-score; the figure is the points it added to the 100-point composite (weight × sub-score).
- Cash flow +22.2/30.0
- ARV discount +7.5/15.0
- DSCR +7.1/10.0
- 1% rule +5.4/10.0
- Schools +4.6/10.0
- Livability +3.2/5.0
- Rent growth +2.5/5.0
- Condition / age +2.5/5.0
- Appreciation +0.0/10.0
$234,900
🖨 Deal sheet (PDF) 📄 Offer letter ✓ Due diligence
Listing remarks
YOU WON’T BELIEVE THIS IS A MANUFACTURED HOME! Prepare to be amazed by this masterfully renovated coastal sanctuary on OWNED LAND—no lot rent! Sold turn-key and fully furnished, this home feels like a luxury custom build with a bright, open-concept design and designer finishes. Located just 1 block from the Intracoastal and 100ft from Stump Pass Marina/Lighthouse Grill, it’s a boater’s dream. Enjoy dry boat storage nearby and be on the Gulf in under 5 mins. The outdoor oasis features a private Tiki Hut, a large screened porch, and 2 storage sheds for all your gear, plus a 220V hook-up for a camper/RV. UNBEATABLE LOCATION: Walk to shops and dining, or take a short dri
Key facts
- Open-concept design
- Designer finishes
- Dry boat storage
Tags
Property features AI
Finance
- Other: Furnished; Third-party listing; Living area 864 square feet; Lot approximately 0.17 acre (100 x 76); Flood zone; flood insurance required
- Financial info: No lease restrictions; Tax year 2024
- HOA & community: No association fees or approval required; Condo land included; Pets allowed (cats and dogs); max pet weight 110 lbs
Exterior
- Parking: Driveway (open); Carport with 1 space
- Utilities: No public water source listed; Private sewer; Cable connected; Electricity connected; Phone available; Water connected
- Home design: Residential mobile home; Double wide; Attached; One story; Faces east; Entry level: slab foundation; Property condition: completed
- Construction: Vinyl siding; Shingle roof and other roofing; Slab foundation; Built as a double wide mobile home
- Exterior features: Covered front porch; Screened porch; Outdoor grill; Sliding doors; Storage; Gazebo; Shed(s); Mature landscaping with oak trees; Level, cleared lot; Near marina; Paved access
Interior
- Kitchen: Dishwasher; Range; Range hood; Microwave; Refrigerator; Freezer; Electric water heater
- Bedrooms: 2 bedrooms
- Flooring: Carpet; Ceramic tile; Vinyl
- Bathrooms: 2 full bathrooms
- Heating & cooling: Central heating (electric); Central air conditioning
- Interior features: Ceiling fans; Solid surface counters; Walk-in closet(s); Window treatments; Total of 9 rooms
- Laundry & utility: Washer; Dryer; Laundry features: Other
Neighborhood map
What this means for you Summary
Snapshot
- This is a 2-bed/2.0-bath manufactured listed at $235k.
Deal economics
- At list price, monthly cash flow is $-42 ($-504/yr) — negative.
- To cash-flow at today's rent, offer at most $227k (3.2% below list).
- Meets the 1% rule at list price ($2k rent vs $235k).
- Recommended offer: $227k (3.2% below list) — sets the bar for cash-flow.
- Cap rate 8.3% vs local median 2.8% in Grove City — top-decile yield for the area; either an underpriced asset or a hidden risk that comps aren't pricing in. Stress-test before assuming the spread holds.
Location & tenants
- Location reads 63/100 on livability (#713 in FL) — a middle-class / working-renter tenant base. Strengths: crime A+, cost of living A+, housing A+; Watch: employment C-, amenities F, commute F.
- Charlotte (suburban): math 54% / reading 54% proficiency, ranked #22 of 73 in FL (top 30%) — acceptable for families but not a draw, mixed tenant base, ~2y average lease.
- Zoned schools: Lemon Bay High School (math 50% / reading 56%, grade C-, #148 of 667 statewide, top 23%, 1,360 students, 28% FRL) — zoned schools average 28% FRL vs 54% district-wide (25 pts lower); this property's tenant base skews higher-income than the district average.
- Market conditions: Rents soft (-0.1%/yr); 734 active listings in the ZIP; 3 comparable units currently listed for rent nearby; rentals at typical pace (median 22d on market — plan ~3-4 weeks tenant-placement turnaround); 4,585 units permitted in Charlotte County in 2024 (703 in 5+ unit buildings).
- At $2,437/mo this rent would consume 51% of the median local household income ($57k/yr) (locally 329% of renters already pay >50% of income on rent) — very limited rent-growth headroom before tenants either downsize or default.
Forward outlook
- Local home prices are declining (-3.0%/yr); year-one equity from $2k of loan paydown is wiped out by about $7k of value loss. Plan a longer hold.
- Charlotte County population projected at +24% by 2050 — long-run rental-demand tailwind backs the buy-and-hold thesis.
Negotiation context
- Only 13 days on market — expect competitive offers; lowballing is unlikely to land.
- 5 sale attempts since 21y ago with the ask held roughly flat each time — persistent listings suggest the price (not the market) is what's stuck; bring a comps-based counter.
- Current owner paid $100k; list at $235k implies a 135% gain — meaningful room to come down on a strong offer.
Risks & watch-outs
- Watch-outs: flood insurance adds $427/mo.
- Climate carrying-cost: in FEMA flood zone AE (mandatory federal flood insurance); severe wind risk, 99% chance of damaging wind over 30y; extreme-heat days projected 7→29/yr by 2055 (HVAC capex compounding) — expect insurance premiums to compound above CPI over the hold.
Questions for the listing agent
- What do current leases actually rent for vs. the listed asking? Can we see a recent rent roll and the last 12 months of T-12 income?
- Built in 1973 — when were the roof, HVAC, electrical panel, plumbing, and water heater last replaced?
- What's the actual annual flood-insurance premium (NFIP or private), and is the property in a SFHA with mandatory coverage?
- Is there a deadline driving the sale (1031 exchange, divorce, estate, relocation)? That informs how much negotiation room exists.
- Schools are F-rated, which usually means shorter tenancies and higher turnover. Who's the typical renter profile here, and what's been the actual vacancy rate?
- What's the average days-on-market for RENTAL listings here right now (not sales)? A rising rental-DOM trend means longer vacancies and softer asking-rent achievability than the comps imply.
- What's the recent tenant-quality profile in this submarket — average credit score on applications, eviction rate, late-payment / NSF rate, and stable-employment percentage? A property-management company in the area should have these aggregated.
- How much new for-sale + rental construction is in the pipeline within 1–3 miles? Heavy new supply typically softens prices + rents 12–24 months out; constrained supply supports both.
Investment metrics
- 1% rule
- 1.04% ✓
- Cap rate
- 8.26%
- Cash-on-cash
- 7.02%
- DSCR
- 1.31
- GRM
- 8.0
CMA / ARV
No comps found within radius.
Projected returns pro-forma
-3.0% appreciation · 0.0% rent growth · sell at horizon
- IRR
- -21.6%
- Equity multiple
- 0.28×
- Total profit
- $-47,634
- Equity at exit
- $35,024
- IRR
- -27.8%
- Equity multiple
- -0.09×
- Total profit
- $-71,520
- Equity at exit
- $20,310
Cash invested: $65,772 (down + closing). Projections, not guarantees.
Landlord ↔ Tenant lean methodology
- Overall (STATE)
- 87 Strongly Landlord-Friendly
- State Florida
- 87 Strongly Landlord-Friendly · R+3
- County
- — inherits STATE
- City
- — inherits STATE
ZIP-level market 34224
- Home prices YoY
- -18.9%
- Rents YoY
- -0.1%
- Active inventory
- 734
- Price-to-rent
- 8.0×
Monthly cashflow live
- Estimated rent
- $2,437 medium interval (Pro) →
- Mortgage (P&I)
- −$1,232
- Tax from tax record
- −$211 /mo · $2,534/yr
- Insurance
- −$98
- Flood insurance flood zone
- −$427 /mo · $5,118/yr
- HOA
- −$0
- Vacancy / Maint / Mgmt
- −$512
- Net cashflow
- $-42
Break-even live
Sensitivity live
| Price | -10% $91 | -5% $24 | +0% $-42 | +5% $-109 | +10% $-175 |
|---|---|---|---|---|---|
| Rent | -10% $-235 | -5% $-138 | +0% $-42 | +5% $54 | +10% $151 |
| Rate | -1.0pp $76 | -0.5pp $18 | base $-42 | +0.5pp $-103 | +1.0pp $-165 |
UW: 25.0% down · 7.5% · 30yr · 1.5% tax · 5.0% vac · 8.0% maint · 8.0% mgmt
Financing live
Cash to close
- Down payment
- $58,725
- Closing costs
- $7,047
- Reserves months
- —
- Total cash needed
- —
Loan-product check · same deal, 3 products live
Conventional
25% down · 7.5% · 30yr
- Down + closing
- —
- Monthly P&I
- —
- Monthly cashflow
- —
- DSCR
- —
- Eligible?
- —
Personal DTI + credit; lowest rate.
DSCR
20% down · 8.5% · 30yr
- Down + closing
- —
- Monthly P&I
- —
- Monthly cashflow
- —
- DSCR
- —
- Eligible?
- —
No personal income docs; deal must DSCR.
Hard money
10% down · 12.0% · 12mo
- Down + closing
- —
- Monthly P&I
- —
- Monthly cashflow
- —
- DSCR
- —
- Eligible?
- —
Short-term bridge; refi at stabilization.
Rent comps 3 comps
| Address | Beds | Baths | Sqft | Rent | $/sqft | DOM | Units | Dist |
|---|---|---|---|---|---|---|---|---|
| 3280 Holly Ave Englewood, FL | 3.0 | 2.0 | 900 | $3,300 | $3.67 | 22d | 1 | 0.21mi |
| 4341 Placida Rd #6 Englewood, FL | 2.0 | 2.0 | 1071 | $1,450 | $1.35 | 22d | 1 | 0.76mi |
| 4341 Placida Rd #5 Englewood, FL | 2.0 | 2.0 | 1071 | $1,350 | $1.26 | 22d | 1 | 0.76mi |
Listing history 11 events
-
2026-06-18days on market $234,900 Active 13 DOM
-
2026-06-17days on market $234,900 Active 12 DOM
-
2026-06-16days on market $234,900 Active 11 DOM
-
2026-06-15days on market $234,900 Active 10 DOM
-
2026-06-14days on market $234,900 Active 8 DOM
-
2026-06-13days on market $234,900 Active 7 DOM
-
2026-06-10days on market $234,900 Active 5 DOM
-
2026-06-09days on market $234,900 Active 4 DOM
-
2026-06-08days on market $234,900 Active 3 DOM
-
2026-06-07remarks 675-char remark
-
2026-06-07$234,900 Active 2 DOM
ⓘ Source: listings_history table (triggers on properties + properties_extension) + one-shot
backfill from property_details.listing_events for pre-trigger history.
Tax reassessment forecast FL · Resets to sale price
- Current annual tax
- $2,534 · $211/mo
- Projected year-2 tax
- $2,534 · $211/mo
- Expected delta
- $0/yr ($0/mo · 0.0%)
ⓘ Screening estimate from a state-policy table — verify with the county assessor before closing.
Climate risk First Street
- Flood 9/10 Extreme FEMA zone AE · 99% chance over 30 yrs
- Wildfire 1/10 Low
- Heat 10/10 Extreme 7 d/yr ≥107°F today · 29 d/yr by 30 yrs out
- Wind 10/10 Extreme 99% chance of damaging wind over 30 yrs
- Air quality 2/10 Low 1 unhealthy d/yr today · 1 by 30 yrs out
Nearby sold comps map
Loading sold comps map…
Walkable amenities ~0.75 mi
Loading nearby amenities…
Taxation est. · year 1
- Rental income
- $29,247
- − Mortgage interest
- −$13,158
- − Property taxes
- −$2,534
- − Insurance
- −$6,293
- − Repairs & maintenance
- −$2,340
- − Management
- −$2,340
- − Depreciation
- −$6,833
- Taxable loss
- −$4,251
- Est. tax savings @ 24.0%
- +$1,020
- After-tax cash flow
- $516/yr
For passive investors: Depreciation is non-cash, so a rental often shows a tax loss while cash-flowing — sheltering income. Rental losses are passive: they offset passive income freely, and up to $25,000/yr can offset ordinary (W-2) income if you actively participate and your MAGI is under $100k (phasing out to $0 by $150k); unused losses carry forward. On sale, claimed depreciation is recaptured at up to 25%, and gains may owe capital-gains tax (a 1031 exchange can defer both). Figures are a year-1 estimate at your 24.0% rate — not tax advice; consult a CPA.
Schools (NCES district)
- District
- Charlotte
- NCES district ID
- 1200240
- Math proficiency
- 54% ▼ -6.00%
- Reading proficiency
- 54% ▼ -1.00%
- Median HH income
- $44,864
- Composite
- 45.62/100
- National rank
- #2586
- State rank
- #22 of 73 in FL
Livability — Grove City
- Score
- 63/100
- State rank
- #713
- US rank
- #15171
Category grades
Schools grade is shown separately in the Schools card above.
Census & demographics
- Census place
- Grove City, FL
- County
- Charlotte County · 196,994 people
- Metro
- Punta Gorda, FL
- Population (ZIP)
- 15,536
- Household income
- $57,281
- Rent vs Own
- Severe rent burden
- 329.0
Population outlook (Charlotte County) Hauer SSP2
- Today (2025)
- 198,646 people
- By 2030
- 210,507 · +6.0%
- By 2040
- 230,857 · +16.2%
- By 2050
- 247,148 · +24.4%
- By 2075
- 281,777 · +41.8%
- By 2100
- 293,609 · +47.8%
Race, ethnicity, and origin ACS 2023
- Neighborhood character
- Predominantly White (92%)
- Race & ethnicity
- White 92% Two or more races 5% Hispanic / Latino 3% Asian 1%
- Common ancestry
- Romanian 4% Slovak 4% Lithuanian 4%
- Foreign-born
- 9% · Canada
- Languages at home
- 92% English-only · Other Indo-European 2% Spanish 2% German/W. Germanic 1%
Political lean MEDSL · Charlotte
- 2024 margin
- Solid R (+34.0) · D 32.7% · R 66.7%
- 2008→2024 swing
- -26.7pp toward R · 2008: -7.2pp · 2024: -34.0pp
- All cycles
- 2024: R+34.0 2020: R+26.6 2016: R+27.8 2012: R+14.3 2008: R+7.2
Not yet ingested
- Civics
- —
Market trends
- HPI YoY
- ▼ -75.76%
- Current HPI
- 325.0345
- Rent YoY
- ▼ -0.11%
- Metro
- Punta Gorda, FL
- State GDP YoY
- ▲ 3.28%
- F500 in state
- 36
Industry mix (Fortune 500 HQ in FL)
| Industry | F500 HQs | Revenue |
|---|---|---|
| Industrial Technology | 2 | $29B |
|
||
| Insurance | 2 | $17B |
|
||
| Retail | 1 | $60B |
|
||
| Technology Distribution | 1 | $58B |
|
||
| Homebuilding | 1 | $35B |
|
||
| Technology Manufacturing | 1 | $35B |
|
||
Price history
+543.6% since first listed14 events — show timeline
- 2026-06-05 Listed $234,900 Stellar MLS as Distributed by MLS Grid
- 2026-05-06 Listing Removed — Stellar MLS as Distributed by MLS Grid
- 2026-03-31 Price Changed $247,000 Stellar MLS as Distributed by MLS Grid
- 2026-02-07 Listed $259,000 Stellar MLS as Distributed by MLS Grid
- 2026-01-24 Listing Removed — Stellar MLS as Distributed by MLS Grid
- 2026-01-16 Price Changed $260,100 Stellar MLS as Distributed by MLS Grid
- 2025-10-24 Listed $289,000 Stellar MLS as Distributed by MLS Grid
- 2022-09-26 Sold (Public Records) $100,000 Public Records
- 2009-12-15 Listing Removed — Stellar MLS as Distributed by MLS Grid
- 2007-02-01 Listed $99,999 Stellar MLS as Distributed by MLS Grid
- 2005-09-30 Listing Removed — Stellar MLS as Distributed by MLS Grid
- 2005-06-13 Listed $195,000 Stellar MLS as Distributed by MLS Grid
- 2004-02-20 Sold (Public Records) $40,000 Public Records
- 1994-12-15 Sold (Public Records) $36,500 Public Records
Property tax history
+10.5%/yrLatest (2025): $2,534 · +2.4% YoY. Source: county tax records.
Cash-flow waterfall
monthlySold comps — $/sqft
last 12 mo · ≤1 miLoading sold comps…