18745 SW 351st St · Florida City, FL
Flood risk No data
- FEMA flood zone
- —
- Chance of flooding over 30 yrs
- —
- Est. flood insurance / yr
- —
Fire risk No data
- Est. fire insurance / yr
- —
Heat risk No data
- Hot days now (above threshold)
- —
- Hot days in 30 yrs
- —
Wind risk No data
- Chance of severe wind over 30 yrs
- —
Air-quality risk No data
- Unhealthy air days now
- —
- Unhealthy air days in 30 yrs
- —
Risk factors via First Street. Map © Google.
Why this score? — see what drove the B- grade
The composite is a weighted blend of 9 inputs, each scored 0–100. Each bar is that input's sub-score; the figure is the points it added to the 100-point composite (weight × sub-score).
- Cash flow +30.0/30.0
- 1% rule +10.0/10.0
- DSCR +10.0/10.0
- ARV discount +7.5/15.0
- Schools +4.2/10.0
- Livability +3.2/5.0
- Condition / age +2.5/5.0
- Rent growth +1.8/5.0
- Appreciation +0.0/10.0
$150,000
🖨 Deal sheet 📄 Offer letter ✓ Due diligence
Listing remarks
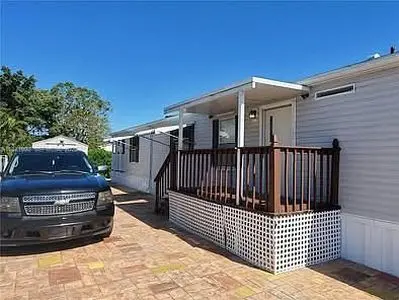
Double-wide manufactured home with a screened-in back porch overlooking a serene evergreen area, located in the highly desirable Gold Coaster Park. This 3-bedroom, 2-bath residence is truly move-in ready and offers a comfortable, open layout ideal for everyday living and entertaining. The updated kitchen features new, upgraded stainless steel appliances, ample cabinetry, and generous counter space. The spacious primary suite includes his-and-her closets, while the private bath offers both a large soaking tub and a separate shower. Two additional bedrooms provide flexibility for guests, family, or a home office. Enjoy the convenience of a beautifully stamped concrete driveway with room for m
Key facts
- Ample cabinetry
- Updated kitchen
- His-and-her closets
Tags
Neighborhood map
What this means for you Summary
Snapshot
- This is a 3-bed/2.0-bath manufactured listed at $150k.
Deal economics
- At list price, monthly cash flow is $1k ($13k/yr) — positive.
- The deal already cash-flows at list — no discount required.
- Meets the 1% rule at list price ($3k rent vs $150k).
- Cap rate 15.0% vs local median 4.2% in Florida City — top-decile yield for the area; either an underpriced asset or a hidden risk that comps aren't pricing in. Stress-test before assuming the spread holds.
Location & tenants
- Location reads 65/100 on livability (#654 in FL) — a middle-class / working-renter tenant base. Strengths: commute A+, cost of living A+, housing A+; Watch: schools F, crime F, amenities F.
- Miami-Dade (suburban): math 45% / reading 54% proficiency, ranked #40 of 73 in FL (top 55%) — families likely to look elsewhere, expect single-tenant / working-renter base with shorter leases; 64% free/reduced lunch — lower-income household profile, screen leases tightly.
- Market conditions: Rents soft (-2.9%/yr); 612 active listings in the ZIP; 40 comparable units currently listed for rent nearby; rentals at typical pace (median 22d on market — plan ~3-4 weeks tenant-placement turnaround); 10,051 units permitted in Miami-Dade County in 2024 (7,758 in 5+ unit buildings).
- At $2,683/mo this rent would consume 68% of the median local household income ($47k/yr) (locally 1516% of renters already pay >50% of income on rent) — very limited rent-growth headroom before tenants either downsize or default.
Forward outlook
- Local home prices are declining (-3.0%/yr); year-one equity from $1k of loan paydown is wiped out by about $4k of value loss. Plan a longer hold.
- Miami-Dade County population projected at +28% by 2050 — long-run rental-demand tailwind backs the buy-and-hold thesis.
- At projected returns (-3.0% appreciation + 0.0% rent growth), your $42k cash investment doubles in ~5 years — after that, you're playing with house money.
Negotiation context
- Only 7 days on market — expect competitive offers; lowballing is unlikely to land.
- 3 sale attempts since 7y ago with the ask held roughly flat each time — persistent listings suggest the price (not the market) is what's stuck; bring a comps-based counter.
Questions for the listing agent
- Is there a deadline driving the sale (1031 exchange, divorce, estate, relocation)? That informs how much negotiation room exists.
- Schools are F-rated, which usually means shorter tenancies and higher turnover. Who's the typical renter profile here, and what's been the actual vacancy rate?
- Crime grade is F in this area — have there been break-ins, vandalism, or insurance claims at this property in the last 3 years? What carrier currently insures it and at what premium?
- What's the average days-on-market for RENTAL listings here right now (not sales)? A rising rental-DOM trend means longer vacancies and softer asking-rent achievability than the comps imply.
- What's the recent tenant-quality profile in this submarket — average credit score on applications, eviction rate, late-payment / NSF rate, and stable-employment percentage? A property-management company in the area should have these aggregated.
- How much new for-sale + rental construction is in the pipeline within 1–3 miles? Heavy new supply typically softens prices + rents 12–24 months out; constrained supply supports both.
Investment metrics
- 1% rule
- 1.79% ✓
- Cap rate
- 14.96%
- Cash-on-cash
- 30.94%
- DSCR
- 2.38
- GRM
- 4.7
CMA / ARV
No comps found within radius.
Projected returns pro-forma
-3.0% appreciation · 0.0% rent growth · sell at horizon
- IRR
- 22.3%
- Equity multiple
- 1.88×
- Total profit
- $36,849
- Equity at exit
- $22,365
- IRR
- 28.3%
- Equity multiple
- 3.16×
- Total profit
- $90,684
- Equity at exit
- $12,969
Cash invested: $42,000 (down + closing). Projections, not guarantees.
Landlord ↔ Tenant lean methodology
- Overall (STATE)
- 87 Strongly Landlord-Friendly
- State Florida
- 87 Strongly Landlord-Friendly · R+3
- County
- — inherits STATE
- City
- — inherits STATE
ZIP-level market 33034
- Home prices YoY
- -5.9%
- Rents YoY
- -2.9%
- Active inventory
- 612
- Price-to-rent
- 4.7×
Monthly cashflow live
- Estimated rent
- $2,683 high interval (Pro) →
- Mortgage (P&I)
- −$787
- Tax est. 1.5%
- −$188 /mo · $2,250/yr
- Insurance
- −$62
- HOA
- −$0
- Vacancy / Maint / Mgmt
- −$563
- Net cashflow
- $1,083
Break-even live
UW: 25.0% down · 7.5% · 30yr · 1.5% tax · 5.0% vac · 8.0% maint · 8.0% mgmt
Financing live
Cash to close
- Down payment
- $37,500
- Closing costs
- $4,500
- Reserves months
- —
- Total cash needed
- —
Loan-product check · same deal, 3 products live
Conventional
25% down · 7.5% · 30yr
- Down + closing
- —
- Monthly P&I
- —
- Monthly cashflow
- —
- DSCR
- —
- Eligible?
- —
Personal DTI + credit; lowest rate.
DSCR
20% down · 8.5% · 30yr
- Down + closing
- —
- Monthly P&I
- —
- Monthly cashflow
- —
- DSCR
- —
- Eligible?
- —
No personal income docs; deal must DSCR.
Hard money
10% down · 12.0% · 12mo
- Down + closing
- —
- Monthly P&I
- —
- Monthly cashflow
- —
- DSCR
- —
- Eligible?
- —
Short-term bridge; refi at stabilization.
Rent comps 40 comps
| Address | Beds | Baths | Sqft | Rent | $/sqft | DOM | Units | Dist |
|---|---|---|---|---|---|---|---|---|
| 841 SW 6th St Florida City, FL | 4.0 | 2.5 | 2160 | $3,299 | $1.53 | 22d | 1 | 0.31mi |
| 902 SW 8th Pl Homestead, FL | 3.0 | 2.5 | 1469 | $2,900 | $1.97 | 24d | 1 | 0.36mi |
| 17887 SW 356th St Unit 17887 Homestead, FL | 3.0 | 3.0 | 1400 | $2,350 | $1.68 | 24d | 1 | 0.37mi |
| 17891 SW 356th St Homestead, FL | 3.0 | 2.5 | 1414 | $2,300 | $1.63 | 3d | 1 | 0.37mi |
| 17905 SW 356th St Homestead, FL | 4.0 | 2.5 | 1600 | $2,750 | $1.72 | 17d | 1 | 0.37mi |
| 937 SW 8th Pl Homestead, FL | 3.0 | 2.0 | 1065 | $2,100 | $1.97 | 24d | 1 | 0.38mi |
| 17958 SW 357th St Homestead, FL | 3.0 | 3.0 | 1330 | $2,650 | $1.99 | 10d | 1 | 0.39mi |
| 17966 SW 357th St Homestead, FL | 3.0 | 3.0 | 1330 | $2,650 | $1.99 | 10d | 1 | 0.39mi |
| 17938 SW 357th St Homestead, FL | 3.0 | 2.5 | 1545 | $2,500 | $1.62 | 7d | 1 | 0.39mi |
| 17938 SW 357th St Homestead, FL | 3.0 | 2.5 | 1545 | $2,500 | $1.62 | 13d | 1 | 0.39mi |
| 17966 SW 357th St Homestead, FL | 3.0 | 3.0 | 1330 | $2,650 | $1.99 | 7d | 1 | 0.39mi |
| 17958 SW 357th St Homestead, FL | 3.0 | 3.0 | 1330 | $2,650 | $1.99 | 7d | 1 | 0.39mi |
| 35760 SW 186th Ave Homestead, FL | 3.0 | 2.0 | 1608 | $2,800 | $1.74 | 18d | 1 | 0.39mi |
| 848 SW 10th St Homestead, FL | 3.0 | 2.0 | 1053 | $2,200 | $2.09 | 3d | 1 | 0.41mi |
| 768 SW 9th St Homestead, FL | 3.0 | 2.0 | 1099 | $2,250 | $2.05 | 24d | 1 | 0.43mi |
| 821 SW 2nd St Homestead, FL | 4.0 | 3.0 | 1384 | $2,800 | $2.02 | 24d | 1 | 0.45mi |
| 834 SW 11th Ter Unit 834 Florida City, FL | 3.0 | 2.5 | 1381 | $2,600 | $1.88 | 24d | 1 | 0.45mi |
| 34435 SW 189th Ct Homestead, FL | 3.0 | 2.5 | 1881 | $2,500 | $1.33 | 22d | 1 | 0.46mi |
| 822 SW 11th Ter Homestead, FL | 3.0 | 2.5 | 1426 | $3,000 | $2.10 | 22d | 1 | 0.46mi |
| 681 SW 7th St #681 Florida City, FL | 3.0 | 2.5 | 1600 | $2,300 | $1.44 | 22d | 1 | 0.50mi |
| 840 SW 6th Pl Homestead, FL | 4.0 | 2.5 | 1711 | $2,300 | $1.34 | 24d | 1 | 0.51mi |
| 1116 SW 7th Ct Homestead, FL | 3.0 | 2.5 | 1466 | $2,600 | $1.77 | 24d | 1 | 0.51mi |
| 1116 SW 7th Ct Homestead, FL | 3.0 | 2.5 | 1466 | $2,400 | $1.64 | 1d | 1 | 0.51mi |
| 785 SW 6th Pl Unit 1 Homestead, FL | 3.0 | 2.5 | 1600 | $2,200 | $1.38 | 16d | 1 | 0.53mi |
| 825 SW 6th Pl Homestead, FL | 3.0 | 2.5 | 1527 | $2,000 | $1.31 | 24d | 1 | 0.54mi |
| 1170 SW 7th Ct #1170 Florida City, FL | 3.0 | 2.5 | 1466 | $2,500 | $1.71 | 24d | 1 | 0.54mi |
| 721 SW 11th St Homestead, FL | 3.0 | 2.5 | 1466 | $2,400 | $1.64 | 13d | 1 | 0.54mi |
| 721 SW 11th St Homestead, FL | 3.0 | 2.5 | 1466 | $2,400 | $1.64 | 10d | 1 | 0.54mi |
| 875 SW 6th Pl Unit TH Homestead, FL | 3.0 | 2.5 | 1527 | $2,250 | $1.47 | 24d | 1 | 0.54mi |
| 58 NW 10th Pl Unit 58 B Florida City, FL | 3.0 | 2.5 | 1440 | $2,695 | $1.87 | 22d | 1 | 0.55mi |
| 48 NW 10th Pl Unit 48 D Florida City, FL | 4.0 | 3.5 | 1578 | $2,940 | $1.86 | 20d | 1 | 0.55mi |
| 1161 SW 7th Ct Homestead, FL | 4.0 | 2.5 | 1530 | $3,450 | $2.25 | 24d | 1 | 0.55mi |
| 687 SW 10th St Homestead, FL | 4.0 | 2.5 | 1799 | $2,200 | $1.22 | 22d | 1 | 0.55mi |
| 1181 SW 7th Ct Unit 1181 Florida City, FL | 3.0 | 2.5 | 1466 | $2,750 | $1.88 | 24d | 1 | 0.56mi |
| 132 NW 10th Pl Unit 132 B Florida City, FL | 3.0 | 2.5 | 1440 | $2,695 | $1.87 | 24d | 1 | 0.56mi |
| 122 NW 10th Pl Unit 122 C Florida City, FL | 4.0 | 3.0 | 1524 | $2,785 | $1.83 | 24d | 1 | 0.56mi |
| 152 NW 10th Pl Unit 152 D Florida City, FL | 4.0 | 3.5 | 1578 | $2,940 | $1.86 | 24d | 1 | 0.56mi |
| 142 NW 10th Pl Unit 142 A Florida City, FL | 3.0 | 3.0 | 1374 | $2,570 | $1.87 | 24d | 1 | 0.56mi |
| 639 SW 3rd Ter Homestead, FL | 3.0 | 2.0 | 1175 | $2,850 | $2.43 | 22d | 1 | 0.57mi |
| 199 Redland Rd Unit B5 Homestead, FL | 3.0 | 2.5 | 1500 | $2,650 | $1.77 | 24d | 1 | 0.59mi |
Listing history 5 events
-
2026-06-16days on market $150,000 Active 7 DOM
-
2026-06-15days on market $150,000 Active 6 DOM
-
2026-06-13days on market $150,000 Active 4 DOM
-
2026-06-10remarks 699-char remark
-
2026-06-10$150,000 Active 1 DOM
ⓘ Source: listings_history table (triggers on properties + properties_extension) + one-shot
backfill from property_details.listing_events for pre-trigger history.
Nearby sold comps map
Loading sold comps map…
Walkable amenities ~0.75 mi
Loading nearby amenities…
Taxation est. · year 1
- Rental income
- $32,197
- − Mortgage interest
- −$8,402
- − Property taxes
- −$2,250
- − Insurance
- −$750
- − Repairs & maintenance
- −$2,576
- − Management
- −$2,576
- − Depreciation
- −$4,364
- Taxable income
- $11,279
- Est. tax owed @ 24.0%
- −$2,707
- After-tax cash flow
- $10,289/yr
For passive investors: Depreciation is non-cash, so a rental often shows a tax loss while cash-flowing — sheltering income. Rental losses are passive: they offset passive income freely, and up to $25,000/yr can offset ordinary (W-2) income if you actively participate and your MAGI is under $100k (phasing out to $0 by $150k); unused losses carry forward. On sale, claimed depreciation is recaptured at up to 25%, and gains may owe capital-gains tax (a 1031 exchange can defer both). Figures are a year-1 estimate at your 24.0% rate — not tax advice; consult a CPA.
Schools (NCES district)
- District
- Miami-Dade
- NCES district ID
- 1200390
- Math proficiency
- 45% ▼ -16.00%
- Reading proficiency
- 54% ▼ -5.00%
- Median HH income
- $43,928
- Composite
- 41.76/100
- National rank
- #3397
- State rank
- #40 of 73 in FL
Livability — Florida City
- Score
- 65/100
- State rank
- #654
- US rank
- #13036
Category grades
Schools grade is shown separately in the Schools card above.
Census & demographics
- County
- Miami-Dade County · 2,697,751 people
- City population
- 23,823
- Metro
- Miami-Fort Lauderdale-Pompano Beach, FL
- Population (ZIP)
- 23,823
- Household income
- $47,170
- Rent vs Own
- Severe rent burden
- 1516.0
Population outlook (Miami-Dade County) Hauer SSP2
- Today (2025)
- 3,126,439 people
- By 2030
- 3,325,765 · +6.4%
- By 2040
- 3,697,561 · +18.3%
- By 2050
- 4,012,134 · +28.3%
- By 2075
- 4,605,612 · +47.3%
- By 2100
- 4,866,598 · +55.7%
Race, ethnicity, and origin ACS 2023
- Neighborhood character
- Majority Hispanic (62%)
- Race & ethnicity
- Hispanic / Latino 62% Black 28% Two or more races 24% White 8%
- Hispanic origin (detail)
- Mexican 20% Puerto Rican 5% Cuban 13% Dominican 2%
- Common ancestry
- Hispanic 4%
- Foreign-born
- 34% · Canada, Dominican Republic, Guatemala
- Languages at home
- 38% English-only · Spanish 56% French/Haitian/Cajun 5%
Political lean MEDSL · Miami-Dade
- 2024 margin
- R (+11.4) · D 43.9% · R 55.4%
- 2008→2024 swing
- -27.6pp toward R · 2008: 16.1pp · 2024: -11.4pp
- All cycles
- 2024: R+11.4 2020: D+7.3 2016: D+29.6 2012: D+23.7 2008: D+16.1
Not yet ingested
- Civics
- —
Market trends
- HPI YoY
- ▼ -32.64%
- Current HPI
- 521.6856
- Rent YoY
- ▼ -2.85%
- Metro
- Miami-Fort Lauderdale-Pompano Beach, FL
- State GDP YoY
- ▲ 3.28%
- F500 in state
- 36
Industry mix (Fortune 500 HQ in FL)
| Industry | F500 HQs | Revenue |
|---|---|---|
| Industrial Technology | 2 | $29B |
|
||
| Insurance | 2 | $17B |
|
||
| Retail | 1 | $60B |
|
||
| Technology Distribution | 1 | $58B |
|
||
| Homebuilding | 1 | $35B |
|
||
| Technology Manufacturing | 1 | $35B |
|
||
Price history
+81.8% since first listed5 events — show timeline
- 2026-06-10 Listed $150,000 FSBO.com
- 2026-03-05 Listing Removed — MARMLS
- 2026-02-25 Listed $160,000 MARMLS
- 2019-11-06 Listing Removed — MARMLS
- 2019-10-21 Listed $82,500 MARMLS
Cash-flow waterfall
monthlySold comps — $/sqft
last 12 mo · ≤1 miLoading sold comps…