7700 Lampson Ave #11 · Stanton, CA
Flood risk 1/10 · Minimal
- FEMA flood zone
- X (shaded)
- Chance of flooding over 30 yrs
- 0.0%
- Est. flood insurance / yr
- $507 – $1,088
Fire risk 1/10 · Minimal
- Est. fire insurance / yr
- $659 – $1,223
Heat risk 5/10 · Moderate
- Hot days now (above 89°F)
- 7 days/yr
- Hot days in 30 yrs
- 23 days/yr
Wind risk 1/10 · Minimal
- Chance of severe wind over 30 yrs
- —
Air-quality risk 5/10 · Moderate
- Unhealthy air days now
- 7 days/yr
- Unhealthy air days in 30 yrs
- 8 days/yr
Risk factors via First Street. Map © Google.
Why this score? — see what drove the C- grade
The composite is a weighted blend of 9 inputs, each scored 0–100. Each bar is that input's sub-score; the figure is the points it added to the 100-point composite (weight × sub-score).
- Cash flow +25.2/30.0
- DSCR +8.3/10.0
- 1% rule +6.6/10.0
- Schools +4.5/10.0
- Livability +3.2/5.0
- Rent growth +2.6/5.0
- Condition / age +2.5/5.0
- ARV discount +0.0/15.0
- Appreciation +0.0/10.0
$229,000
🖨 Deal sheet 📄 Offer letter ✓ Due diligence
Listing remarks
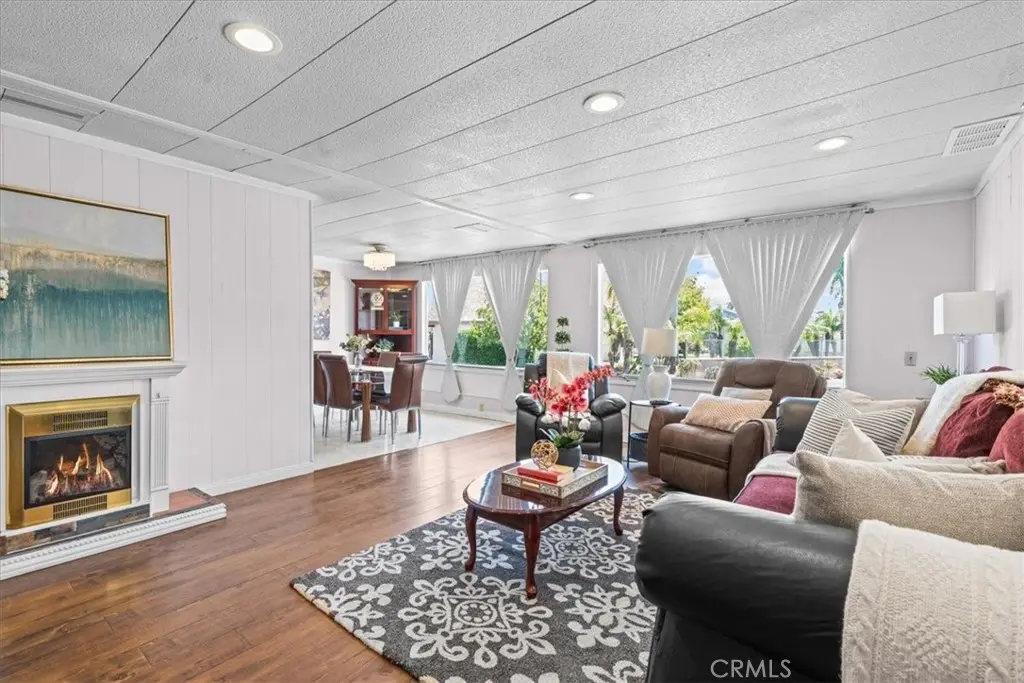
Highly Desirable Magic Lamp Senior Community, Low Space Rent Approx. $1,643/Month. Motivated Sellers! Welcome to this beautifully maintained and lovingly cared-for 2-bedroom, 2 full bathroom home located in the highly sought-after Magic Lamp Senior Community. Nestled within a quiet, clean, and well-maintained park that was extensively updated just two years ago, this charming residence offers comfort, privacy, and pride of ownership throughout. Step inside to a bright and inviting living space filled with natural light from large windows overlooking lush greenery and colorful landscaping. The spacious living and dining areas create a warm, welcoming atmosphere, while recessed lighting t
Key facts
- 3 parking spots
- Community pool
- Built 1969
Property features AI
Finance
- Other: Body type: double-wide mobile; Living area per public records; Access via maintained, paved city streets (use GPS for directions)
- Financial info: Land lease of $1,500 monthly (park provided)
- HOA & community: Senior community in the MAGIC LAMP park; Community features include street lighting; Park requires manager approval; pets allowed upon inquiry
Exterior
- Parking: Attached carport plus onsite and street parking available; Carport provides 3 covered spaces; Guest parking and concrete driveway
- Security: Smoke and carbon monoxide detectors
- Utilities: District/public water; Public sewer; Standard electric service; Natural gas connected; Cable connected
- Home design: Single-story mobile home; Mobile home remains on site; Repairs cosmetic to updated/remodeled condition; One total story; Access from front entry
- Construction: Composition common roof; Raised foundation
- Exterior features: Covered patio; Patio lighting; Community heated pool and spa; Garden area; One shed on property; Aluminum skirting
Interior
- Kitchen: Remodeled kitchen with granite counters; Gas cooktop; Double oven; Range/stove hood; Dishwasher; Garbage disposal; Refrigerator; Utility sink
- Bedrooms: All bedrooms on main floor; Main floor primary bedroom; Jack & Jill layout
- Flooring: Tile; Laminate
- Bathrooms: Two full baths; Upgraded bathrooms with double sinks in primary; Shower and bathtub options; Shower-in-tub, exhaust fan, linen closet and bathroom closet
- Heating & cooling: Central furnace heating; Whole house fan cooling
- Interior features: Copper partial plumbing; Attic fan / whole house fan; Ceiling fans; Recessed lighting; Storage space; Granite counters; French doors; Double pane windows with custom coverings and blinds; Smoke and carbon monoxide detectors; One-level living; front entry
- Laundry & utility: Washer and dryer included; Washer hookup inside (in kitchen)
Neighborhood map
What this means for you Summary
Snapshot
- This is a 2-bed/2.0-bath manufactured listed at $229k.
Deal economics
- At list price, monthly cash flow is $516 ($6k/yr) — positive.
- The deal already cash-flows at list — no discount required.
- Meets the 1% rule at list price ($3k rent vs $229k).
- Recommended offer: $226k (1.5% below list) — sets the bar for market timing.
- Cap rate 9.0% vs local median 2.5% in Stanton — top-decile yield for the area; either an underpriced asset or a hidden risk that comps aren't pricing in. Stress-test before assuming the spread holds.
Location & tenants
- Location reads 63/100 on livability (#468 in CA) — a middle-class / working-renter tenant base. Strengths: commute A+; Watch: amenities D, health & safety D, crime D-.
- Garden Grove Unified (suburban): math 38% / reading 65% proficiency, ranked #132 of 517 in CA (top 26%) — acceptable for families but not a draw, mixed tenant base, ~2y average lease; 60% free/reduced lunch — lower-income household profile, screen leases tightly.
- Zoned schools: Wakeham Elementary (264 students, 83% FRL); Alamitos Intermediate (628 students, 87% FRL); Pacifica High (math 45% / reading 80%, grade B-, #187 of 1,170 statewide, top 16%, 1,648 students, 52% FRL).
- Market conditions: Rents flat; 41 active listings in the ZIP; 40 comparable units currently listed for rent nearby; rentals leasing fast (median 3d on market — plan ~1-2 weeks tenant-placement turnaround); solid renter incomes; 6,974 units permitted in Orange County in 2024 (3,839 in 5+ unit buildings).
- This rent runs 38% of the median local income ($84k/yr) — at the standard rent-burdened threshold; future hikes will face affordability resistance.
Forward outlook
- Local home prices are declining (-3.0%/yr); year-one equity from $2k of loan paydown is wiped out by about $7k of value loss. Plan a longer hold.
- Orange County population projected at +14% by 2050 — modest demand growth; plan on rents tracking national, not racing it.
Negotiation context
- It's been on market 17 days — a 2% lower offer ($226k) is reasonable based on typical stale-listing flexibility.
Risks & watch-outs
- Climate carrying-cost: extreme-heat days projected 7→23/yr by 2055 (HVAC capex compounding) — expect insurance premiums to compound above CPI over the hold.
Questions for the listing agent
- Built in 1969 — when were the roof, HVAC, electrical panel, plumbing, and water heater last replaced?
- Is there a deadline driving the sale (1031 exchange, divorce, estate, relocation)? That informs how much negotiation room exists.
- Crime grade is D in this area — have there been break-ins, vandalism, or insurance claims at this property in the last 3 years? What carrier currently insures it and at what premium?
- What's the average days-on-market for RENTAL listings here right now (not sales)? A rising rental-DOM trend means longer vacancies and softer asking-rent achievability than the comps imply.
- What's the recent tenant-quality profile in this submarket — average credit score on applications, eviction rate, late-payment / NSF rate, and stable-employment percentage? A property-management company in the area should have these aggregated.
- How much new for-sale + rental construction is in the pipeline within 1–3 miles? Heavy new supply typically softens prices + rents 12–24 months out; constrained supply supports both.
Investment metrics
- 1% rule
- 1.16% ✓
- Cap rate
- 9.00%
- Cash-on-cash
- 9.66%
- DSCR
- 1.43
- GRM
- 7.2
CMA / ARV
- ARV (on-the-fly)
- $170,496
- Comps found
- 8
Show comp detail 8 sales within ~0.75 mi
| Address | Dist | Beds/Ba | Sqft | Sold | Price | $/sf | Match |
|---|---|---|---|---|---|---|---|
| 7700 Lampson Ave #125 | 0.00mi | 2/2.0 | 1,265 (+10%) | 21mo | $210,000 | $166 | 66 |
| 7700 Lampson Ave #60 | 0.00mi | 2/2.0 | 1,040 (-10%) | 22mo | $110,000 | $106 | 65 |
| 13202 Hoover St #7 | 0.42mi | 2/2.0 | 1,152 (0%) | 21mo | $173,500 | $151 | 63 |
| 7887 Lampson #100 | 0.35mi | 2/2.0 | 1,008 (-12%) | 1mo | $135,000 | $134 | 62 |
| 8111 Stanford Ave #92 | 0.45mi | 2/2.0 | 1,248 (+8%) | 8mo | $147,500 | $118 | 58 |
| 8111 Stanford Ave #127 | 0.45mi | 3/2.0 (+1) | 1,047 (-9%) | 2mo | $155,000 | $148 | 57 |
| 13202 Hoover St #73 | 0.42mi | 3/2.0 (+1) | 1,248 (+8%) | 10mo | $260,000 | $208 | 54 |
| 8111 Stanford | 0.46mi | 2/2.0 | 1,080 (-6%) | 19mo | $110,000 | $102 | 53 |
Match score weights: distance 35% · size 25% · config 20% · recency 20%. Top-matched comps best support the ARV.
Projected returns pro-forma
-3.0% appreciation · 0.54% rent growth · sell at horizon
- IRR
- -4.5%
- Equity multiple
- 0.83×
- Total profit
- $-10,614
- Equity at exit
- $34,145
- IRR
- 2.0%
- Equity multiple
- 1.13×
- Total profit
- $8,179
- Equity at exit
- $19,800
Cash invested: $64,120 (down + closing). Projections, not guarantees.
Landlord ↔ Tenant lean methodology
- Overall (STATE)
- 18 Strongly Tenant-Friendly
- State California
- 18 Strongly Tenant-Friendly · D+13
- County
- — inherits STATE
- City
- — inherits STATE
ZIP-level market 92841
- Rents YoY
- 0.5%
- Active inventory
- 41
- Price-to-rent
- 7.2×
Monthly cashflow live
- Estimated rent
- $2,657 high interval (Pro) →
- Mortgage (P&I)
- −$1,201
- Tax est. 1.5%
- −$286 /mo · $3,435/yr
- Insurance
- −$95
- HOA
- −$0
- Vacancy / Maint / Mgmt
- −$558
- Net cashflow
- $516
Break-even live
UW: 25.0% down · 7.5% · 30yr · 1.5% tax · 5.0% vac · 8.0% maint · 8.0% mgmt
Financing live
Cash to close
- Down payment
- $57,250
- Closing costs
- $6,870
- Reserves months
- —
- Total cash needed
- —
Loan-product check · same deal, 3 products live
Conventional
25% down · 7.5% · 30yr
- Down + closing
- —
- Monthly P&I
- —
- Monthly cashflow
- —
- DSCR
- —
- Eligible?
- —
Personal DTI + credit; lowest rate.
DSCR
20% down · 8.5% · 30yr
- Down + closing
- —
- Monthly P&I
- —
- Monthly cashflow
- —
- DSCR
- —
- Eligible?
- —
No personal income docs; deal must DSCR.
Hard money
10% down · 12.0% · 12mo
- Down + closing
- —
- Monthly P&I
- —
- Monthly cashflow
- —
- DSCR
- —
- Eligible?
- —
Short-term bridge; refi at stabilization.
Rent comps 40 comps
| Address | Beds | Baths | Sqft | Rent | $/sqft | DOM | Units | Dist |
|---|---|---|---|---|---|---|---|---|
| 12680 Briarglen Loop Stanton, CA | 2.0 | 1.5 | 1000 | $2,195 | $2.19 | 44d | 1 | 0.11mi |
| 7802 Samura Pl Garden Grove, CA | 1.0–2.0 | 1.0 | 869 | $2,465 | $2.84 | 2d | 4 | 0.17mi |
| 12345 Beach Blvd Stanton, CA | 2.0 | 1.0–2.0 | 765 | $3,675 | $4.80 | 2d | 35 | 0.46mi |
| 8155 Carmel Dr Stanton, CA | 3.0 | 2.0 | 1148 | $3,500 | $3.05 | 44d | 1 | 0.54mi |
| 12221 Beach Blvd Garden Grove, CA | 1.0–2.0 | 1.0–2.0 | 900 | $2,825 | $3.14 | 15d | 6 | 0.56mi |
| 7051 Natal Dr Westminster, CA | 1.0–2.0 | 1.0 | 740 | $2,680 | $3.62 | 1d | 2 | 0.57mi |
| 3 Bigsby Dr Stanton, CA | 3.0 | 3.0 | 1355 | $3,950 | $2.92 | 17d | 1 | 0.60mi |
| 35 Bigsby Dr Stanton, CA | 3.0 | 3.0 | 1355 | $4,000 | $2.95 | 24d | 1 | 0.60mi |
| 12381 Arrowhead St Stanton, CA | 1.0–2.0 | 1.0 | 1000 | $2,568 | $2.57 | 21d | 1 | 0.68mi |
| 7732 Chapman Ave Unit 6 Garden Grove, CA | 2.0 | 1.0 | 812 | $2,395 | $2.95 | 44d | 1 | 0.69mi |
| 7722 Chapman Ave Unit 2 Garden Grove, CA | 2.0 | 1.0 | 812 | $2,395 | $2.95 | 24d | 1 | 0.69mi |
| 7732 Chapman Ave Unit 4 Garden Grove, CA | 2.0 | 1.0 | 812 | $2,395 | $2.95 | 7d | 1 | 0.70mi |
| 7731 Trask Ave Westminster, CA | 2.0 | 1.0 | 960 | $2,595 | $2.70 | 1d | 2 | 0.75mi |
| 13051 Monroe St Unit C Garden Grove, CA | 2.0 | 2.0 | 1100 | $2,700 | $2.45 | 1d | 1 | 0.78mi |
| 8172 Larson Ave Garden Grove, CA | 3.0 | 2.5 | 1233 | $3,450 | $2.80 | 1d | 1 | 0.79mi |
| 6971 Knollcrest Ln #50 Garden Grove, CA | 2.0 | 1.0 | 1000 | $2,995 | $3.00 | 44d | 1 | 0.80mi |
| 12901 Dale St Garden Grove, CA | 1.0–2.0 | 1.0 | 876 | $2,707 | $3.09 | 2d | 6 | 0.81mi |
| 12662 Dale St Garden Grove, CA | 1.0 | 1.0 | 771 | $2,095 | $2.72 | 22d | 1 | 0.83mi |
| 7211 Trask Ave Unit 7211-A Westminster, CA | 2.0 | 1.5 | 1100 | $2,595 | $2.36 | 1d | 1 | 0.84mi |
| 13171 Monroe St Garden Grove, CA | 2.0 | 2.0 | 988 | $2,795 | $2.83 | 1d | 1 | 0.84mi |
| 8300 Chapman Ave Stanton, CA | 1.0–2.0 | 1.0 | 860 | $2,545 | $2.96 | 2d | 9 | 0.85mi |
| 8052 Fillmore Dr Apt 3 Stanton, CA | 2.0 | 1.5 | 1000 | $2,250 | $2.25 | 2d | 1 | 0.88mi |
| 12621 Adelle St Garden Grove, CA | 2.0 | 2.0 | 900 | $2,650 | $2.94 | 20d | 1 | 0.91mi |
| 12101 Dale Ave #80 Stanton, CA | 3.0 | 2.0 | 1493 | $1,500 | $1.00 | 7d | 1 | 0.93mi |
| 12312 Louise St Garden Grove, CA | 3.0 | 2.0 | 1300 | $3,500 | $2.69 | 24d | 1 | 0.95mi |
| 13057 Kiwi Ln Garden Grove, CA | 3.0 | 2.5 | 1261 | $3,500 | $2.78 | 1d | 1 | 0.98mi |
| 7152 Fenway Dr Westminster, CA | 1.0 | 1.0 | 766 | $2,250 | $2.94 | 24d | 1 | 1.02mi |
| 13751 Cherry St Unit 3 Westminster, CA | 2.0 | 1.0 | 800 | $2,325 | $2.91 | 1d | 1 | 1.11mi |
| 13751 Cherry St Unit 4 Westminster, CA | 2.0 | 1.0 | 700 | $2,395 | $3.42 | 1d | 1 | 1.11mi |
| 13751 Cherry St Unit 6 Westminster, CA | 2.0 | 1.0 | 700 | $2,495 | $3.56 | 1d | 1 | 1.11mi |
| 13781 Cherry St Westminster, CA | 2.0 | 1.0 | 1000 | $2,300 | $2.30 | 1d | 1 | 1.14mi |
| 13781 Cherry St Unit 2 Westminster, CA | 2.0 | 1.0 | 1000 | $2,300 | $2.30 | 17d | 1 | 1.14mi |
| 13782 Locust St Westminster, CA | 2.0 | 1.0 | 917 | $2,765 | $3.02 | 1d | 2 | 1.17mi |
| 8520 Gloria Ave Garden Grove, CA | 1.0–2.0 | 1.0 | 762 | $2,450 | $3.21 | 1d | 4 | 1.22mi |
| 13920 Hoover St Westminster, CA | 2.0 | 1.0–2.0 | 645 | $3,031 | $4.70 | 1d | 11 | 1.24mi |
| 13872 Locust St Westminster, CA | 2.0 | 1.0 | 1194 | $2,950 | $2.47 | 3d | 1 | 1.26mi |
| 13091 Yockey St Garden Grove, CA | 1.0–3.0 | 1.0–2.0 | 1035 | $2,672 | $2.58 | 1d | 3 | 1.26mi |
| 13891 Cedar St Westminster, CA | 2.0 | 1.5 | 1194 | $2,950 | $2.47 | 1d | 1 | 1.28mi |
| 11893 Macduff St Garden Grove, CA | 3.0 | 2.0 | 1200 | $3,100 | $2.58 | 24d | 1 | 1.29mi |
| 8171 Orangewood Ave Stanton, CA | 2.0 | 2.0 | 800 | $2,800 | $3.50 | 17d | 1 | 1.32mi |
Listing history 13 events
-
2026-06-18days on market $229,000 Active 17 DOM
-
2026-06-17days on market $229,000 Active 16 DOM
-
2026-06-16days on market $229,000 Active 15 DOM
-
2026-06-15days on market $229,000 Active 14 DOM
-
2026-06-13days on market $229,000 Active 12 DOM
-
2026-06-13days on market $229,000 Active 11 DOM
-
2026-06-09days on market $229,000 Active 8 DOM
-
2026-06-08days on market $229,000 Active 7 DOM
-
2026-06-07days on market $229,000 Active 6 DOM
-
2026-06-04days on market $229,000 Active 3 DOM
-
2026-06-03days on market $229,000 Active 2 DOM
-
2026-06-02statusdays on market $229,000 Active 1 DOM
-
2026-05-22historical $229,000
ⓘ Source: listings_history table (triggers on properties + properties_extension) + one-shot
backfill from property_details.listing_events for pre-trigger history.
Climate risk First Street
- Flood 1/10 Low FEMA zone X (shaded) · 0% chance over 30 yrs
- Wildfire 1/10 Low
- Heat 5/10 Major 7 d/yr ≥89°F today · 23 d/yr by 30 yrs out
- Wind 1/10 Low
- Air quality 5/10 Major 7 unhealthy d/yr today · 8 by 30 yrs out
Nearby sold comps map
Loading sold comps map…
Walkable amenities ~0.75 mi
Loading nearby amenities…
Taxation est. · year 1
- Rental income
- $31,879
- − Mortgage interest
- −$12,828
- − Property taxes
- −$3,435
- − Insurance
- −$1,145
- − Repairs & maintenance
- −$2,550
- − Management
- −$2,550
- − Depreciation
- −$6,662
- Taxable income
- $2,709
- Est. tax owed @ 24.0%
- −$650
- After-tax cash flow
- $5,543/yr
For passive investors: Depreciation is non-cash, so a rental often shows a tax loss while cash-flowing — sheltering income. Rental losses are passive: they offset passive income freely, and up to $25,000/yr can offset ordinary (W-2) income if you actively participate and your MAGI is under $100k (phasing out to $0 by $150k); unused losses carry forward. On sale, claimed depreciation is recaptured at up to 25%, and gains may owe capital-gains tax (a 1031 exchange can defer both). Figures are a year-1 estimate at your 24.0% rate — not tax advice; consult a CPA.
Schools (NCES district)
- District
- Garden Grove Unified
- NCES district ID
- 0614880
- Math proficiency
- 38% ▼ -14.00%
- Reading proficiency
- 65% ▲ 4.00%
- Median HH income
- $60,089
- Composite
- 44.89/100
- National rank
- #2715
- State rank
- #132 of 517 in CA
Livability — Stanton
- Score
- 63/100
- State rank
- #468
- US rank
- #15945
Category grades
Schools grade is shown separately in the Schools card above.
Census & demographics
- Census place
- Stanton, CA
- County
- Orange County · 3,096,323 people
- City population
- 31,991
- Metro
- Los Angeles-Long Beach-Anaheim, CA
- Population (ZIP)
- 33,219
- Household income
- $84,451
- Rent vs Own
- Severe rent burden
- 1595.0
Population outlook (Orange County) Hauer SSP2
- Today (2025)
- 3,477,456 people
- By 2030
- 3,613,117 · +3.9%
- By 2040
- 3,835,945 · +10.3%
- By 2050
- 3,968,736 · +14.1%
- By 2075
- 4,097,053 · +17.8%
- By 2100
- 3,903,633 · +12.3%
Race, ethnicity, and origin ACS 2023
- Neighborhood character
- Diverse neighborhood (Simpson 0.64)
- Race & ethnicity
- Asian 47% Hispanic / Latino 34% White 15% Two or more races 10%
- Hispanic origin (detail)
- Mexican 29%
- Common ancestry
- Portuguese 1%
- Foreign-born
- 48% · Vietnam, Canada, South Korea
- Languages at home
- 30% English-only · Vietnamese 35% Spanish 26% Korean 3%
Political lean MEDSL · Orange
- 2024 margin
- Toss-up / Even · D 49.7% · R 47.1% · Other 3.2%
- 2008→2024 swing
- +5.2pp toward D · 2008: -2.6pp · 2024: 2.6pp
- All cycles
- 2024: D+2.6 2020: D+9.0 2016: D+7.7 2012: R+8.3 2008: R+2.6
Not yet ingested
- Civics
- —
Market trends
- HPI YoY
- ▼ -777.50%
- Current HPI
- 452.123
- Rent YoY
- ▲ 0.54%
- Metro
- Los Angeles-Long Beach-Anaheim, CA
- State GDP YoY
- ▲ 3.21%
- F500 in state
- 116
Industry mix (Fortune 500 HQ in CA)
| Industry | F500 HQs | Revenue |
|---|---|---|
| Technology | 27 | $1,492B |
|
||
| Financial Services | 3 | $174B |
|
||
| Retail | 3 | $44B |
|
||
| Insurance | 3 | $26B |
|
||
| Media / Entertainment | 2 | $115B |
|
||
| Pharmaceuticals / Biotech | 2 | $62B |
|
||
Price history
1 event — show timeline
- 2026-05-22 Coming Soon $229,000 CRMLS
Property tax history
-21.2%/yrLatest (2025): $11 · -0.2% YoY. Source: county tax records.
Cash-flow waterfall
monthlySold comps — $/sqft
last 12 mo · ≤1 miLoading sold comps…