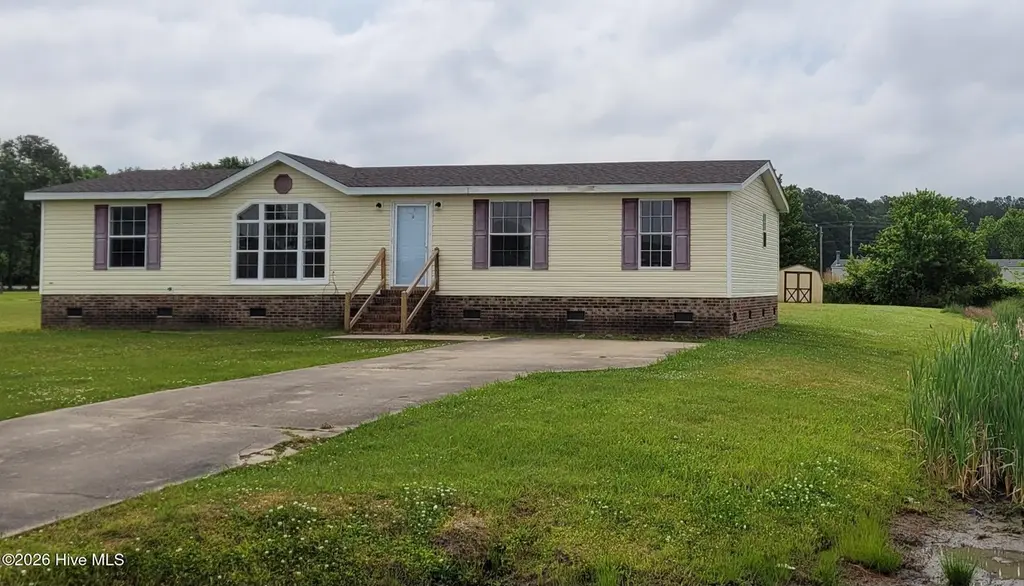
114 Lisa's Way · Elizabeth City, NC
Flood risk 3/10 · Minor
- FEMA flood zone
- X (unshaded)
- Chance of flooding over 30 yrs
- 0.07%
- Est. flood insurance / yr
- $507 – $1,088
Fire risk 2/10 · Minimal
- Est. fire insurance / yr
- $906 – $1,684
Heat risk 9/10 · Severe
- Hot days now (above 107°F)
- 7 days/yr
- Hot days in 30 yrs
- 17 days/yr
Wind risk 8/10 · Major
- Chance of severe wind over 30 yrs
- 99.0%
Air-quality risk 1/10 · Minimal
- Unhealthy air days now
- 0 days/yr
- Unhealthy air days in 30 yrs
- 0 days/yr
Risk factors via First Street. Map © Google.
Why this score? — see what drove the D+ grade
The composite is a weighted blend of 9 inputs, each scored 0–100. Each bar is that input's sub-score; the figure is the points it added to the 100-point composite (weight × sub-score).
- Cash flow +19.2/30.0
- ARV discount +7.5/15.0
- DSCR +6.1/10.0
- 1% rule +4.1/10.0
- Livability +3.6/5.0
- Rent growth +3.5/5.0
- Condition / age +2.5/5.0
- Schools +2.4/10.0
- Appreciation +0.0/10.0
$179,900
🖨 Deal sheet 📄 Offer letter ✓ Due diligence
Listing remarks
3 Bedroom 2 bath. NEW ROOF and FRESH PAINT!! BIG YARD!!! Master Bedroom with Full Bath and Garden Tub. Large living Room, Dining Area, Family Room. NICE Kitchen with Island. Separate Laundry/Utility Room. Storage Building.
Key facts
- Big yard
- Fresh paint
- New roof
Tags
Property features AI
Exterior
- Parking: Concrete parking; No garage
- Utilities: Public water; Septic tank sewer; Water service available
- Home design: Manufactured home (residential); Single-story (one level); Entry level is 1
- Construction: Vinyl siding; Frame construction; Raised foundation; Built as a manufactured home
- Exterior features: Back yard fence; Shingle roof; No patio or porch listed; Has a view; Paved road access
Interior
- Kitchen: Electric oven; Dishwasher; Microwave; Refrigerator
- Bedrooms: Total rooms: 7
- Flooring: Carpet; Vinyl
- Bathrooms: 2 full bathrooms
- Heating & cooling: Heat pump heating; Electric heating; Central air conditioning
- Interior features: Walk-in closet(s); Ceiling fan(s)
- Laundry & utility: Washer; Dryer; Electric water heater
Neighborhood map
What this means for you Summary
Snapshot
- This is a 3-bed/2.0-bath other listed at $180k.
Deal economics
- At list price, monthly cash flow is $195 ($2k/yr) — positive.
- The deal already cash-flows at list — no discount required.
- To meet the 1% rule (rent ≥ 1% of price), the offer needs to be $164k (9.1% below list).
- Recommended offer: $164k (9.1% below list) — sets the bar for 1% rule.
- Cap rate 7.6% vs local median 2.9% in Elizabeth City — top-decile yield for the area; either an underpriced asset or a hidden risk that comps aren't pricing in. Stress-test before assuming the spread holds.
Location & tenants
- Location reads 71/100 on livability (#119 in NC) — a middle-class / working-renter tenant base. Strengths: cost of living A+, housing A+, health & safety A+; Watch: crime D+, commute F, employment F.
- Elizabeth City-Pasquotank Public Schools (rural): math 21% / reading 34% proficiency, ranked #152 of 178 in NC (top 85%) — low school quality limits family demand, transient renter base, plan for 1-2y turnover.
- Zoned schools: J C Sawyer Elementary (math 12% / reading 27%, grade F, #1,242 of 1,410 statewide, top 90%, 368 students, 99% FRL); River Road Middle (math 18% / reading 37%, grade F, #368 of 475 statewide, top 78%, 463 students, 99% FRL); Northeastern High (math 37% / reading 42%, grade F, #393 of 535 statewide, top 75%, 701 students, 100% FRL) — zoned schools average 99% FRL vs 56% district-wide (43 pts higher); higher-poverty schools than district average — tighter screening recommended.
- Market conditions: Rents rising fast (+4.0%/yr); 343 active listings in the ZIP; 153 units permitted in Pasquotank County in 2024 (0 in 5+ unit buildings).
Forward outlook
- Local home prices are declining (-3.0%/yr); year-one equity from $1k of loan paydown is wiped out by about $5k of value loss. Plan a longer hold.
- Pasquotank County population projected at -19% by 2050 — secular population decline; favor cash flow + early exit over multi-decade hold.
Negotiation context
- Only 4 days on market — expect competitive offers; lowballing is unlikely to land.
- Current owner paid $135k; 33% above their basis — modest negotiation headroom, anchor on the comps not their cost.
Risks & watch-outs
- Climate carrying-cost: severe wind risk, 99% chance of damaging wind over 30y; extreme-heat days projected 7→17/yr by 2055 (HVAC capex compounding) — expect insurance premiums to compound above CPI over the hold.
Questions for the listing agent
- Is there a deadline driving the sale (1031 exchange, divorce, estate, relocation)? That informs how much negotiation room exists.
- Schools are F-rated, which usually means shorter tenancies and higher turnover. Who's the typical renter profile here, and what's been the actual vacancy rate?
- Crime grade is D in this area — have there been break-ins, vandalism, or insurance claims at this property in the last 3 years? What carrier currently insures it and at what premium?
- The area grade is low — what's the realistic commute time and amenity access for the typical tenant pool here? Any planned neighborhood developments (good or bad) we should know about?
- What's the average days-on-market for RENTAL listings here right now (not sales)? A rising rental-DOM trend means longer vacancies and softer asking-rent achievability than the comps imply.
- What's the recent tenant-quality profile in this submarket — average credit score on applications, eviction rate, late-payment / NSF rate, and stable-employment percentage? A property-management company in the area should have these aggregated.
- How much new for-sale + rental construction is in the pipeline within 1–3 miles? Heavy new supply typically softens prices + rents 12–24 months out; constrained supply supports both.
Investment metrics
- 1% rule
- 0.91% ✗
- Cap rate
- 7.60%
- Cash-on-cash
- 4.66%
- DSCR
- 1.21
- GRM
- 9.2
CMA / ARV
No comps found within radius.
Projected returns pro-forma
-3.0% appreciation · 4.02% rent growth · sell at horizon
- IRR
- -8.1%
- Equity multiple
- 0.70×
- Total profit
- $-15,075
- Equity at exit
- $26,824
- IRR
- 2.6%
- Equity multiple
- 1.19×
- Total profit
- $9,734
- Equity at exit
- $15,554
Cash invested: $50,372 (down + closing). Projections, not guarantees.
Landlord ↔ Tenant lean methodology
- Overall (STATE)
- 85 Strongly Landlord-Friendly
- State North Carolina
- 85 Strongly Landlord-Friendly · R+3
- County
- — inherits STATE
- City
- — inherits STATE
ZIP-level market 27909
- Rents YoY
- 4.0%
- Active inventory
- 343
- Price-to-rent
- 9.2×
Monthly cashflow live
- Estimated rent
- $1,635 medium interval (Pro) →
- Mortgage (P&I)
- −$943
- Tax from tax record
- −$78 /mo · $934/yr
- Insurance
- −$75
- HOA
- −$0
- Vacancy / Maint / Mgmt
- −$343
- Net cashflow
- $195
Break-even live
UW: 25.0% down · 7.5% · 30yr · 1.5% tax · 5.0% vac · 8.0% maint · 8.0% mgmt
Financing live
Cash to close
- Down payment
- $44,975
- Closing costs
- $5,397
- Reserves months
- —
- Total cash needed
- —
Loan-product check · same deal, 3 products live
Conventional
25% down · 7.5% · 30yr
- Down + closing
- —
- Monthly P&I
- —
- Monthly cashflow
- —
- DSCR
- —
- Eligible?
- —
Personal DTI + credit; lowest rate.
DSCR
20% down · 8.5% · 30yr
- Down + closing
- —
- Monthly P&I
- —
- Monthly cashflow
- —
- DSCR
- —
- Eligible?
- —
No personal income docs; deal must DSCR.
Hard money
10% down · 12.0% · 12mo
- Down + closing
- —
- Monthly P&I
- —
- Monthly cashflow
- —
- DSCR
- —
- Eligible?
- —
Short-term bridge; refi at stabilization.
Listing history 3 events
-
2026-05-04status Pending
-
2026-04-30$179,900 Active
-
2006-08-08soldstatus $135,000
ⓘ Source: listings_history table (triggers on properties + properties_extension) + one-shot
backfill from property_details.listing_events for pre-trigger history.
Tax reassessment forecast NC · Resets to sale price
- Current annual tax
- $934 · $78/mo
- Projected year-2 tax
- $1,475 · $123/mo
- Expected delta
- +$541/yr (+$45/mo · 57.9%)
ⓘ Screening estimate from a state-policy table — verify with the county assessor before closing.
Climate risk First Street
- Flood 3/10 Moderate FEMA zone X (unshaded) · 7% chance over 30 yrs
- Wildfire 2/10 Low
- Heat 9/10 Extreme 7 d/yr ≥107°F today · 17 d/yr by 30 yrs out
- Wind 8/10 Severe 99% chance of damaging wind over 30 yrs
- Air quality 1/10 Low 0 unhealthy d/yr today · 0 by 30 yrs out
Nearby sold comps map
Loading sold comps map…
Walkable amenities ~0.75 mi
Loading nearby amenities…
Taxation est. · year 1
- Rental income
- $19,620
- − Mortgage interest
- −$10,077
- − Property taxes
- −$934
- − Insurance
- −$900
- − Repairs & maintenance
- −$1,570
- − Management
- −$1,570
- − Depreciation
- −$5,233
- Taxable loss
- −$664
- Est. tax savings @ 24.0%
- +$159
- After-tax cash flow
- $2,504/yr
For passive investors: Depreciation is non-cash, so a rental often shows a tax loss while cash-flowing — sheltering income. Rental losses are passive: they offset passive income freely, and up to $25,000/yr can offset ordinary (W-2) income if you actively participate and your MAGI is under $100k (phasing out to $0 by $150k); unused losses carry forward. On sale, claimed depreciation is recaptured at up to 25%, and gains may owe capital-gains tax (a 1031 exchange can defer both). Figures are a year-1 estimate at your 24.0% rate — not tax advice; consult a CPA.
Schools (NCES district)
- District
- Elizabeth City-Pasquotank Public Schools
- NCES district ID
- 3703540
- Math proficiency
- 21% ▼ -7.00%
- Reading proficiency
- 34% ▼ -1.00%
- Median HH income
- $45,294
- Composite
- 23.63/100
- National rank
- #7847
- State rank
- #152 of 178 in NC
Livability — Elizabeth City
- Score
- 71/100
- State rank
- #119
- US rank
- #7304
Category grades
Schools grade is shown separately in the Schools card above.
Census & demographics
- County
- Pasquotank County · 40,869 people
- City population
- 40,869
- Metro
- Elizabeth City, NC
- Population (ZIP)
- 40,869
- Household income
- $66,732
- Rent vs Own
- Severe rent burden
- 1160.0
Population outlook (Pasquotank County) Hauer SSP2
- Today (2025)
- 38,172 people
- By 2030
- 36,890 · -3.4%
- By 2040
- 33,845 · -11.3%
- By 2050
- 31,086 · -18.6%
- By 2075
- 27,191 · -28.8%
- By 2100
- 26,093 · -31.6%
Race, ethnicity, and origin ACS 2023
- Neighborhood character
- Diverse neighborhood (Simpson 0.59)
- Race & ethnicity
- White 54% Black 35% Hispanic / Latino 6% Two or more races 6% Asian 1%
- Hispanic origin (detail)
- Mexican 2% Puerto Rican 2%
- Common ancestry
- Slovak 2% Romanian 1% Lithuanian 1%
- Foreign-born
- 3% · Canada, Vietnam
- Languages at home
- 96% English-only · Spanish 2% Other Asian/Pacific 1% Vietnamese 1%
Political lean MEDSL · Pasquotank
- 2024 margin
- Toss-up / Even · D 47.1% · R 52.0%
- 2008→2024 swing
- -18.6pp toward R · 2008: 13.7pp · 2024: -4.9pp
- All cycles
- 2024: R+4.9 2020: D+0.3 2016: D+2.2 2012: D+15.9 2008: D+13.7
Not yet ingested
- Civics
- —
Market trends
- HPI YoY
- ▼ -141.03%
- Current HPI
- 164.7511
- Rent YoY
- ▲ 4.02%
- Metro
- Elizabeth City, NC
- State GDP YoY
- ▲ 3.28%
- F500 in state
- 26
Industry mix (Fortune 500 HQ in NC)
| Industry | F500 HQs | Revenue |
|---|---|---|
| Financial Services | 2 | $213B |
|
||
| Retail | 2 | $95B |
|
||
| Industrial Conglomerate | 1 | $38B |
|
||
| Metals / Steel | 1 | $35B |
|
||
| Utilities | 1 | $30B |
|
||
| Industrial Machinery | 1 | $19B |
|
||
Price history
+33.3% since first listed3 events — show timeline
- 2026-05-04 Pending — Hive MLS
- 2026-04-30 Listed $179,900 Hive MLS
- 2006-08-08 Sold (Public Records) $135,000 Public Records
Property tax history
-0.7%/yrLatest (2025): $934 · +5.4% YoY. Source: county tax records.
Cash-flow waterfall
monthlySold comps — $/sqft
last 12 mo · ≤1 miLoading sold comps…