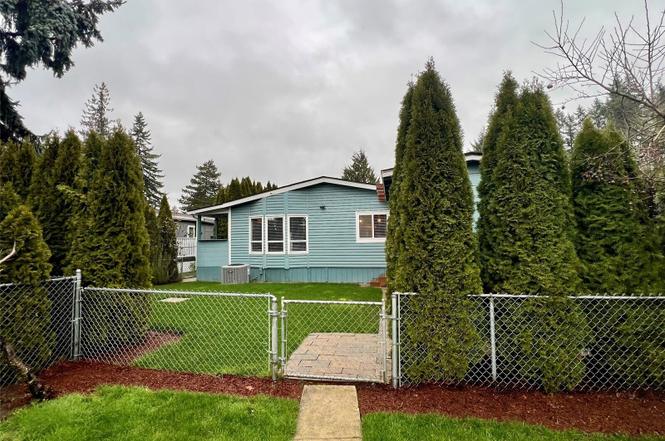
3501 Auburn Way S #37 · Auburn, WA
Flood risk 1/10 · Minimal
- FEMA flood zone
- X (unshaded)
- Chance of flooding over 30 yrs
- 0.0%
- Est. flood insurance / yr
- $507 – $1,088
Fire risk 1/10 · Minimal
- Est. fire insurance / yr
- $604 – $1,122
Heat risk 3/10 · Minor
- Hot days now (above 87°F)
- 7 days/yr
- Hot days in 30 yrs
- 15 days/yr
Wind risk 1/10 · Minimal
- Chance of severe wind over 30 yrs
- —
Air-quality risk 7/10 · Major
- Unhealthy air days now
- 10 days/yr
- Unhealthy air days in 30 yrs
- 11 days/yr
Risk factors via First Street. Map © Google.
Why this score? — see what drove the B grade
The composite is a weighted blend of 9 inputs, each scored 0–100. Each bar is that input's sub-score; the figure is the points it added to the 100-point composite (weight × sub-score).
- Cash flow +26.2/30.0
- Appreciation +10.0/10.0
- DSCR +8.8/10.0
- ARV discount +7.5/15.0
- 1% rule +7.0/10.0
- Schools +4.7/10.0
- Livability +4.0/5.0
- Condition / age +2.5/5.0
- Rent growth +2.4/5.0
$184,500
🖨 Deal sheet 📄 Offer letter ✓ Due diligence
Listing remarks
ALL AGES PARK! Welcome to this bright and inviting home in highly sought-after Palisades Community. This beautiful, impeccable home features a spacious, open-concept layout that flows from the living room to the kitchen, perfect for comportable living. Vaulted ceilings flood the space with natural light. Tasteful designer colors and modern chef-inspired kitchen with SS appliances, gleaming floors throughout! Primary suite has private bath and with two more bedrooms this home has everything you need to move in today! Enjoy your private, fenced backyard oasis. Close to schools, shopping, transit services. Palisades is a private community with security cameras and gated entrance.
Key facts
- Vaulted ceilings
- Open-concept layout
- 2 parking spots
Tags
Property features AI
Finance
- Other: Calculated living area approximately 1008 square feet; Foundation: see remarks
- Financial info: Listing terms: Cash or Conventional
- HOA & community: Park approved for sale; Palisades Estates community; Clubhouse, common area, playground, recreational area; Bus line nearby; Pets allowed: cats and dogs (see remarks); 74 homes in the park; Land lease (monthly) of $1,050
Exterior
- Parking: Carport
- Security: Security gate
- Utilities: Electric energy source; Public water; Public sewer; PSE power
- Home design: Manufactured home (double wide); Fleetwood 38x28 model; One story; Very good condition; Mobile home remains
- Construction: Metal/vinyl exterior; Composition roof
- Exterior features: Patio/porch/deck; Landscaped; Paved lot
Interior
- Kitchen: Refrigerator; Stove/Range
- Bedrooms: 3 bedrooms
- Flooring: Laminate
- Bathrooms: 1 full bath; 1 half bath; 1 bathtub; 1 shower
- Heating & cooling: Forced air heating
- Interior features: Vaulted ceilings; Dining room; Entry; Kitchen with eating space; Living room; Utility room
- Laundry & utility: Washer; Dryer
Neighborhood map
What this means for you Summary
Snapshot
- This is a 3-bed/1.5-bath manufactured listed at $184k.
Deal economics
- At list price, monthly cash flow is $468 ($6k/yr) — positive.
- The deal already cash-flows at list — no discount required.
- Meets the 1% rule at list price ($2k rent vs $184k).
- Recommended offer: $162k (12.0% below list) — sets the bar for market timing.
- Cap rate 9.3% vs local median 2.7% in Auburn — top-decile yield for the area; either an underpriced asset or a hidden risk that comps aren't pricing in. Stress-test before assuming the spread holds.
Location & tenants
- Location reads 81/100 on livability (#75 in WA, #1,371 nationally) — a professional / high-income tenant draw. Strengths: amenities A+, commute A+, employment A+; Watch: crime F, cost of living F.
- Auburn School District (urban): math 47% / reading 56% proficiency, ranked #125 of 291 in WA (top 43%) — acceptable for families but not a draw, mixed tenant base, ~2y average lease.
- Market conditions: Rents soft (-0.5%/yr); 291 active listings in the ZIP; 7 comparable units currently listed for rent nearby; rentals leasing fast (median 2d on market — plan ~1-2 weeks tenant-placement turnaround); high-income renter base; 10,555 units permitted in King County in 2024 (7,119 in 5+ unit buildings).
Forward outlook
- In year one you build about $20k of equity ($1k loan paydown + $18k appreciation (10.0% local appreciation)).
- King County population projected at +44% by 2050 — long-run rental-demand tailwind backs the buy-and-hold thesis.
- At projected returns (10.0% appreciation + 0.0% rent growth), your $52k cash investment doubles in ~2 years — after that, you're playing with house money.
- By year 2, paydown + projected appreciation supports a ~$32k cash-out refi (75% LTV) — recoverable capital for the next deal without selling this one.
Negotiation context
- It's been on market 153 days — a 12% lower offer ($162k) is reasonable based on typical stale-listing flexibility.
- 4 sale attempts since 24y ago with the ask held roughly flat each time — persistent listings suggest the price (not the market) is what's stuck; bring a comps-based counter.
- Current owner paid $16k; list at $184k implies a 1053% gain — meaningful room to come down on a strong offer.
Questions for the listing agent
- It's been on market 153 days. Have you received any prior offers? Is the seller open to a 12% concession, seller financing, or rate buy-down credit?
- Why hasn't it sold? Are there any deal-killer items the seller is aware of (foundation, flood, title, zoning, code violations)?
- Is there a deadline driving the sale (1031 exchange, divorce, estate, relocation)? That informs how much negotiation room exists.
- Crime grade is F in this area — have there been break-ins, vandalism, or insurance claims at this property in the last 3 years? What carrier currently insures it and at what premium?
- What's the average days-on-market for RENTAL listings here right now (not sales)? A rising rental-DOM trend means longer vacancies and softer asking-rent achievability than the comps imply.
- What's the recent tenant-quality profile in this submarket — average credit score on applications, eviction rate, late-payment / NSF rate, and stable-employment percentage? A property-management company in the area should have these aggregated.
- How much new for-sale + rental construction is in the pipeline within 1–3 miles? Heavy new supply typically softens prices + rents 12–24 months out; constrained supply supports both.
Investment metrics
- 1% rule
- 1.20% ✓
- Cap rate
- 9.34%
- Cash-on-cash
- 10.88%
- DSCR
- 1.48
- GRM
- 7.0
CMA / ARV
No comps found within radius.
Projected returns pro-forma
10.0% appreciation · 0.0% rent growth · sell at horizon
- IRR
- 30.9%
- Equity multiple
- 3.40×
- Total profit
- $123,883
- Equity at exit
- $166,212
- IRR
- 25.9%
- Equity multiple
- 7.38×
- Total profit
- $329,840
- Equity at exit
- $358,443
Cash invested: $51,660 (down + closing). Projections, not guarantees.
Landlord ↔ Tenant lean methodology
- Overall (STATE)
- 28 Tenant-Leaning
- State Washington
- 28 Tenant-Leaning · D+8
- County
- — inherits STATE
- City
- — inherits STATE
ZIP-level market 98092
- Home prices YoY
- 3.3%
- Rents YoY
- -0.5%
- Active inventory
- 291
- Price-to-rent
- 7.0×
Monthly cashflow live
- Estimated rent
- $2,207 high interval (Pro) →
- Mortgage (P&I)
- −$968
- Tax est. 1.5%
- −$231 /mo · $2,768/yr
- Insurance
- −$77
- HOA
- −$0
- Vacancy / Maint / Mgmt
- −$463
- Net cashflow
- $468
Break-even live
UW: 25.0% down · 7.5% · 30yr · 1.5% tax · 5.0% vac · 8.0% maint · 8.0% mgmt
Financing live
Cash to close
- Down payment
- $46,125
- Closing costs
- $5,535
- Reserves months
- —
- Total cash needed
- —
Loan-product check · same deal, 3 products live
Conventional
25% down · 7.5% · 30yr
- Down + closing
- —
- Monthly P&I
- —
- Monthly cashflow
- —
- DSCR
- —
- Eligible?
- —
Personal DTI + credit; lowest rate.
DSCR
20% down · 8.5% · 30yr
- Down + closing
- —
- Monthly P&I
- —
- Monthly cashflow
- —
- DSCR
- —
- Eligible?
- —
No personal income docs; deal must DSCR.
Hard money
10% down · 12.0% · 12mo
- Down + closing
- —
- Monthly P&I
- —
- Monthly cashflow
- —
- DSCR
- —
- Eligible?
- —
Short-term bridge; refi at stabilization.
Rent comps 7 comps
| Address | Beds | Baths | Sqft | Rent | $/sqft | DOM | Units | Dist |
|---|---|---|---|---|---|---|---|---|
| 2220 Noble Ct SE Auburn, WA | 2.0 | 1.5–2.0 | 1200 | $2,100 | $1.75 | 1d | 2 | 0.17mi |
| 3320 Auburn Way S Auburn, WA | 2.0 | 1.5 | 1033 | $2,200 | $2.13 | 1d | 1 | 0.18mi |
| 2901 Auburn Way S Auburn, WA | 1.0–2.0 | 1.0 | 667 | $2,175 | $3.26 | 1d | 20 | 0.41mi |
| 1526 29th St SE Auburn, WA | 2.0 | 1.0 | 912 | $1,595 | $1.75 | 24d | 1 | 1.31mi |
| 1420 17th St SE Auburn, WA | 1.0–2.0 | 1.0 | 725 | $1,695 | $2.34 | 3d | 4 | 1.36mi |
| 2952 O St SE Unit D Auburn, WA | 2.0 | 1.0 | 795 | $1,375 | $1.73 | 2d | 1 | 1.38mi |
| 2952 O St SE Unit F Auburn, WA | 2.0 | 1.0 | 1051 | $1,495 | $1.42 | 2d | 1 | 1.38mi |
Listing history 26 events
-
2026-06-18days on market $184,500 Active 153 DOM
-
2026-06-17days on market $184,500 Active 152 DOM
-
2026-06-16days on market $184,500 Active 151 DOM
-
2026-06-15days on market $184,500 Active 150 DOM
-
2026-06-13days on market $184,500 Active 148 DOM
-
2026-06-13days on market $184,500 Active 147 DOM
-
2026-06-09days on market $184,500 Active 144 DOM
-
2026-06-08days on market $184,500 Active 143 DOM
-
2026-06-07days on market $184,500 Active 142 DOM
-
2026-06-04days on market $184,500 Active 139 DOM
-
2026-06-03days on market $184,500 Active 138 DOM
-
2026-06-02days on market $184,500 Active 137 DOM
-
2026-06-01days on market $184,500 Active 136 DOM
-
2026-05-31days on market $184,500 Active 135 DOM
-
2026-04-30price $184,500
-
2026-01-16$189,500 Active
-
2015-06-05historical
-
2015-06-04soldstatus $16,000 Sold
-
2015-05-27status Pending
-
2015-05-18price $18,000
-
2015-04-30status Active
-
2015-04-24status Pending
-
2015-02-24price $20,000
-
2015-01-06$22,500 Active
-
2002-08-30soldstatus $25,950
-
2002-04-01$25,950
ⓘ Source: listings_history table (triggers on properties + properties_extension) + one-shot
backfill from property_details.listing_events for pre-trigger history.
Climate risk First Street
- Flood 1/10 Low FEMA zone X (unshaded) · 0% chance over 30 yrs
- Wildfire 1/10 Low
- Heat 3/10 Moderate 7 d/yr ≥87°F today · 15 d/yr by 30 yrs out
- Wind 1/10 Low
- Air quality 7/10 Severe 10 unhealthy d/yr today · 11 by 30 yrs out
Nearby sold comps map
Loading sold comps map…
Walkable amenities ~0.75 mi
Loading nearby amenities…
Taxation est. · year 1
- Rental income
- $26,483
- − Mortgage interest
- −$10,335
- − Property taxes
- −$2,768
- − Insurance
- −$922
- − Repairs & maintenance
- −$2,119
- − Management
- −$2,119
- − Depreciation
- −$5,367
- Taxable income
- $2,854
- Est. tax owed @ 24.0%
- −$685
- After-tax cash flow
- $4,936/yr
For passive investors: Depreciation is non-cash, so a rental often shows a tax loss while cash-flowing — sheltering income. Rental losses are passive: they offset passive income freely, and up to $25,000/yr can offset ordinary (W-2) income if you actively participate and your MAGI is under $100k (phasing out to $0 by $150k); unused losses carry forward. On sale, claimed depreciation is recaptured at up to 25%, and gains may owe capital-gains tax (a 1031 exchange can defer both). Figures are a year-1 estimate at your 24.0% rate — not tax advice; consult a CPA.
Schools (NCES district)
- District
- Auburn School District
- NCES district ID
- 5300300
- Math proficiency
- 47% ▼ -3.00%
- Reading proficiency
- 56% ▼ -1.00%
- Median HH income
- $58,048
- Composite
- 46.73/100
- National rank
- #5240
- State rank
- #125 of 291 in WA
Livability — Auburn
- Score
- 81/100
- State rank
- #75
- US rank
- #1371
Category grades
Schools grade is shown separately in the Schools card above.
Census & demographics
- Census place
- Auburn, WA
- County
- King County · 2,251,916 people
- City population
- 74,969
- Metro
- Seattle-Tacoma-Bellevue, WA
- Population (ZIP)
- 50,224
- Household income
- $122,300
- Rent vs Own
- Severe rent burden
- 1041.0
Population outlook (King County) Hauer SSP2
- Today (2025)
- 2,576,485 people
- By 2030
- 2,803,316 · +8.8%
- By 2040
- 3,255,921 · +26.4%
- By 2050
- 3,706,444 · +43.9%
- By 2075
- 4,746,063 · +84.2%
- By 2100
- 5,407,730 · +109.9%
Race, ethnicity, and origin ACS 2023
- Neighborhood character
- Diverse neighborhood (Simpson 0.66)
- Race & ethnicity
- White 54% Hispanic / Latino 15% Asian 14% Two or more races 13% Native American 4% Black 3% Pacific Islander 2%
- Hispanic origin (detail)
- Mexican 12%
- Common ancestry
- Portuguese 4% Italian 3% Subsaharan African 3%
- Foreign-born
- 20% · Canada, South Korea, Vietnam
- Languages at home
- 73% English-only · Spanish 9% Russian/Polish/Slavic 4% Other Indo-European 3%
Political lean MEDSL · King
- 2024 margin
- Solid D (+51.7) · D 74.2% · R 22.5% · Other 3.4%
- 2008→2024 swing
- +9.6pp toward D · 2008: 42.1pp · 2024: 51.7pp
- All cycles
- 2024: D+51.7 2020: D+52.7 2016: D+50.4 2012: D+39.9 2008: D+42.1
Not yet ingested
- Civics
- —
Market trends
- HPI YoY
- ▲ 49.75%
- Current HPI
- 1554.06
- Rent YoY
- ▼ -0.46%
- Metro
- Seattle-Tacoma-Bellevue, WA
- State GDP YoY
- ▲ 4.65%
- F500 in state
- 22
Industry mix (Fortune 500 HQ in WA)
| Industry | F500 HQs | Revenue |
|---|---|---|
| Retail | 2 | $269B |
|
||
| Technology / Retail | 1 | $638B |
|
||
| Technology | 1 | $245B |
|
||
| Telecommunications | 1 | $38B |
|
||
| Food / Beverage | 1 | $36B |
|
||
| Automotive / Trucks | 1 | $34B |
|
||
Price history
+611.0% since first listed12 events — show timeline
- 2026-04-30 Price Changed $184,500 NWMLS as Distributed by MLS Grid
- 2026-01-16 Listed $189,500 NWMLS as Distributed by MLS Grid
- 2015-06-05 Delisted — NWMLS as Distributed by MLS Grid
- 2015-06-04 Sold (MLS) $16,000 NWMLS as Distributed by MLS Grid
- 2015-05-27 Pending — NWMLS as Distributed by MLS Grid
- 2015-05-18 Price Changed $18,000 NWMLS as Distributed by MLS Grid
- 2015-04-30 Relisted — NWMLS as Distributed by MLS Grid
- 2015-04-24 Pending — NWMLS as Distributed by MLS Grid
- 2015-02-24 Price Changed $20,000 NWMLS as Distributed by MLS Grid
- 2015-01-06 Listed $22,500 NWMLS as Distributed by MLS Grid
- 2002-08-30 Sold (MLS) $25,950 NWMLS as Distributed by MLS Grid
- 2002-04-01 Listed $25,950 NWMLS as Distributed by MLS Grid
Cash-flow waterfall
monthlySold comps — $/sqft
last 12 mo · ≤1 miLoading sold comps…