1150 N Delaware Dr #25 · Apache Junction, AZ
Flood risk 1/10 · Minimal
- FEMA flood zone
- X (shaded)
- Chance of flooding over 30 yrs
- 0.0%
- Est. flood insurance / yr
- $507 – $1,088
Fire risk 5/10 · Moderate
- Est. fire insurance / yr
- $610 – $1,132
Heat risk 8/10 · Major
- Hot days now (above 111°F)
- 5 days/yr
- Hot days in 30 yrs
- 12 days/yr
Wind risk 1/10 · Minimal
- Chance of severe wind over 30 yrs
- —
Air-quality risk 3/10 · Minor
- Unhealthy air days now
- 2 days/yr
- Unhealthy air days in 30 yrs
- 3 days/yr
Risk factors via First Street. Map © Google.
Why this score? — see what drove the B+ grade
The composite is a weighted blend of 9 inputs, each scored 0–100. Each bar is that input's sub-score; the figure is the points it added to the 100-point composite (weight × sub-score).
- Cash flow +30.0/30.0
- ARV discount +15.0/15.0
- 1% rule +10.0/10.0
- DSCR +10.0/10.0
- Condition / age +4.0/5.0
- Livability +3.3/5.0
- Rent growth +1.6/5.0
- Schools +1.5/10.0
- Appreciation +0.0/10.0
$32,000
🖨 Deal sheet 📄 Offer letter ✓ Due diligence
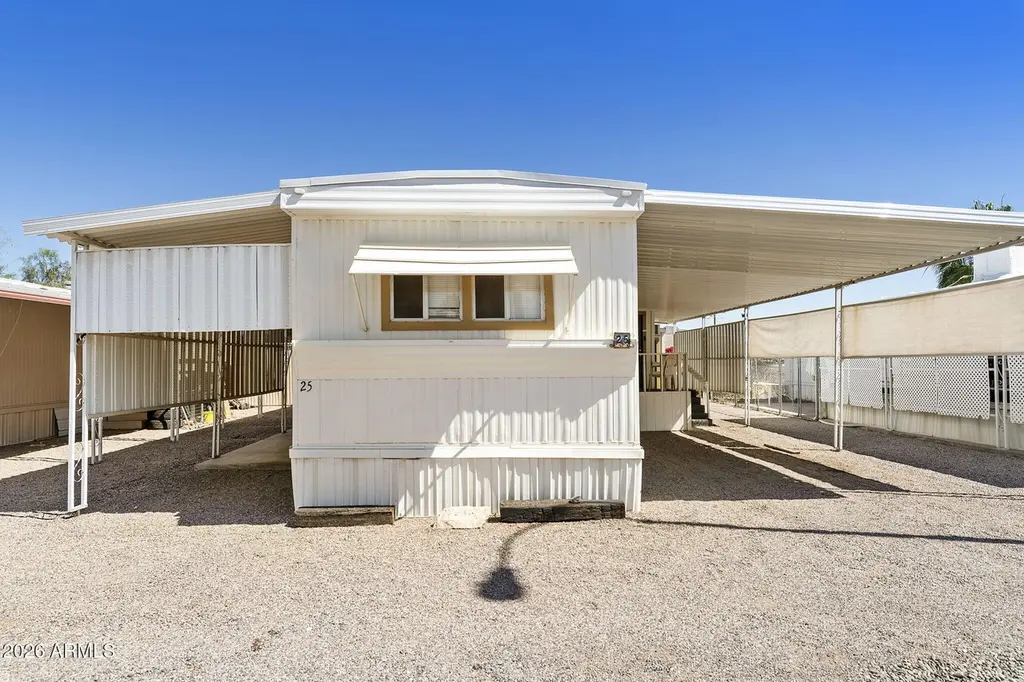
Listing remarks
Well maintained home in this smaller 104 unit 55+ community. One road in and one road out! Very reasonable lot rent of $530 monthly! Amenities include club house with pool table, community kitchen and 2 pet parks. Showers available at club house for RV'ers. More photos to come.
Key facts
- 2 parking spots
- Built 1969
- Listed 43 days
Property features AI
Finance
- HOA & community: Land lease community; Land lease fee $530 monthly; No association fees listed
Exterior
- Parking: 1 covered parking space; 1 open parking space; 1 carport space
- Utilities: Septic (connected); Private water company
- Home design: Manufactured / mobile home; Leasehold ownership
- Construction: Metal siding; Aluminum siding; Wood frame construction; Foam roof
- Exterior features: Storage; Shed(s); Gravel/stone front; Gravel/stone back; Private maintained road; Asphalt road surface
Interior
- Kitchen: Built-in microwave; Laminate counters
- Bedrooms: Up to 3 possible bedrooms
- Flooring: Laminate flooring
- Bathrooms: 1 full bathroom; 1 half bathroom
- Heating & cooling: Heat pump heating (electric); Central air conditioning; Ceiling fans
- Interior features: High speed internet available; Eat-in kitchen; Breakfast bar; 3/4 bath in master bedroom; Laminate countertops
- Laundry & utility: Laundry: Other (unspecified)
Neighborhood map
What this means for you Summary
Snapshot
- This is a 2-bed/1.5-bath manufactured listed at $32k. Condition is rated good.
Deal economics
- At list price, monthly cash flow is $769 ($9k/yr) — positive.
- The deal already cash-flows at list — no discount required.
- Meets the 1% rule at list price ($1k rent vs $32k).
- Recommended offer: $31k (3.0% below list) — sets the bar for market timing.
- Cap rate 35.1% vs local median 3.5% in Apache Junction — top-decile yield for the area; either an underpriced asset or a hidden risk that comps aren't pricing in. Stress-test before assuming the spread holds.
Location & tenants
- Location reads 66/100 on livability (#70 in AZ) — a middle-class / working-renter tenant base. Strengths: cost of living A+, housing A+; Watch: crime D+, schools F, amenities F.
- Apache Junction Unified District (4443) (suburban): math 15% / reading 20% proficiency, ranked #195 of 249 in AZ (top 78%) — low school quality limits family demand, transient renter base, plan for 1-2y turnover.
- Market conditions: Rents falling (-3.5%/yr); 455 active listings in the ZIP; 4 comparable units currently listed for rent nearby; rentals at typical pace (median 24d on market — plan ~3-4 weeks tenant-placement turnaround); 9,504 units permitted in Pinal County in 2024 (776 in 5+ unit buildings).
Forward outlook
- Local home prices are declining (-3.0%/yr); year-one equity from $221 of loan paydown is wiped out by about $960 of value loss. Plan a longer hold.
- At projected returns (-3.0% appreciation + 0.0% rent growth), your $9k cash investment doubles in ~2 years — after that, you're playing with house money.
Negotiation context
- It's been on market 43 days — a 3% lower offer ($31k) is reasonable based on typical stale-listing flexibility.
Risks & watch-outs
- Climate carrying-cost: moderate wildfire risk; extreme-heat days projected 5→12/yr by 2055 (HVAC capex compounding) — expect insurance premiums to compound above CPI over the hold.
Questions for the listing agent
- It's been on market 43 days. Have you received any prior offers? Is the seller open to a 3% concession, seller financing, or rate buy-down credit?
- Built in 1969 — when were the roof, HVAC, electrical panel, plumbing, and water heater last replaced?
- Is there a deadline driving the sale (1031 exchange, divorce, estate, relocation)? That informs how much negotiation room exists.
- Schools are F-rated, which usually means shorter tenancies and higher turnover. Who's the typical renter profile here, and what's been the actual vacancy rate?
- Crime grade is D in this area — have there been break-ins, vandalism, or insurance claims at this property in the last 3 years? What carrier currently insures it and at what premium?
- What's the average days-on-market for RENTAL listings here right now (not sales)? A rising rental-DOM trend means longer vacancies and softer asking-rent achievability than the comps imply.
- What's the recent tenant-quality profile in this submarket — average credit score on applications, eviction rate, late-payment / NSF rate, and stable-employment percentage? A property-management company in the area should have these aggregated.
- How much new for-sale + rental construction is in the pipeline within 1–3 miles? Heavy new supply typically softens prices + rents 12–24 months out; constrained supply supports both.
Investment metrics
- 1% rule
- 3.92% ✓
- Cap rate
- 35.13%
- Cash-on-cash
- 102.99%
- DSCR
- 5.58
- GRM
- 2.1
CMA / ARV
- ARV (on-the-fly)
- $48,240
- Comps found
- 12
Show comp detail 12 sales within ~0.75 mi
| Address | Dist | Beds/Ba | Sqft | Sold | Price | $/sf | Match |
|---|---|---|---|---|---|---|---|
| 2338 W Shiprock St | 0.24mi | 2/1.5 | 721 (+0%) | 9mo | $250,000 | $347 | 81 |
| 929 N Delaware Dr #25 | 0.21mi | 1/1.0 (-1) | 730 (+1%) | 8mo | $27,000 | $37 | 74 |
| 1030 N Delaware Dr #17 | 0.09mi | 2/1.0 | 780 (+8%) | 8mo | $16,000 | $21 | 74 |
| 929 N Delaware Dr #15 | 0.21mi | 2/1.0 | 720 (0%) | 23mo | $21,000 | $29 | 69 |
| 2570 W Scenic St | 0.46mi | 2/1.0 | 724 (+1%) | 12mo | $220,000 | $304 | 66 |
| 1922 N Desert View Dr | 0.48mi | 2/1.0 | 660 (-8%) | 0mo | $130,000 | $197 | 61 |
| 2760 W Tepee St | 0.35mi | 2/1.0 | 673 (-6%) | 17mo | $165,000 | $245 | 56 |
| 2325 W Virginia St Unit V34 | 0.51mi | 2/1.5 | 700 (-3%) | 19mo | $47,000 | $67 | 56 |
| 351 N Meridian Rd #62 | 0.54mi | 2/1.0 | 728 (+1%) | 22mo | $22,000 | $30 | 53 |
| 1804 W Tepee St #54 | 0.59mi | 1/1.0 (-1) | 714 (-1%) | 17mo | $38,000 | $53 | 50 |
| 453 N Saguaro Dr | 0.69mi | 2/1.0 | 673 (-6%) | 9mo | $129,000 | $192 | 47 |
| 1804 W Tepee St #64 | 0.59mi | 2/1.5 | 784 (+9%) | 16mo | $39,000 | $50 | 44 |
Match score weights: distance 35% · size 25% · config 20% · recency 20%. Top-matched comps best support the ARV.
Projected returns pro-forma
-3.0% appreciation · 0.0% rent growth · sell at horizon
- IRR
- —
- Equity multiple
- 5.48×
- Total profit
- $40,138
- Equity at exit
- $4,771
- IRR
- —
- Equity multiple
- 10.36×
- Total profit
- $83,900
- Equity at exit
- $2,767
Cash invested: $8,960 (down + closing). Projections, not guarantees.
Landlord ↔ Tenant lean methodology
- Overall (STATE)
- 87 Strongly Landlord-Friendly
- State Arizona
- 87 Strongly Landlord-Friendly · R+3
- County
- — inherits STATE
- City
- — inherits STATE
ZIP-level market 85120
- Home prices YoY
- -29.0%
- Rents YoY
- -3.5%
- Active inventory
- 455
- Price-to-rent
- 2.1×
Monthly cashflow live
- Estimated rent
- $1,253 medium interval (Pro) →
- Mortgage (P&I)
- −$168
- Tax est. 1.5%
- −$40 /mo · $480/yr
- Insurance
- −$13
- HOA
- −$0
- Vacancy / Maint / Mgmt
- −$263
- Net cashflow
- $769
Break-even live
UW: 25.0% down · 7.5% · 30yr · 1.5% tax · 5.0% vac · 8.0% maint · 8.0% mgmt
Financing live
Cash to close
- Down payment
- $8,000
- Closing costs
- $960
- Reserves months
- —
- Total cash needed
- —
Loan-product check · same deal, 3 products live
Conventional
25% down · 7.5% · 30yr
- Down + closing
- —
- Monthly P&I
- —
- Monthly cashflow
- —
- DSCR
- —
- Eligible?
- —
Personal DTI + credit; lowest rate.
DSCR
20% down · 8.5% · 30yr
- Down + closing
- —
- Monthly P&I
- —
- Monthly cashflow
- —
- DSCR
- —
- Eligible?
- —
No personal income docs; deal must DSCR.
Hard money
10% down · 12.0% · 12mo
- Down + closing
- —
- Monthly P&I
- —
- Monthly cashflow
- —
- DSCR
- —
- Eligible?
- —
Short-term bridge; refi at stabilization.
Rent comps 4 comps
| Address | Beds | Baths | Sqft | Rent | $/sqft | DOM | Units | Dist |
|---|---|---|---|---|---|---|---|---|
| 135 N Palo Verde Dr Apache Junction, AZ | 1.0 | 1.0 | 750 | $915 | $1.22 | 20d | 1 | 0.75mi |
| 135 N Palo Verde Dr Unit 8 Apache Junction, AZ | 1.0 | 1.0 | 750 | $925 | $1.23 | 24d | 1 | 0.75mi |
| 561 S Meridian Rd Unit 1 Apache Junction, AZ | 2.0 | 1.0 | 700 | $1,099 | $1.57 | 24d | 1 | 1.10mi |
| 960 S Mara Dr Unit 1 Apache Junction, AZ | 2.0 | 1.0 | 682 | $1,450 | $2.13 | 12d | 1 | 1.37mi |
Listing history 14 events
-
2026-06-18days on market $32,000 Active 43 DOM
-
2026-06-17days on market $32,000 Active 42 DOM
-
2026-06-16days on market $32,000 Active 41 DOM
-
2026-06-15days on market $32,000 Active 40 DOM
-
2026-06-13days on market $32,000 Active 38 DOM
-
2026-06-09days on market $32,000 Active 34 DOM
-
2026-06-08days on market $32,000 Active 33 DOM
-
2026-06-07days on market $32,000 Active 32 DOM
-
2026-06-04days on market $32,000 Active 29 DOM
-
2026-06-03days on market $32,000 Active 28 DOM
-
2026-06-02days on market $32,000 Active 27 DOM
-
2026-06-01days on market $32,000 Active 26 DOM
-
2026-05-31days on market $32,000 Active 25 DOM
-
2026-05-06$42,000 Active
ⓘ Source: listings_history table (triggers on properties + properties_extension) + one-shot
backfill from property_details.listing_events for pre-trigger history.
Climate risk First Street
- Flood 1/10 Low FEMA zone X (shaded) · 0% chance over 30 yrs
- Wildfire 5/10 Major
- Heat 8/10 Severe 5 d/yr ≥111°F today · 12 d/yr by 30 yrs out
- Wind 1/10 Low
- Air quality 3/10 Moderate 2 unhealthy d/yr today · 3 by 30 yrs out
Nearby sold comps map
Loading sold comps map…
Walkable amenities ~0.75 mi
Loading nearby amenities…
Taxation est. · year 1
- Rental income
- $15,040
- − Mortgage interest
- −$1,792
- − Property taxes
- −$480
- − Insurance
- −$160
- − Repairs & maintenance
- −$1,203
- − Management
- −$1,203
- − Depreciation
- −$931
- Taxable income
- $9,270
- Est. tax owed @ 24.0%
- −$2,225
- After-tax cash flow
- $7,003/yr
For passive investors: Depreciation is non-cash, so a rental often shows a tax loss while cash-flowing — sheltering income. Rental losses are passive: they offset passive income freely, and up to $25,000/yr can offset ordinary (W-2) income if you actively participate and your MAGI is under $100k (phasing out to $0 by $150k); unused losses carry forward. On sale, claimed depreciation is recaptured at up to 25%, and gains may owe capital-gains tax (a 1031 exchange can defer both). Figures are a year-1 estimate at your 24.0% rate — not tax advice; consult a CPA.
Condition & rehab AI · 12 photos
This well-maintained mobile home in a 55+ community is ready for a fresh coat of paint and new gutters to enhance its curb appeal and value.
Value-add opportunities
- Both Paint exterior — Enhances curb appeal and value
- Both Replace gutters — Improves drainage and aesthetics
Renovation cost estimate screening
Value-add ROI direction
- Both Paint exterior — Enhances curb appeal and value ↑
- Both Replace gutters — Improves drainage and aesthetics ↑
ⓘ Cost ranges are severity-bucket heuristics (US national rule-of-thumb). Get contractor quotes + a written scope before underwriting a rehab budget.
Schools (NCES district)
- District
- Apache Junction Unified District (4443)
- NCES district ID
- 0400790
- Math proficiency
- 15% ▼ -17.00%
- Reading proficiency
- 20% ▼ -13.00%
- Median HH income
- $44,930
- Composite
- 15.34/100
- National rank
- #9325
- State rank
- #195 of 249 in AZ
Livability — Apache Junction
- Score
- 66/100
- State rank
- #70
- US rank
- #11242
Category grades
Schools grade is shown separately in the Schools card above.
Census & demographics
- Census place
- Apache Junction, AZ
- County
- Pinal County · 399,947 people
- City population
- 56,611
- Metro
- Phoenix-Mesa-Chandler, AZ
- Population (ZIP)
- 31,191
- Household income
- $57,786
- Rent vs Own
- Severe rent burden
- 686.0
Population outlook (Pinal County) Hauer SSP2
- Today (2025)
- 437,574 people
- By 2030
- 446,903 · +2.1%
- By 2040
- 452,589 · +3.4%
- By 2050
- 444,126 · +1.5%
- By 2075
- 430,300 · -1.7%
- By 2100
- 393,536 · -10.1%
Race, ethnicity, and origin ACS 2023
- Neighborhood character
- Predominantly White (77%)
- Race & ethnicity
- White 77% Hispanic / Latino 16% Two or more races 10% Asian 1%
- Hispanic origin (detail)
- Mexican 13%
- Common ancestry
- Romanian 3% Lithuanian 3% Portuguese 3%
- Foreign-born
- 7% · Canada
- Languages at home
- 89% English-only · Spanish 8% Tagalog/Filipino 1%
Political lean MEDSL · Pinal
- 2024 margin
- Strong R (+22.1) · D 38.5% · R 60.6%
- 2008→2024 swing
- -7.6pp toward R · 2008: -14.5pp · 2024: -22.1pp
- All cycles
- 2024: R+22.1 2020: R+17.3 2016: R+19.3 2012: R+17.1 2008: R+14.5
Not yet ingested
- Civics
- —
Market trends
- HPI YoY
- ▼ -128.31%
- Current HPI
- 313.4666
- Rent YoY
- ▼ -3.50%
- Metro
- Phoenix-Mesa-Chandler, AZ
- State GDP YoY
- ▲ 4.54%
- F500 in state
- 20
Industry mix (Fortune 500 HQ in AZ)
| Industry | F500 HQs | Revenue |
|---|---|---|
| Technology | 2 | $13B |
|
||
| Mining / Metals | 1 | $23B |
|
||
| Environmental Services | 1 | $16B |
|
||
| Metals / Steel | 1 | $14B |
|
||
| Technology Distribution | 1 | $9B |
|
||
| Homebuilding | 1 | $8B |
|
||
Price history
1 event — show timeline
- 2026-05-06 Listed $42,000 ARMLS
Cash-flow waterfall
monthlySold comps — $/sqft
last 12 mo · ≤1 miLoading sold comps…