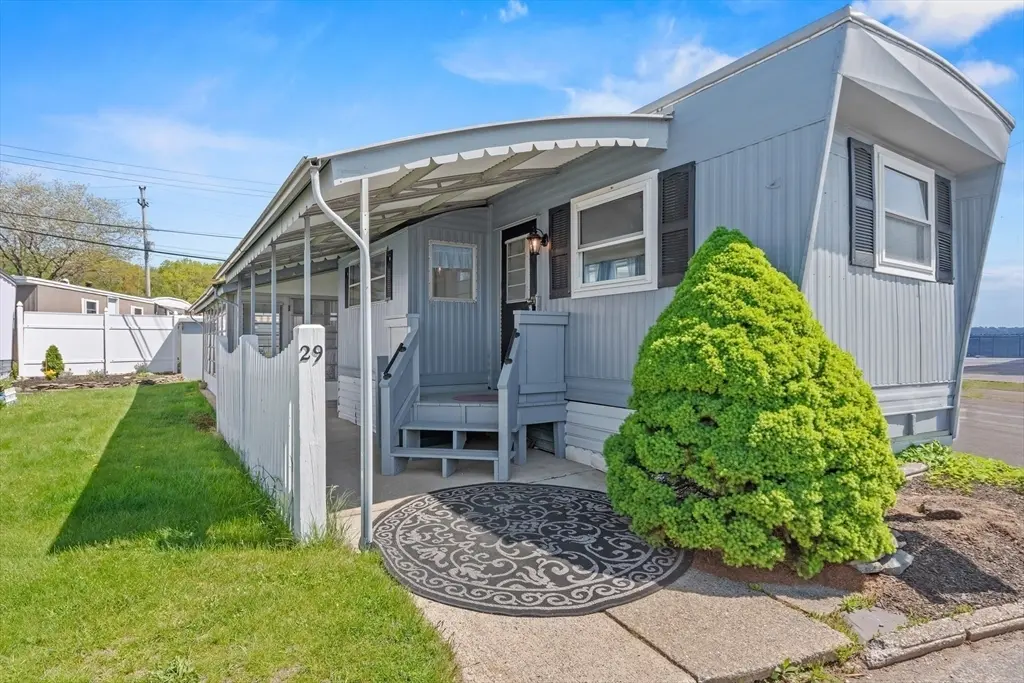
131 Washington St #29 · Foxborough, MA
Flood risk No data
- FEMA flood zone
- —
- Chance of flooding over 30 yrs
- —
- Est. flood insurance / yr
- —
Fire risk No data
- Est. fire insurance / yr
- —
Heat risk 5/10 · Moderate
- Hot days now (above threshold)
- 7 days/yr
- Hot days in 30 yrs
- 15 days/yr
Wind risk No data
- Chance of severe wind over 30 yrs
- —
Air-quality risk 2/10 · Minimal
- Unhealthy air days now
- 1 days/yr
- Unhealthy air days in 30 yrs
- 2 days/yr
Risk factors via First Street. Map © Google.
Why this score? — see what drove the B+ grade
The composite is a weighted blend of 9 inputs, each scored 0–100. Each bar is that input's sub-score; the figure is the points it added to the 100-point composite (weight × sub-score).
- Cash flow +29.9/30.0
- ARV discount +15.0/15.0
- 1% rule +10.0/10.0
- DSCR +10.0/10.0
- Schools +4.9/10.0
- Condition / age +4.0/5.0
- Livability +3.4/5.0
- Rent growth +2.5/5.0
- Appreciation +0.0/10.0
$125,000
🖨 Deal sheet 📄 Offer letter ✓ Due diligence
Listing remarks
Welcome to Crossroads Village and enjoy recently renovated 2 bedroom mobile with beautiful NEW bathroom with step in shower, kitchen has new base cabinets and counters, new plumbing, NEW furnace, NEW hot water heater, Exterior and interior painted . List in home of more improvements! Lot fee includes water, septic, trash receptacle, snow removal common areas. Resident owned Park. Buyer application to be approved by Park. $100: membership fee yrly. The
Key facts
- New base cabinets
- New plumbing
- New bathroom
Tags
Property features AI
Finance
- HOA & community: Association present; association fee applies; Senior community; Community offers shopping, medical facility access, highway access, and nearby houses of worship
Exterior
- Parking: Assigned parking (1 space, open)
- Utilities: Public water; Private sewer; Circuit breaker electrical service; Connections for electric range, electric oven, and electric dryer
- Home design: Mobile home (house with addition); Gray exterior; Renovated since original construction
- Construction: Modular construction; Block and slab foundation
- Exterior features: Enclosed porch; Covered patio/deck; Exterior storage; Level lot; Private road frontage
Interior
- Kitchen: Range; Refrigerator
- Bedrooms: Master bedroom on the first floor; Second bedroom on the first floor
- Flooring: Laminate
- Bathrooms: One full bathroom
- Heating & cooling: Forced-air heating; Propane heating
- Interior features: Five total rooms; Laminate flooring; Enclosed and covered porch/patio with additional storage
- Laundry & utility: Washer hookup (first floor); Electric dryer hookup (first floor); Washer and dryer included
Neighborhood map
What this means for you Summary
Snapshot
- This is a 2-bed/1.0-bath manufactured listed at $125k. Condition is rated good.
Deal economics
- At list price, monthly cash flow is $463 ($6k/yr) — positive.
- The deal already cash-flows at list — no discount required.
- Meets the 1% rule at list price ($3k rent vs $125k).
- Recommended offer: $121k (3.0% below list) — sets the bar for market timing.
- Cap rate 10.7% vs local median 3.1% in Foxborough — top-decile yield for the area; either an underpriced asset or a hidden risk that comps aren't pricing in. Stress-test before assuming the spread holds.
Location & tenants
- Location reads 67/100 on livability (#164 in MA) — a middle-class / working-renter tenant base. Strengths: employment A, schools A-, crime B+; Watch: amenities F, commute F, cost of living F.
- Foxborough (suburban): math 49% / reading 57% proficiency, ranked #91 of 302 in MA (top 30%) — acceptable for families but not a draw, mixed tenant base, ~2y average lease; only 13% free/reduced lunch — higher-income household profile.
- Market conditions: 25 active listings in the ZIP; 2 comparable units currently listed for rent nearby; high-income renter base; 958 units permitted in Norfolk County in 2024 (305 in 5+ unit buildings).
Forward outlook
- Local home prices are declining (-3.0%/yr); year-one equity from $864 of loan paydown is wiped out by about $4k of value loss. Plan a longer hold.
- Norfolk County population projected at +10% by 2050 — modest demand growth; plan on rents tracking national, not racing it.
- At projected returns (-3.0% appreciation + 3.0% rent growth), your $35k cash investment doubles in ~8 years — after that, you're playing with house money.
Negotiation context
- It's been on market 32 days — a 3% lower offer ($121k) is reasonable based on typical stale-listing flexibility.
Risks & watch-outs
- Watch-outs: HOA is 26% of rent.
- Climate carrying-cost: extreme-heat days projected 7→15/yr by 2055 (HVAC capex compounding) — expect insurance premiums to compound above CPI over the hold.
Questions for the listing agent
- It's been on market 32 days. Have you received any prior offers? Is the seller open to a 3% concession, seller financing, or rate buy-down credit?
- Built in 1966 — when were the roof, HVAC, electrical panel, plumbing, and water heater last replaced?
- What does the HOA fee cover, when was the last increase, and are there any pending special assessments or reserve-fund shortfalls?
- Is there a deadline driving the sale (1031 exchange, divorce, estate, relocation)? That informs how much negotiation room exists.
- Schools are A-rated — typically a magnet for longer-tenancy family renters. What's the average tenant stay here, and is there a school-zone premium baked into asking?
- What's the average days-on-market for RENTAL listings here right now (not sales)? A rising rental-DOM trend means longer vacancies and softer asking-rent achievability than the comps imply.
- What's the recent tenant-quality profile in this submarket — average credit score on applications, eviction rate, late-payment / NSF rate, and stable-employment percentage? A property-management company in the area should have these aggregated.
- How much new for-sale + rental construction is in the pipeline within 1–3 miles? Heavy new supply typically softens prices + rents 12–24 months out; constrained supply supports both.
Investment metrics
- 1% rule
- 2.02% ✓
- Cap rate
- 10.73%
- Cash-on-cash
- 15.86%
- DSCR
- 1.71
- GRM
- 4.1
CMA / ARV
- ARV (on-the-fly)
- $168,204
- Comps found
- 1
Show comp detail 1 sale within ~0.75 mi
| Address | Dist | Beds/Ba | Sqft | Sold | Price | $/sf | Match |
|---|---|---|---|---|---|---|---|
| 131 Washington St #11 | 0.08mi | 2/1.0 | 700 (-11%) | 15mo | $150,000 | $214 | 66 |
Match score weights: distance 35% · size 25% · config 20% · recency 20%. Top-matched comps best support the ARV.
Projected returns pro-forma
-3.0% appreciation · 3.0% rent growth · sell at horizon
- IRR
- 7.0%
- Equity multiple
- 1.28×
- Total profit
- $9,661
- Equity at exit
- $18,638
- IRR
- 16.6%
- Equity multiple
- 2.38×
- Total profit
- $48,178
- Equity at exit
- $10,808
Cash invested: $35,000 (down + closing). Projections, not guarantees.
Landlord ↔ Tenant lean methodology
- Overall (STATE)
- 20 Strongly Tenant-Friendly
- State Massachusetts
- 20 Strongly Tenant-Friendly · D+15
- County
- — inherits STATE
- City
- — inherits STATE
ZIP-level market 02035
- Active inventory
- 25
- Price-to-rent
- 4.1×
Monthly cashflow live
- Estimated rent
- $2,523 medium interval (Pro) →
- Mortgage (P&I)
- −$656
- Tax est. 1.5%
- −$156 /mo · $1,875/yr
- Insurance
- −$52
- HOA
- −$667
- Vacancy / Maint / Mgmt
- −$530
- Net cashflow
- $463
Break-even live
UW: 25.0% down · 7.5% · 30yr · 1.5% tax · 5.0% vac · 8.0% maint · 8.0% mgmt
Financing live
Cash to close
- Down payment
- $31,250
- Closing costs
- $3,750
- Reserves months
- —
- Total cash needed
- —
Loan-product check · same deal, 3 products live
Conventional
25% down · 7.5% · 30yr
- Down + closing
- —
- Monthly P&I
- —
- Monthly cashflow
- —
- DSCR
- —
- Eligible?
- —
Personal DTI + credit; lowest rate.
DSCR
20% down · 8.5% · 30yr
- Down + closing
- —
- Monthly P&I
- —
- Monthly cashflow
- —
- DSCR
- —
- Eligible?
- —
No personal income docs; deal must DSCR.
Hard money
10% down · 12.0% · 12mo
- Down + closing
- —
- Monthly P&I
- —
- Monthly cashflow
- —
- DSCR
- —
- Eligible?
- —
Short-term bridge; refi at stabilization.
Rent comps 2 comps
| Address | Beds | Baths | Sqft | Rent | $/sqft | DOM | Units | Dist |
|---|---|---|---|---|---|---|---|---|
| 18 Pierce St Foxboro, MA | 2.0 | 1.0 | 750 | $2,300 | $3.07 | 19d | 1 | 0.29mi |
| 18 Pierce St Unit 3B Foxborough, MA | 2.0 | 1.0 | 850 | $2,250 | $2.65 | 1d | 1 | 0.29mi |
HOA detail
- Monthly dues
- $667 · $8,004/yr
- Likely covers
- watertrashsnow removal
Listing history 14 events
-
2026-06-18days on market $125,000 Active 32 DOM
-
2026-06-17days on market $125,000 Active 31 DOM
-
2026-06-16days on market $125,000 Active 30 DOM
-
2026-06-15days on market $125,000 Active 29 DOM
-
2026-06-13days on market $125,000 Active 27 DOM
-
2026-06-09days on market $125,000 Active 23 DOM
-
2026-06-08days on market $125,000 Active 22 DOM
-
2026-06-07days on market $125,000 Active 21 DOM
-
2026-06-04days on market $125,000 Active 18 DOM
-
2026-06-03days on market $125,000 Active 17 DOM
-
2026-06-02days on market $125,000 Active 16 DOM
-
2026-06-01days on market $125,000 Active 15 DOM
-
2026-05-31days on market $125,000 Active 14 DOM
-
2026-05-17$125,000 New
ⓘ Source: listings_history table (triggers on properties + properties_extension) + one-shot
backfill from property_details.listing_events for pre-trigger history.
Climate risk First Street
- Heat 5/10 Major
- Air quality 2/10 Low 1 unhealthy d/yr today · 2 by 30 yrs out
Nearby sold comps map
Loading sold comps map…
Walkable amenities ~0.75 mi
Loading nearby amenities…
Taxation est. · year 1
- Rental income
- $30,281
- − Mortgage interest
- −$7,002
- − Property taxes
- −$1,875
- − Insurance
- −$625
- − Repairs & maintenance
- −$2,423
- − Management
- −$2,423
- − HOA
- −$8,004
- − Depreciation
- −$3,636
- Taxable income
- $4,294
- Est. tax owed @ 24.0%
- −$1,031
- After-tax cash flow
- $4,522/yr
For passive investors: Depreciation is non-cash, so a rental often shows a tax loss while cash-flowing — sheltering income. Rental losses are passive: they offset passive income freely, and up to $25,000/yr can offset ordinary (W-2) income if you actively participate and your MAGI is under $100k (phasing out to $0 by $150k); unused losses carry forward. On sale, claimed depreciation is recaptured at up to 25%, and gains may owe capital-gains tax (a 1031 exchange can defer both). Figures are a year-1 estimate at your 24.0% rate — not tax advice; consult a CPA.
Condition & rehab AI · 11 photos
This recently renovated mobile home is in good condition with fresh paint, new flooring, and updated appliances. It offers a good investment opportunity with potential for further value enhancement.
Value-add opportunities
- Both Painting exterior and interior — Fresh paint enhances curb appeal and interior aesthetics
- Both Replace flooring — New flooring improves comfort and appearance
- Both Replace kitchen appliances — Modern appliances increase functionality and appeal
- Both Replace bathroom fixtures — Upgraded fixtures enhance functionality and aesthetics
Renovation cost estimate screening
Value-add ROI direction
- Both Painting exterior and interior — Fresh paint enhances curb appeal and interior aesthetics ↑
- Both Replace flooring — New flooring improves comfort and appearance ↑
- Both Replace kitchen appliances — Modern appliances increase functionality and appeal ↑
- Both Replace bathroom fixtures — Upgraded fixtures enhance functionality and aesthetics ↑
ⓘ Cost ranges are severity-bucket heuristics (US national rule-of-thumb). Get contractor quotes + a written scope before underwriting a rehab budget.
Schools (NCES district)
- District
- Foxborough
- NCES district ID
- 2504950
- Math proficiency
- 49% ▼ -17.00%
- Reading proficiency
- 57% ▼ -1.00%
- Median HH income
- $91,142
- Composite
- 49.18/100
- National rank
- #2042
- State rank
- #91 of 302 in MA
Livability — Foxborough
- Score
- 67/100
- State rank
- #164
- US rank
- #11021
Category grades
Schools grade is shown separately in the Schools card above.
Census & demographics
- County
- Norfolk County · 644,082 people
- City population
- 18,615
- Metro
- Boston-Cambridge-Newton, MA-NH
- Population (ZIP)
- 18,615
- Household income
- $115,833
- Rent vs Own
- Severe rent burden
- 537.0
Population outlook (Norfolk County) Hauer SSP2
- Today (2025)
- 737,259 people
- By 2030
- 755,213 · +2.4%
- By 2040
- 786,961 · +6.7%
- By 2050
- 813,019 · +10.3%
- By 2075
- 861,214 · +16.8%
- By 2100
- 845,063 · +14.6%
Race, ethnicity, and origin ACS 2023
- Neighborhood character
- Predominantly White (77%)
- Race & ethnicity
- White 77% Two or more races 7% Black 7% Asian 7% Hispanic / Latino 4%
- Common ancestry
- Romanian 3% Lithuanian 3% Russian 2%
- Foreign-born
- 10% · Canada, Vietnam, China
- Languages at home
- 84% English-only · Other Indo-European 3% French/Haitian/Cajun 3% Vietnamese 2%
Political lean MEDSL · Norfolk
- 2024 margin
- Strong D (+28.8) · D 63.3% · R 34.6% · Other 2.1%
- 2008→2024 swing
- +10.2pp toward D · 2008: 18.5pp · 2024: 28.8pp
- All cycles
- 2024: D+28.8 2020: D+36.3 2016: D+27.9 2012: D+16.1 2008: D+18.5
Not yet ingested
- Civics
- —
Market trends
- HPI YoY
- ▼ -302.51%
- Current HPI
- 266.8607
- Rent YoY
- —
- Metro
- Boston-Cambridge-Newton, MA-NH
- State GDP YoY
- ▲ 2.28%
- F500 in state
- 38
Industry mix (Fortune 500 HQ in MA)
| Industry | F500 HQs | Revenue |
|---|---|---|
| Technology | 3 | $17B |
|
||
| Insurance | 2 | $84B |
|
||
| Retail | 2 | $76B |
|
||
| Life Sciences | 1 | $43B |
|
||
| Energy Technology | 1 | $31B |
|
||
| Aerospace / Defense | 1 | $18B |
|
||
Price history
1 event — show timeline
- 2026-05-17 Listed $125,000 MLS PIN
Cash-flow waterfall
monthlySold comps — $/sqft
last 12 mo · ≤1 miLoading sold comps…