1109 Pecos St · Lockhart, TX
Flood risk 1/10 · Minimal
- FEMA flood zone
- X (unshaded)
- Chance of flooding over 30 yrs
- 0.0%
- Est. flood insurance / yr
- $507 – $1,088
Fire risk 5/10 · Moderate
- Est. fire insurance / yr
- $1,222 – $2,270
Heat risk 8/10 · Major
- Hot days now (above 108°F)
- 7 days/yr
- Hot days in 30 yrs
- 20 days/yr
Wind risk 8/10 · Major
- Chance of severe wind over 30 yrs
- 80.0%
Air-quality risk 1/10 · Minimal
- Unhealthy air days now
- 0 days/yr
- Unhealthy air days in 30 yrs
- 0 days/yr
Risk factors via First Street. Map © Google.
Why this score? — see what drove the D grade
The composite is a weighted blend of 9 inputs, each scored 0–100. Each bar is that input's sub-score; the figure is the points it added to the 100-point composite (weight × sub-score).
- Cash flow +15.3/30.0
- ARV discount +7.5/15.0
- 1% rule +5.4/10.0
- DSCR +4.7/10.0
- Livability +3.4/5.0
- Rent growth +2.5/5.0
- Condition / age +2.5/5.0
- Schools +2.4/10.0
- Appreciation +0.0/10.0
$140,000
🖨 Deal sheet 📄 Offer letter ✓ Due diligence
Listing remarks MLS
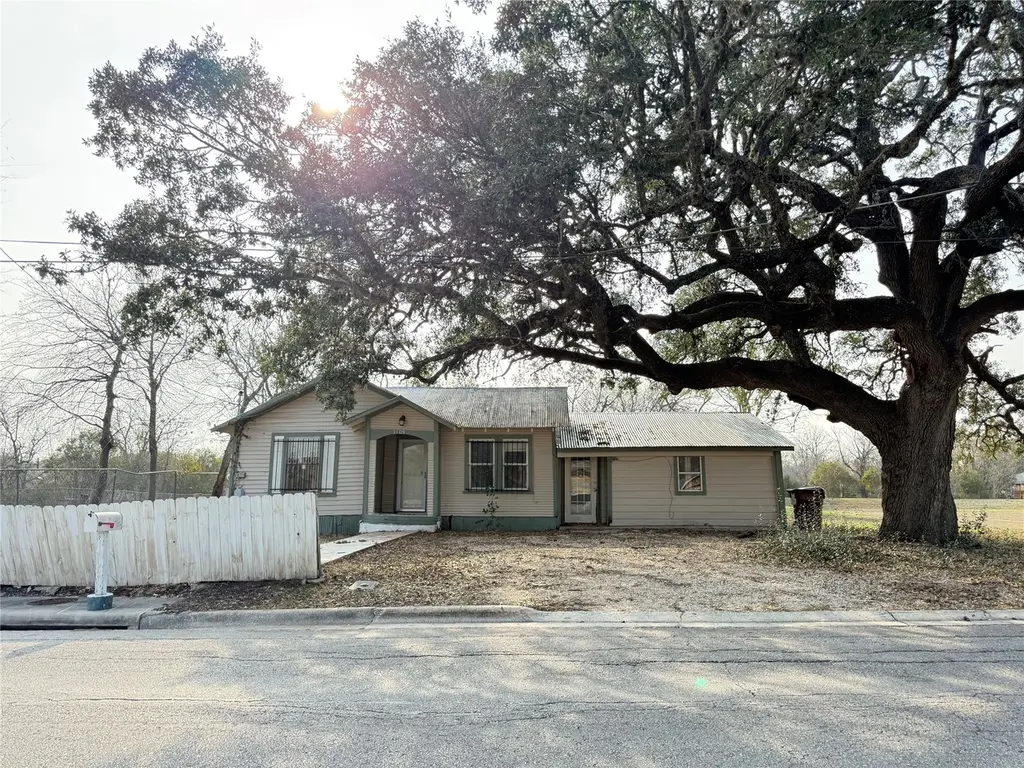
Opportunity awaits with this 3-bedroom, 1-bath home nestled just minutes from the vibrant downtown square of Lockhart. Rich with character and historic charm, this property features original siding and unique architectural details that make it the perfect canvas for restoration. Situated on a spacious lot, the home is shaded by a stunning mature tree that adds timeless beauty and curb appeal. The backyard offers ample space for expansion, outdoor living, or future improvements. This property is ideal for investors, flippers, or buyers with a vision to restore a historic home to its former glory. Whether you’re looking for your next renovation project or considering a tear-down to build new, the possibilities here are abundant. Conveniently located with quick access to HWY 183 and just minutes from downtown Lockhart’s dining, shopping, and entertainment. Bring your vision and creativity — this one is full of potential!
Key facts
- Mature tree
- Original siding
- Spacious lot
Tags
Neighborhood map
What this means for you Summary
Snapshot
- This is a 2-bed/1.0-bath single-family listed at $140k.
Deal economics
- At list price, monthly cash flow is $51 ($617/yr) — positive.
- The deal already cash-flows at list — no discount required.
- Meets the 1% rule at list price ($1k rent vs $140k).
- Recommended offer: $127k (9.0% below list) — sets the bar for market timing.
- Cap rate 6.7% vs local median 3.0% in Lockhart — top-decile yield for the area; either an underpriced asset or a hidden risk that comps aren't pricing in. Stress-test before assuming the spread holds.
Location & tenants
- Location reads 67/100 on livability (#535 in TX) — a middle-class / working-renter tenant base. Strengths: cost of living A+, housing A+, crime B+; Watch: schools D-, amenities F, commute F.
- Lockhart ISD (town): math 27% / reading 29% proficiency, ranked #657 of 826 in TX (top 80%) — low school quality limits family demand, transient renter base, plan for 1-2y turnover; 62% free/reduced lunch — lower-income household profile, screen leases tightly.
- Market conditions: 452 active listings in the ZIP; 22 comparable units currently listed for rent nearby; rentals lingering (median 44d on market — plan ~5-8 weeks vacancy on turnover, expect pricing pressure); 50% of comp listings sitting > 30 days — soft ceiling on asking rent; 529 units permitted in Caldwell County in 2024 (6 in 5+ unit buildings).
Forward outlook
- Local home prices are declining (-3.0%/yr); year-one equity from $968 of loan paydown is wiped out by about $4k of value loss. Plan a longer hold.
- Caldwell County population projected at +33% by 2050 — long-run rental-demand tailwind backs the buy-and-hold thesis.
Negotiation context
- It's been on market 117 days — a 9% lower offer ($127k) is reasonable based on typical stale-listing flexibility.
Risks & watch-outs
- Watch-outs: property tax is 2.6% of price; built in 1930 — expect roof / HVAC / electrical / plumbing capex.
- Climate carrying-cost: severe wind risk, 80% chance of damaging wind over 30y; moderate wildfire risk; extreme-heat days projected 7→20/yr by 2055 (HVAC capex compounding) — expect insurance premiums to compound above CPI over the hold.
Questions for the listing agent
- It's been on market 117 days. Have you received any prior offers? Is the seller open to a 9% concession, seller financing, or rate buy-down credit?
- Built in 1930 — when were the roof, HVAC, electrical panel, plumbing, and water heater last replaced?
- Property tax is high relative to price — has the assessment been appealed recently, and will the sale trigger a re-assessment?
- Why hasn't it sold? Are there any deal-killer items the seller is aware of (foundation, flood, title, zoning, code violations)?
- Is there a deadline driving the sale (1031 exchange, divorce, estate, relocation)? That informs how much negotiation room exists.
- Schools are D-rated, which usually means shorter tenancies and higher turnover. Who's the typical renter profile here, and what's been the actual vacancy rate?
- The area grade is low — what's the realistic commute time and amenity access for the typical tenant pool here? Any planned neighborhood developments (good or bad) we should know about?
- What's the average days-on-market for RENTAL listings here right now (not sales)? A rising rental-DOM trend means longer vacancies and softer asking-rent achievability than the comps imply.
- What's the recent tenant-quality profile in this submarket — average credit score on applications, eviction rate, late-payment / NSF rate, and stable-employment percentage? A property-management company in the area should have these aggregated.
- How much new for-sale + rental construction is in the pipeline within 1–3 miles? Heavy new supply typically softens prices + rents 12–24 months out; constrained supply supports both.
Investment metrics
- 1% rule
- 1.04% ✓
- Cap rate
- 6.73%
- Cash-on-cash
- 1.57%
- DSCR
- 1.07
- GRM
- 8.0
CMA / ARV
- ARV (median comp)
- $285,585
- List price
- $140,000
- Delta
- -50.98%
- Verdict
- UNDERPRICED
- Comps
- 20 within 1.0 mi
Show comp detail 9 sales within ~0.75 mi
| Address | Dist | Beds/Ba | Sqft | Sold | Price | $/sf | Match |
|---|---|---|---|---|---|---|---|
| 1310 Green St | 0.15mi | 3/2.0 (+1) | 1,430 (+0%) | 1mo | $299,000 | $209 | 83 |
| 739 Pear St | 0.43mi | 3/2.5 (+1) | 1,440 (+1%) | 2mo | $415,000 | $288 | 65 |
| 402 Laredo St | 0.53mi | 3/1.5 (+1) | 1,349 (-5%) | 2mo | $79,000 | $59 | 58 |
| 523 Ash St | 0.40mi | 3/1.0 (+1) | 1,323 (-7%) | 10mo | $289,999 | $219 | 56 |
| 815 Fir Ln | 0.70mi | 3/2.0 (+1) | 1,420 (-0%) | 8mo | $335,000 | $236 | 51 |
| 1529 N Colorado St N | 0.49mi | 3/2.0 (+1) | 1,578 (+11%) | 1mo | $265,000 | $168 | 50 |
| 140 Elm St | 0.61mi | 3/1.0 (+1) | 1,286 (-10%) | 7mo | $210,000 | $163 | 45 |
| 1107 Silent Valley Rd | 0.65mi | 3/2.0 (+1) | 1,500 (+5%) | 17mo | $339,000 | $226 | 38 |
| 208 N Rio Grande St | 0.63mi | 3/2.0 (+1) | 1,522 (+7%) | 20mo | $269,900 | $177 | 34 |
Match score weights: distance 35% · size 25% · config 20% · recency 20%. Top-matched comps best support the ARV.
Projected returns pro-forma
-3.0% appreciation · 3.0% rent growth · sell at horizon
- IRR
- -13.7%
- Equity multiple
- 0.51×
- Total profit
- $-19,310
- Equity at exit
- $20,874
- IRR
- -4.7%
- Equity multiple
- 0.69×
- Total profit
- $-12,188
- Equity at exit
- $12,105
Cash invested: $39,200 (down + closing). Projections, not guarantees.
Landlord ↔ Tenant lean methodology
- Overall (STATE)
- 87 Strongly Landlord-Friendly
- State Texas
- 87 Strongly Landlord-Friendly · R+5
- County
- — inherits STATE
- City
- — inherits STATE
ZIP-level market 78644
- Home prices YoY
- -29.4%
- Active inventory
- 452
- Price-to-rent
- 8.0×
Monthly cashflow live
- Estimated rent
- $1,452 high interval (Pro) →
- Mortgage (P&I)
- −$734
- Tax from tax record
- −$303 /mo · $3,641/yr
- Insurance
- −$58
- HOA
- −$0
- Vacancy / Maint / Mgmt
- −$305
- Net cashflow
- $51
Break-even live
UW: 25.0% down · 7.5% · 30yr · 1.5% tax · 5.0% vac · 8.0% maint · 8.0% mgmt
Financing live
Cash to close
- Down payment
- $35,000
- Closing costs
- $4,200
- Reserves months
- —
- Total cash needed
- —
Loan-product check · same deal, 3 products live
Conventional
25% down · 7.5% · 30yr
- Down + closing
- —
- Monthly P&I
- —
- Monthly cashflow
- —
- DSCR
- —
- Eligible?
- —
Personal DTI + credit; lowest rate.
DSCR
20% down · 8.5% · 30yr
- Down + closing
- —
- Monthly P&I
- —
- Monthly cashflow
- —
- DSCR
- —
- Eligible?
- —
No personal income docs; deal must DSCR.
Hard money
10% down · 12.0% · 12mo
- Down + closing
- —
- Monthly P&I
- —
- Monthly cashflow
- —
- DSCR
- —
- Eligible?
- —
Short-term bridge; refi at stabilization.
Rent comps 22 comps
| Address | Beds | Baths | Sqft | Rent | $/sqft | DOM | Units | Dist |
|---|---|---|---|---|---|---|---|---|
| 150 Tonkawa Trl Unit 150 Lockhart, TX | 3.0 | 2.0 | 1216 | $1,499 | $1.23 | 43d | 1 | 0.31mi |
| 329 Flores St Lockhart, TX | 2.0 | 1.0 | 1116 | $1,500 | $1.34 | 43d | 1 | 0.52mi |
| 139 Elm St Lockhart, TX | 1.0 | 1.0 | 738 | $750 | $1.02 | 43d | 2 | 0.60mi |
| 139 Elm St Unit 203 Lockhart, TX | 1.0 | 1.0 | 934 | $700 | $0.75 | 24d | 1 | 0.60mi |
| 1100 Monte Vista Dr Lockhart, TX | 3.0 | 2.0 | 1154 | $1,850 | $1.60 | 17d | 1 | 0.60mi |
| 728 W San Antonio St Lockhart, TX | 2.0 | 1.0 | 944 | $1,125 | $1.19 | 4d | 1 | 0.74mi |
| 728 W San Antonio St Unit 730 A Lockhart, TX | 2.0 | 1.0 | 944 | $1,000 | $1.06 | 4d | 1 | 0.74mi |
| 1015 Fir Ln Lockhart, TX | 2.0 | 1.0 | 900 | $1,100 | $1.22 | 4d | 1 | 0.76mi |
| 1015 Fir Ln Lockhart, TX | 2.0 | 1.0 | 900 | $1,100 | $1.22 | 11d | 1 | 0.76mi |
| 1309 Monte Vista Dr Lockhart, TX | 3.0 | 2.0 | 1349 | $1,550 | $1.15 | 43d | 1 | 0.78mi |
| 115 S Frio St Unit H Lockhart, TX | 2.0 | 1.5 | 959 | $1,125 | $1.17 | 43d | 1 | 0.78mi |
| 115 S Frio St Unit A Lockhart, TX | 2.0 | 1.5 | 959 | $1,125 | $1.17 | 4d | 1 | 0.78mi |
| 100 N Brazos St Lockhart, TX | 3.0 | 1.0 | 1299 | $1,600 | $1.23 | 24d | 1 | 0.88mi |
| 417 S Commerce St Unit B Lockhart, TX | 2.0 | 1.5 | 1789 | $1,000 | $0.56 | 4d | 1 | 1.02mi |
| 903 E Live Oak St Unit B Lockhart, TX | 3.0 | 1.0 | 1200 | $1,450 | $1.21 | 43d | 1 | 1.18mi |
| 117 Quail Cv Unit A Lockhart, TX | 3.0 | 2.0 | 1250 | $1,575 | $1.26 | 17d | 1 | 1.24mi |
| 750 S Main St Lockhart, TX | 3.0 | 2.0 | 1377 | $1,850 | $1.34 | 43d | 1 | 1.34mi |
| 413 Abbey Ln Lockhart, TX | 3.0 | 2.0 | 1297 | $1,750 | $1.35 | 24d | 1 | 1.36mi |
| 1702 Miller Ter Lockhart, TX | 3.0 | 2.0 | 1253 | $1,895 | $1.51 | 43d | 1 | 1.40mi |
| 331 N Richland Dr Lockhart, TX | 3.0 | 2.0 | 1281 | $1,800 | $1.41 | 43d | 1 | 1.41mi |
| 609 Cottonwood St Unit A Lockhart, TX | 2.0 | 1.0 | 1084 | $1,295 | $1.19 | 43d | 1 | 1.43mi |
| 908 S Guadalupe St Lockhart, TX | 2.0 | 2.0 | 1107 | $1,300 | $1.17 | 43d | 1 | 1.43mi |
Listing history 16 events
-
2026-06-18days on market $140,000 Active 117 DOM
-
2026-06-17days on market $140,000 Active 116 DOM
-
2026-06-16days on market $140,000 Active 115 DOM
-
2026-06-15days on market $140,000 Active 114 DOM
-
2026-06-13days on market $140,000 Active 112 DOM
-
2026-06-09days on market $140,000 Active 108 DOM
-
2026-06-08days on market $140,000 Active 107 DOM
-
2026-06-07days on market $140,000 Active 106 DOM
-
2026-06-04days on market $140,000 Active 103 DOM
-
2026-06-03days on market $140,000 Active 102 DOM
-
2026-06-02days on market $140,000 Active 101 DOM
-
2026-06-01days on market $140,000 Active 100 DOM
-
2026-05-31days on market $140,000 Active 99 DOM
-
2026-04-25price $140,000 949-char remark
Show marketing remark (949 chars)
Opportunity awaits with this 3-bedroom, 1-bath home nestled just minutes from the vibrant downtown square of Lockhart. Rich with character and historic charm, this property features original siding and unique architectural details that make it the perfect canvas for restoration. Situated on a spacious lot, the home is shaded by a stunning mature tree that adds timeless beauty and curb appeal. The backyard offers ample space for expansion, outdoor living, or future improvements. This property is ideal for investors, flippers, or buyers with a vision to restore a historic home to its former glory. Whether you’re looking for your next renovation project or considering a tear-down to build new, the possibilities here are abundant. Conveniently located with quick access to HWY 183 and just minutes from downtown Lockhart’s dining, shopping, and entertainment. Bring your vision and creativity — this one is full of potential!
-
2026-02-21$150,000 Active 949-char remark
Show marketing remark (949 chars)
Opportunity awaits with this 3-bedroom, 1-bath home nestled just minutes from the vibrant downtown square of Lockhart. Rich with character and historic charm, this property features original siding and unique architectural details that make it the perfect canvas for restoration. Situated on a spacious lot, the home is shaded by a stunning mature tree that adds timeless beauty and curb appeal. The backyard offers ample space for expansion, outdoor living, or future improvements. This property is ideal for investors, flippers, or buyers with a vision to restore a historic home to its former glory. Whether you’re looking for your next renovation project or considering a tear-down to build new, the possibilities here are abundant. Conveniently located with quick access to HWY 183 and just minutes from downtown Lockhart’s dining, shopping, and entertainment. Bring your vision and creativity — this one is full of potential!
-
1990-10-10soldstatus
ⓘ Source: listings_history table (triggers on properties + properties_extension) + one-shot
backfill from property_details.listing_events for pre-trigger history.
Tax reassessment forecast TX · Resets to sale price
- Current annual tax
- $3,641 · $303/mo
- Projected year-2 tax
- $3,641 · $303/mo
- Expected delta
- $0/yr ($0/mo · 0.0%)
ⓘ Screening estimate from a state-policy table — verify with the county assessor before closing.
Climate risk First Street
- Flood 1/10 Low FEMA zone X (unshaded) · 0% chance over 30 yrs
- Wildfire 5/10 Major
- Heat 8/10 Severe 7 d/yr ≥108°F today · 20 d/yr by 30 yrs out
- Wind 8/10 Severe 80% chance of damaging wind over 30 yrs
- Air quality 1/10 Low 0 unhealthy d/yr today · 0 by 30 yrs out
Nearby sold comps map
Loading sold comps map…
Walkable amenities ~0.75 mi
Loading nearby amenities…
Taxation est. · year 1
- Rental income
- $17,428
- − Mortgage interest
- −$7,842
- − Property taxes
- −$3,641
- − Insurance
- −$700
- − Repairs & maintenance
- −$1,394
- − Management
- −$1,394
- − Depreciation
- −$4,073
- Taxable loss
- −$1,616
- Est. tax savings @ 24.0%
- +$388
- After-tax cash flow
- $1,005/yr
For passive investors: Depreciation is non-cash, so a rental often shows a tax loss while cash-flowing — sheltering income. Rental losses are passive: they offset passive income freely, and up to $25,000/yr can offset ordinary (W-2) income if you actively participate and your MAGI is under $100k (phasing out to $0 by $150k); unused losses carry forward. On sale, claimed depreciation is recaptured at up to 25%, and gains may owe capital-gains tax (a 1031 exchange can defer both). Figures are a year-1 estimate at your 24.0% rate — not tax advice; consult a CPA.
Schools (NCES district)
- District
- Lockhart ISD
- NCES district ID
- 4827870
- Math proficiency
- 27% ▼ -12.00%
- Reading proficiency
- 29% ▼ -2.00%
- Median HH income
- $48,868
- Composite
- 24.44/100
- National rank
- #7674
- State rank
- #657 of 826 in TX
Livability — Lockhart
- Score
- 67/100
- State rank
- #535
- US rank
- #10453
Category grades
Schools grade is shown separately in the Schools card above.
Census & demographics
- Census place
- Lockhart, TX
- County
- Caldwell County · 25,195 people
- City population
- 22,348
- Metro
- Austin-Round Rock-Georgetown, TX
- Population (ZIP)
- 22,348
- Household income
- $74,709
- Rent vs Own
- Severe rent burden
- 324.0
Population outlook (Caldwell County) Hauer SSP2
- Today (2025)
- 46,557 people
- By 2030
- 49,673 · +6.7%
- By 2040
- 55,827 · +19.9%
- By 2050
- 61,832 · +32.8%
- By 2075
- 77,212 · +65.8%
- By 2100
- 89,225 · +91.6%
Race, ethnicity, and origin ACS 2023
- Neighborhood character
- Diverse neighborhood (Simpson 0.57)
- Race & ethnicity
- Hispanic / Latino 52% White 39% Two or more races 23% Black 4% Asian 1%
- Hispanic origin (detail)
- Mexican 45% Puerto Rican 2%
- Common ancestry
- Italian 1% Lithuanian 1% Serbian 1%
- Foreign-born
- 9% · Canada
- Languages at home
- 67% English-only · Spanish 32%
Political lean MEDSL · Caldwell
- 2024 margin
- R (+14.4) · D 42.2% · R 56.6% · Other 1.2%
- 2008→2024 swing
- -8.4pp toward R · 2008: -6.0pp · 2024: -14.4pp
- All cycles
- 2024: R+14.4 2020: R+9.1 2016: R+15.8 2012: R+11.1 2008: R+6.0
Not yet ingested
- Civics
- —
Market trends
- HPI YoY
- ▼ -99.62%
- Current HPI
- 239.7906
- Rent YoY
- —
- Metro
- Austin-Round Rock-Georgetown, TX
- State GDP YoY
- ▲ 3.95%
- F500 in state
- 110
Industry mix (Fortune 500 HQ in TX)
| Industry | F500 HQs | Revenue |
|---|---|---|
| Energy | 16 | $1,198B |
|
||
| Technology | 5 | $198B |
|
||
| Engineering / Construction | 4 | $72B |
|
||
| Energy Services | 3 | $60B |
|
||
| Utilities | 3 | $41B |
|
||
| Healthcare | 2 | $330B |
|
||
Price history
-6.7% since first listed3 events — show timeline
- 2026-04-25 Price Changed $140,000 Unlock MLS
- 2026-02-21 Listed $150,000 Unlock MLS
- 1990-10-10 Sold (Public Records) — Public Records
Property tax history
+5.7%/yrLatest (2025): $3,641 · +8.9% YoY. Source: county tax records.
Cash-flow waterfall
monthlySold comps — $/sqft
last 12 mo · ≤1 miLoading sold comps…