 Multi-family
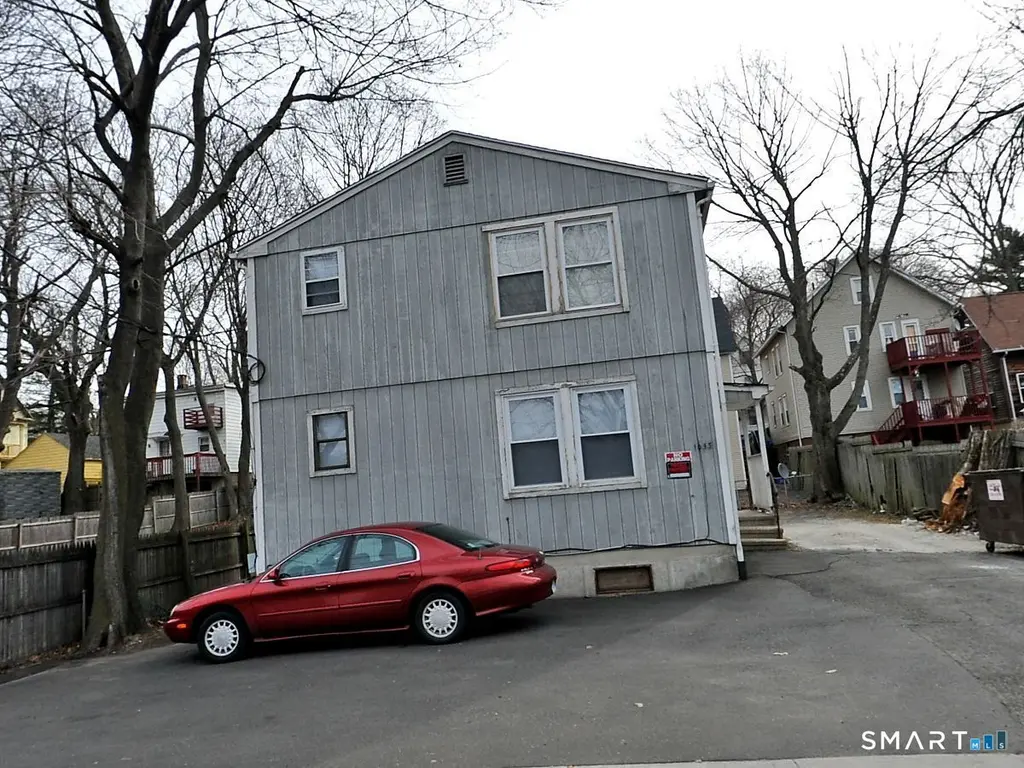
1053 Ella T Grasso Blvd · New Haven, CT
Flood risk 5/10 · Moderate
- FEMA flood zone
- X (unshaded)
- Chance of flooding over 30 yrs
- 0.24%
- Est. flood insurance / yr
- $473 – $860
Fire risk 1/10 · Minimal
- Est. fire insurance / yr
- $829 – $1,539
Heat risk 7/10 · Major
- Hot days now (above 99°F)
- 7 days/yr
- Hot days in 30 yrs
- 17 days/yr
Wind risk 6/10 · Moderate
- Chance of severe wind over 30 yrs
- 56.0%
Air-quality risk 5/10 · Moderate
- Unhealthy air days now
- 5 days/yr
- Unhealthy air days in 30 yrs
- 8 days/yr
Risk factors via First Street. Map © Google.
Why this score? — see what drove the C+ grade
The composite is a weighted blend of 9 inputs, each scored 0–100. Each bar is that input's sub-score; the figure is the points it added to the 100-point composite (weight × sub-score).
- Cash flow +30.0/30.0
- 1% rule +10.0/10.0
- DSCR +10.0/10.0
- Livability +4.0/5.0
- Rent growth +3.2/5.0
- Condition / age +2.5/5.0
- Schools +1.5/10.0
- ARV discount +0.0/15.0
- Appreciation +0.0/10.0
$399,000
🖨 Deal sheet (PDF) 📄 Offer letter ✓ Due diligence
Multi-family units
County records classify this as Multi-Family (5+ Unit). Listing-text estimate: 1 unit. estimate disagrees with records
5+ unit building — per-unit beds/baths from public records are typically unavailable; the breakdown below (if shown) is an estimate from the listing text.
Listing remarks MLS
Newer 4 unit property. Great investment!!!
Key facts
- 2,613 sq ft lot
- 4 parking spots
- Built 1982
Property features AI
Exterior
- Parking: Parking lot; 4 parking spaces
- Utilities: Public water connected; Public sewer connected; Gas available in street
- Home design: Multi-family property (4-family)
- Construction: Wood siding; Shingle roof; Concrete foundation; Gray exterior
- Exterior features: Level lot; Near medical facilities, park, and public transportation
Interior
- Bedrooms: 4 bedrooms
- Bathrooms: 4 full bathrooms
- Heating & cooling: Baseboard heating; 80-gallon hot water tank; Storm windows
- Interior features: 8 total rooms; Full basement
Neighborhood map
What this means for you Summary
Snapshot
- This is a 4-bed/4.0-bath multifamily listed at $399k.
Deal economics
- At list price, monthly cash flow is $4k ($50k/yr) — positive.
- The deal already cash-flows at list — no discount required.
- Meets the 1% rule at list price ($9k rent vs $399k).
- Cap rate 18.9% vs local median 4.8% in New Haven — top-decile yield for the area; either an underpriced asset or a hidden risk that comps aren't pricing in. Stress-test before assuming the spread holds.
Location & tenants
- Location reads 79/100 on livability (#31 in CT, #2,190 nationally) — a middle-class / working-renter tenant base. Strengths: amenities A+, commute A+, health & safety A+; Watch: employment D, crime F.
- New Haven School District (urban): math 12% / reading 25% proficiency, ranked #147 of 153 in CT (top 96%) — low school quality limits family demand, transient renter base, plan for 1-2y turnover; 66% free/reduced lunch — lower-income household profile, screen leases tightly.
- Zoned schools: Barnard Environmental Magnet School (math 6% / reading 22%, grade F, #481 of 553 statewide, top 87%, 467 students, 78% FRL); Hill Regional Career High School (math 8% / reading 27%, grade F, #173 of 194 statewide, top 90%, 651 students, 78% FRL).
- Market conditions: Rents rising (+2.6%/yr); 137 active listings in the ZIP; 40 comparable units currently listed for rent nearby; rentals at typical pace (median 24d on market — plan ~3-4 weeks tenant-placement turnaround); 40% of comp listings sitting > 30 days — soft ceiling on asking rent; 1,059 units permitted in South Central Connecticut Planning Region in 2024 (779 in 5+ unit buildings).
- At $8,830/mo this rent would consume 177% of the median local household income ($60k/yr) (locally 4999% of renters already pay >50% of income on rent) — very limited rent-growth headroom before tenants either downsize or default.
Forward outlook
- Local home prices are declining (-3.0%/yr); year-one equity from $3k of loan paydown is wiped out by about $12k of value loss. Plan a longer hold.
- At projected returns (-3.0% appreciation + 2.6% rent growth), your $112k cash investment doubles in ~3 years — after that, you're playing with house money.
Negotiation context
- Only 6 days on market — expect competitive offers; lowballing is unlikely to land.
- 2 sale attempts since 22y ago with the ask held roughly flat each time — persistent listings suggest the price (not the market) is what's stuck; bring a comps-based counter.
- Current owner paid $171k; list at $399k implies a 133% gain — meaningful room to come down on a strong offer.
Risks & watch-outs
- Climate carrying-cost: moderate flood risk; major wind risk, 56% chance of damaging wind over 30y; extreme-heat days projected 7→17/yr by 2055 (HVAC capex compounding) — expect insurance premiums to compound above CPI over the hold.
Questions for the listing agent
- Is there a deadline driving the sale (1031 exchange, divorce, estate, relocation)? That informs how much negotiation room exists.
- Schools are D-rated, which usually means shorter tenancies and higher turnover. Who's the typical renter profile here, and what's been the actual vacancy rate?
- Crime grade is F in this area — have there been break-ins, vandalism, or insurance claims at this property in the last 3 years? What carrier currently insures it and at what premium?
- What's the average days-on-market for RENTAL listings here right now (not sales)? A rising rental-DOM trend means longer vacancies and softer asking-rent achievability than the comps imply.
- What's the recent tenant-quality profile in this submarket — average credit score on applications, eviction rate, late-payment / NSF rate, and stable-employment percentage? A property-management company in the area should have these aggregated.
- How much new apartment / multifamily construction is in the pipeline within 1–3 miles? Heavy new supply (>2% of stock underway) typically softens rents 12–24 months out; light construction supports rent growth.
Investment metrics
- 1% rule
- 2.21% ✓
- Cap rate
- 18.93%
- Cash-on-cash
- 45.12%
- DSCR
- 3.01
- GRM
- 3.8
CMA / ARV
- ARV (on-the-fly)
- $311,712
- Comps found
- 9
Show comp detail 9 sales within ~0.75 mi
| Address | Dist | Beds/Ba | Sqft | Sold | Price | $/sf | Match |
|---|---|---|---|---|---|---|---|
| 55 Miller St | 0.04mi | 4/2.0 | 1,757 (+8%) | 19mo | $325,000 | $185 | 62 |
| 24 Batter Ter | 0.40mi | 3/2.5 (-1) | 1,618 (-1%) | 13mo | $320,000 | $198 | 58 |
| 945 Ella T Grasso Blvd | 0.25mi | 4/2.0 | 1,484 (-9%) | 12mo | $170,000 | $115 | 55 |
| 14 Westfield St | 0.52mi | 4/2.0 | 1,610 (-1%) | 18mo | $330,000 | $205 | 51 |
| 15 Maple St | 0.67mi | 3/3.0 (-1) | 1,728 (+6%) | 2mo | $372,500 | $216 | 48 |
| 20 Waverly St | 0.58mi | 4/2.0 | 1,626 (-0%) | 22mo | $361,000 | $222 | 46 |
| 43 Elliott St | 0.67mi | 5/2.0 (+1) | 1,536 (-6%) | 7mo | $265,000 | $173 | 40 |
| 262 Davenport Ave | 0.71mi | 4/2.0 | 1,440 (-12%) | 4mo | $275,000 | $191 | 36 |
| 393 Orchard St | 0.70mi | 5/2.0 (+1) | 1,776 (+9%) | 20mo | $273,000 | $154 | 22 |
Match score weights: distance 35% · size 25% · config 20% · recency 20%. Top-matched comps best support the ARV.
Projected returns pro-forma
-3.0% appreciation · 2.6% rent growth · sell at horizon
- IRR
- 41.8%
- Equity multiple
- 2.79×
- Total profit
- $199,516
- Equity at exit
- $59,492
- IRR
- 47.8%
- Equity multiple
- 5.52×
- Total profit
- $504,446
- Equity at exit
- $34,498
Cash invested: $111,720 (down + closing). Projections, not guarantees.
Landlord ↔ Tenant lean methodology
- Overall (STATE)
- 27 Tenant-Leaning
- State Connecticut
- 27 Tenant-Leaning · D+7
- County
- — inherits STATE
- City
- — inherits STATE
ZIP-level market 06511
- Home prices YoY
- -20.8%
- Rents YoY
- 2.6%
- Active inventory
- 137
- Price-to-rent
- 15.1×
Monthly cashflow live
- Estimated rent
- $8,830 medium interval (Pro) →
- Mortgage (P&I)
- −$2,092
- Tax from tax record
- −$516 /mo · $6,192/yr
- Insurance
- −$166
- HOA
- −$0
- Vacancy / Maint / Mgmt
- −$1,854
- Net cashflow
- $4,201
Break-even live
Sensitivity live
| Price | -10% $4,427 | -5% $4,314 | +0% $4,201 | +5% $4,088 | +10% $3,975 |
|---|---|---|---|---|---|
| Rent | -10% $3,503 | -5% $3,852 | +0% $4,201 | +5% $4,550 | +10% $4,899 |
| Rate | -1.0pp $4,402 | -0.5pp $4,303 | base $4,201 | +0.5pp $4,098 | +1.0pp $3,992 |
4-unit breakdown (identical units grouped — click to expand)
| Units | Beds | Baths | Est. rent |
|---|---|---|---|
| 4× units | 4 | 4 | $8,832 |
| #1 | 4 | 4 | $2,208 |
| #2 | 4 | 4 | $2,208 |
| #3 | 4 | 4 | $2,208 |
| #4 | 4 | 4 | $2,208 |
| Total (4 units) | $8,830 | ||
UW: 25.0% down · 7.5% · 30yr · 1.5% tax · 5.0% vac · 8.0% maint · 8.0% mgmt
Financing live
Cash to close
- Down payment
- $99,750
- Closing costs
- $11,970
- Reserves months
- —
- Total cash needed
- —
Loan-product check · same deal, 3 products live
Conventional
25% down · 7.5% · 30yr
- Down + closing
- —
- Monthly P&I
- —
- Monthly cashflow
- —
- DSCR
- —
- Eligible?
- —
Personal DTI + credit; lowest rate.
DSCR
20% down · 8.5% · 30yr
- Down + closing
- —
- Monthly P&I
- —
- Monthly cashflow
- —
- DSCR
- —
- Eligible?
- —
No personal income docs; deal must DSCR.
Hard money
10% down · 12.0% · 12mo
- Down + closing
- —
- Monthly P&I
- —
- Monthly cashflow
- —
- DSCR
- —
- Eligible?
- —
Short-term bridge; refi at stabilization.
Rent comps 40 comps
| Address | Beds | Baths | Sqft | Rent | $/sqft | DOM | Units | Dist |
|---|---|---|---|---|---|---|---|---|
| 48 Miller St Unit 1 New Haven, CT | 3.0 | 2.0 | 1500 | $2,000 | $1.33 | 44d | 1 | 0.03mi |
| 185 Winthrop Ave Unit 1 New Haven, CT | 3.0 | 1.0 | 1357 | $2,100 | $1.55 | 3d | 1 | 0.28mi |
| 1616 Chapel St New Haven, CT | 4.0 | 1.5 | 1443 | $2,550 | $1.77 | 44d | 1 | 0.40mi |
| 32 Auburn St Unit 2 New Haven, CT | 4.0 | 1.0 | 1350 | $2,200 | $1.63 | 44d | 1 | 0.40mi |
| 32 Auburn St Unit 2 New Haven, CT | 3.0 | 1.0 | 1300 | $2,300 | $1.77 | 24d | 1 | 0.40mi |
| 408 Legion Ave Unit 2 New Haven, CT | 3.0 | 1.0 | 1610 | $2,000 | $1.24 | 44d | 1 | 0.41mi |
| 1561 Chapel St New Haven, CT | 3.0 | 1.0 | 1100 | $1,950 | $1.77 | 3d | 1 | 0.45mi |
| 1561 Chapel St New Haven, CT | 4.0 | 1.0 | 1200 | $2,150 | $1.79 | 14d | 1 | 0.45mi |
| 1494 Chapel St Unit 1R New Haven, CT | 3.0 | 1.0 | 1800 | $2,000 | $1.11 | 3d | 1 | 0.49mi |
| 1476 Chapel St Unit 301 New Haven, CT | 4.0 | 1.5 | 1200 | $1,800 | $1.50 | 14d | 1 | 0.50mi |
| 5 Gilbert Ave Unit 3 New Haven, CT | 5.0 | 2.0 | 1240 | $1,700 | $1.37 | 24d | 1 | 0.60mi |
| 5 Gilbert Ave Unit 1 New Haven, CT | 3.0 | 1.0 | 1254 | $2,000 | $1.59 | 24d | 1 | 0.60mi |
| 5 Gilbert Ave Unit 1 New Haven, CT | 3.0 | 1.0 | 1254 | $2,000 | $1.59 | 19d | 1 | 0.60mi |
| 54 Orchard St Unit 52B New Haven, CT | 3.0 | 2.0 | 1200 | $2,600 | $2.17 | 44d | 1 | 0.63mi |
| 46 Orchard St Unit 46B New Haven, CT | 3.0 | 2.0 | 1200 | $2,600 | $2.17 | 24d | 1 | 0.63mi |
| 46 Orchard St Unit 46A New Haven, CT | 3.0 | 2.0 | 1200 | $2,600 | $2.17 | 44d | 1 | 0.63mi |
| 154 Norton St Unit 1 New Haven, CT | 4.0 | 1.0 | 1306 | $1,900 | $1.45 | 3d | 1 | 0.64mi |
| 365 Winthrop Ave Unit 1 New Haven, CT | 3.0 | 1.0 | 1600 | $2,295 | $1.43 | 3d | 1 | 0.66mi |
| 34 Bristol St Unit 3 West Haven, CT | 3.0 | 1.0 | 1370 | $2,400 | $1.75 | 44d | 1 | 0.66mi |
| 212 Maple St Unit 1st Floor New Haven, CT | 3.0 | 1.0 | 1150 | $2,800 | $2.43 | 44d | 1 | 0.66mi |
| 212 Maple St New Haven, CT | 3.0 | 1.0 | 1100 | $2,500 | $2.27 | 21d | 1 | 0.66mi |
| 38 Bristol St Unit 3 West Haven, CT | 3.0 | 1.0 | 1200 | $2,400 | $2.00 | 44d | 1 | 0.67mi |
| 365 Orchard St New Haven, CT | 2.0–4.0 | 1.0 | 1175 | $2,395 | $2.04 | 14d | 4 | 0.70mi |
| 10 Kensington St New Haven, CT | 3.0 | 2.0 | 1150 | $2,195 | $1.91 | 44d | 1 | 0.71mi |
| 66 Kensington St Unit 2 New Haven, CT | 3.0 | 2.0 | 1800 | $2,100 | $1.17 | 24d | 1 | 0.78mi |
| 1946 Chapel St Unit 2nd Floor New Haven, CT | 3.0 | 1.0 | 1115 | $3,000 | $2.69 | 11d | 1 | 0.79mi |
| 891 Elm St Unit 2 New Haven, CT | 3.0 | 1.0 | 1433 | $1,500 | $1.05 | 21d | 1 | 0.79mi |
| 120 Dwight St New Haven, CT | 3.0 | 2.0 | 1750 | $3,175 | $1.81 | 21d | 2 | 0.81mi |
| 396 Whalley Ave Unit 3 New Haven, CT | 4.0 | 1.0 | 1400 | $2,400 | $1.71 | 3d | 1 | 0.82mi |
| 49 Hubinger St New Haven, CT | 4.0 | 1.5 | 2000 | $2,950 | $1.48 | 3d | 1 | 0.82mi |
| 109 Hobart St Apt 1 New Haven, CT | 3.0 | 1.0 | 1220 | $2,500 | $2.05 | 44d | 1 | 0.84mi |
| 111 Hobart St Apt 2 New Haven, CT | 3.0 | 1.0 | 1220 | $2,500 | $2.05 | 44d | 1 | 0.84mi |
| 32 Cullen Ave West Haven, CT | 3.0 | 2.0 | 1080 | $3,500 | $3.24 | 3d | 1 | 0.85mi |
| 41 Howe St New Haven, CT | 4.0 | 2.0 | 1795 | $3,750 | $2.09 | 44d | 1 | 0.89mi |
| 41 Howe St Apt 2 New Haven, CT | 3.0 | 1.0 | 1795 | $3,200 | $1.78 | 44d | 1 | 0.89mi |
| 41 Howe St Apt 2 New Haven, CT | 3.0 | 1.0 | 1795 | $3,200 | $1.78 | 24d | 1 | 0.89mi |
| 43 Howe St New Haven, CT | 4.0 | 2.0 | 1995 | $4,995 | $2.50 | 14d | 1 | 0.90mi |
| 402 Crown St Unit 402-1 New Haven, CT | 4.0 | 2.0 | 1275 | $4,995 | $3.92 | 44d | 1 | 0.90mi |
| 29 White St Unit 3 New Haven, CT | 3.0 | 1.0 | 1240 | $1,750 | $1.41 | 24d | 1 | 0.92mi |
| 392 Crown St Unit 392-2 New Haven, CT | 3.0 | 1.0 | 1150 | $2,295 | $2.00 | 44d | 1 | 0.93mi |
Listing history 7 events
-
2026-06-15status $399,000 Under Contract 6 DOM
-
2026-06-09days on market $399,000 Active 6 DOM
-
2026-06-08days on market $399,000 Active 5 DOM
-
2026-06-07remarks 351-char remark
-
2026-06-07days on market $399,000 Active 4 DOM
-
2026-06-05remarks 34-char remark
-
2026-06-05$399,000 Active 1 DOM
ⓘ Source: listings_history table (triggers on properties + properties_extension) + one-shot
backfill from property_details.listing_events for pre-trigger history.
Tax reassessment forecast CT · Partial reset (capped growth)
- Current annual tax
- $6,192 · $516/mo
- Projected year-2 tax
- $7,365 · $614/mo
- Expected delta
- +$1,173/yr (+$98/mo · 18.9%)
ⓘ Screening estimate from a state-policy table — verify with the county assessor before closing.
Climate risk First Street
- Flood 5/10 Major FEMA zone X (unshaded) · 24% chance over 30 yrs
- Wildfire 1/10 Low
- Heat 7/10 Severe 7 d/yr ≥99°F today · 17 d/yr by 30 yrs out
- Wind 6/10 Major 56% chance of damaging wind over 30 yrs
- Air quality 5/10 Major 5 unhealthy d/yr today · 8 by 30 yrs out
Nearby sold comps map
Loading sold comps map…
Walkable amenities ~0.75 mi
Loading nearby amenities…
Taxation est. · year 1
- Rental income
- $105,960
- − Mortgage interest
- −$22,350
- − Property taxes
- −$6,192
- − Insurance
- −$1,995
- − Repairs & maintenance
- −$8,477
- − Management
- −$8,477
- − Depreciation
- −$11,607
- Taxable income
- $46,862
- Est. tax owed @ 24.0%
- −$11,247
- After-tax cash flow
- $39,166/yr
For passive investors: Depreciation is non-cash, so a rental often shows a tax loss while cash-flowing — sheltering income. Rental losses are passive: they offset passive income freely, and up to $25,000/yr can offset ordinary (W-2) income if you actively participate and your MAGI is under $100k (phasing out to $0 by $150k); unused losses carry forward. On sale, claimed depreciation is recaptured at up to 25%, and gains may owe capital-gains tax (a 1031 exchange can defer both). Figures are a year-1 estimate at your 24.0% rate — not tax advice; consult a CPA.
Schools (NCES district)
- District
- New Haven School District
- NCES district ID
- 0902790
- Math proficiency
- 12% ▼ -10.00%
- Reading proficiency
- 25% ▼ -10.00%
- Median HH income
- $38,058
- Composite
- 15.48/100
- National rank
- #9308
- State rank
- #147 of 153 in CT
Livability — New Haven
- Score
- 79/100
- State rank
- #31
- US rank
- #2190
Category grades
Schools grade is shown separately in the Schools card above.
Census & demographics
- Census place
- New Haven, CT
- County
- New Haven County · 688,236 people
- City population
- 132,813
- Metro
- New Haven-Milford, CT
- Population (ZIP)
- 54,730
- Household income
- $59,969
- Rent vs Own
- Severe rent burden
- 4999.0
Population outlook (South Central Connecticut County) Hauer SSP2
- By 2040
- 608,362
Race, ethnicity, and origin ACS 2023
- Neighborhood character
- Highly diverse neighborhood (Simpson 0.73)
- Race & ethnicity
- Black 34% White 32% Hispanic / Latino 21% Two or more races 8% Asian 7%
- Hispanic origin (detail)
- Mexican 4% Puerto Rican 10% Dominican 2%
- Common ancestry
- Romanian 2% Lithuanian 1% Russian 1%
- Foreign-born
- 17% · Canada, China, South Korea
- Languages at home
- 74% English-only · Spanish 15% Chinese 3% Other Indo-European 2%
Political lean MEDSL · South Central Connecticut
- 2024 margin
- Strong D (+20.1) · D 59.0% · R 38.9% · Other 2.1%
- All cycles
- 2024: D+20.1
Not yet ingested
- Civics
- —
Market trends
- HPI YoY
- ▼ -86.05%
- Current HPI
- 328.1353
- Rent YoY
- ▲ 2.60%
- Metro
- New Haven-Milford, CT
- State GDP YoY
- ▲ 1.06%
- F500 in state
- 38
Industry mix (Fortune 500 HQ in CT)
| Industry | F500 HQs | Revenue |
|---|---|---|
| Industrial Machinery | 4 | $38B |
|
||
| Insurance | 3 | $71B |
|
||
| Financial Services | 2 | $25B |
|
||
| Transportation / Logistics | 2 | $18B |
|
||
| Healthcare | 1 | $247B |
|
||
| Telecommunications | 1 | $55B |
|
||
Price history
+138.9% since first listed4 events — show timeline
- 2026-06-03 Listed $399,000 Smart MLS
- 2005-02-23 Sold (Public Records) $171,000 Public Records
- 2005-02-22 Sold (MLS) $171,000 Smart MLS
- 2004-07-24 Listed $167,000 Smart MLS
Property tax history
+5.4%/yrLatest (2023): $6,192 · -6.4% YoY. Source: county tax records.
Cash-flow waterfall
monthlySold comps — $/sqft
last 12 mo · ≤1 miLoading sold comps…