 🏷️ Likely Rental
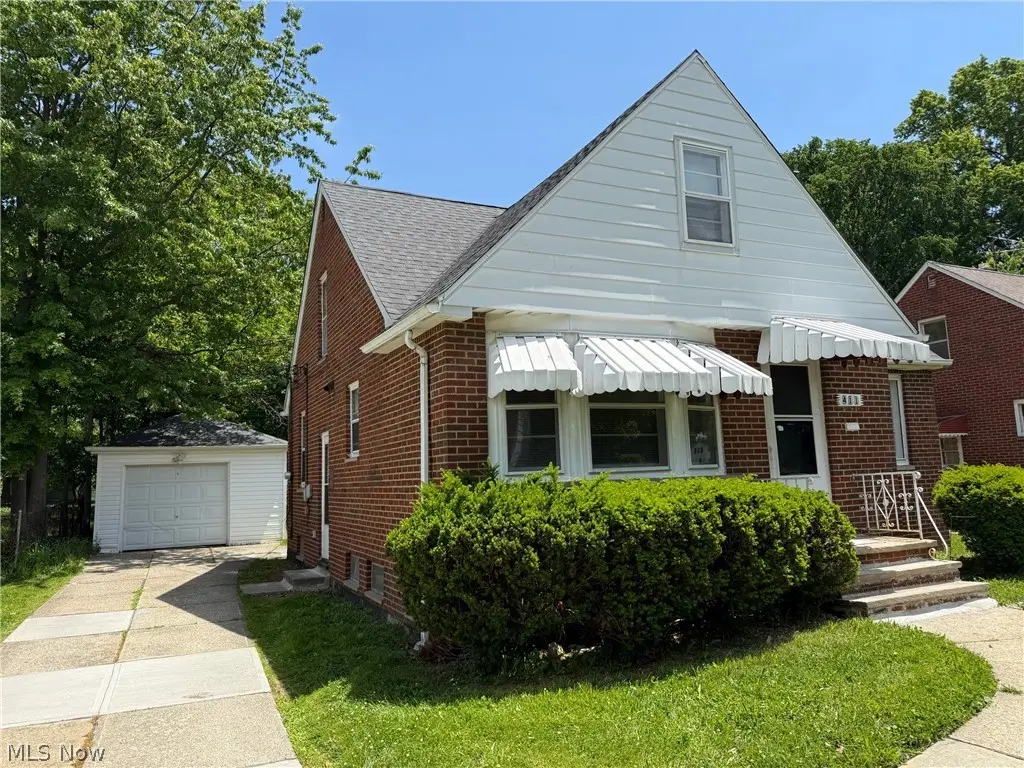
411 E 264th St · Euclid, OH
Flood risk 1/10 · Minimal
- FEMA flood zone
- X (unshaded)
- Chance of flooding over 30 yrs
- 0.0%
- Est. flood insurance / yr
- $473 – $860
Fire risk 1/10 · Minimal
- Est. fire insurance / yr
- $713 – $1,323
Heat risk 3/10 · Minor
- Hot days now (above 94°F)
- 7 days/yr
- Hot days in 30 yrs
- 17 days/yr
Wind risk 1/10 · Minimal
- Chance of severe wind over 30 yrs
- —
Air-quality risk 3/10 · Minor
- Unhealthy air days now
- 3 days/yr
- Unhealthy air days in 30 yrs
- 4 days/yr
Risk factors via First Street. Map © Google.
Why this score? — see what drove the C grade
The composite is a weighted blend of 9 inputs, each scored 0–100. Each bar is that input's sub-score; the figure is the points it added to the 100-point composite (weight × sub-score).
- Cash flow +18.0/30.0
- ARV discount +15.0/15.0
- 1% rule +5.7/10.0
- DSCR +5.6/10.0
- Rent growth +5.0/5.0
- Livability +3.9/5.0
- Condition / age +2.5/5.0
- Schools +1.7/10.0
- Appreciation +0.0/10.0
$139,000
🖨 Deal sheet 📄 Offer letter ✓ Due diligence
Listing remarks MLS
Brick master bungalow w/ 4 bedrooms and 1.5 baths! Formal dining room! Full basement! Newer roof. CA. Tenant occupied with one year lease. Rent is 1200/month! Income producing property! Call lister for details!
Key facts
- Manageable yard
- Second fireplace
- Brick cape cod
Tags
Property features AI
Finance
- HOA & community: Community amenities nearby: laundry facilities, medical services, playground, park, restaurants, shopping, public transportation
Exterior
- Parking: Detached garage; Driveway (paved)
- Utilities: Public water; Public sewer
- Home design: 2-story home; Block foundation
- Construction: Brick construction; Asphalt/fiberglass roof; Built (year source: public records)
- Exterior features: Enclosed porch; Patio; Porch; Lot approximately 50 x 100
Interior
- Kitchen: Range; Refrigerator
- Bedrooms: 2 main-level bedrooms
- Bathrooms: 1 full bathroom; 1 half bathroom; 1 main-level bathroom
- Heating & cooling: Forced air heating (gas); Central air conditioning
- Interior features: Full finished basement; 2 fireplaces (living room and basement); 6 total rooms
- Laundry & utility: Laundry in basement
Neighborhood map
What this means for you Summary
Snapshot
- This is a 2-bed/1.0-bath single-family listed at $139k.
Deal economics
- At list price, monthly cash flow is $119 ($1k/yr) — positive.
- The deal already cash-flows at list — no discount required.
- Meets the 1% rule at list price ($1k rent vs $139k).
Location & tenants
- Location reads 77/100 on livability (#204 in OH, #3,149 nationally) — a middle-class / working-renter tenant base. Strengths: cost of living A+, housing A+, crime B+; Watch: schools C-, commute F, employment D-.
- Euclid City (suburban): math 14% / reading 28% proficiency, ranked #625 of 656 in OH (top 95%) — low school quality limits family demand, transient renter base, plan for 1-2y turnover; 70% free/reduced lunch — lower-income household profile, screen leases tightly.
- Market conditions: Rents rising fast (+15.5%/yr); 39 active listings in the ZIP; 27 comparable units currently listed for rent nearby; rentals at typical pace (median 15d on market — plan ~3-4 weeks tenant-placement turnaround); 1,441 units permitted in Cuyahoga County in 2024 (700 in 5+ unit buildings).
- This rent runs 37% of the median local income ($48k/yr) — at the standard rent-burdened threshold; future hikes will face affordability resistance.
Forward outlook
- Local home prices are declining (-3.0%/yr); year-one equity from $961 of loan paydown is wiped out by about $4k of value loss. Plan a longer hold.
- Cuyahoga County population projected to shrink 8% by 2050 — rents likely to lag national; underwrite the cash flow, not the appreciation.
- At projected returns (-3.0% appreciation + 8.0% rent growth), your $39k cash investment doubles in ~10 years — after that, you're playing with house money.
Negotiation context
- Only 10 days on market — expect competitive offers; lowballing is unlikely to land.
- 6 sale attempts since 30y ago with the ask held roughly flat each time — persistent listings suggest the price (not the market) is what's stuck; bring a comps-based counter.
- Current owner paid $88k; list at $139k implies a 58% gain — meaningful room to come down on a strong offer.
Risks & watch-outs
- Watch-outs: built in 1952 — expect roof / HVAC / electrical / plumbing capex.
Questions for the listing agent
- Built in 1952 — when were the roof, HVAC, electrical panel, plumbing, and water heater last replaced?
- Is there a deadline driving the sale (1031 exchange, divorce, estate, relocation)? That informs how much negotiation room exists.
- What's the average days-on-market for RENTAL listings here right now (not sales)? A rising rental-DOM trend means longer vacancies and softer asking-rent achievability than the comps imply.
- What's the recent tenant-quality profile in this submarket — average credit score on applications, eviction rate, late-payment / NSF rate, and stable-employment percentage? A property-management company in the area should have these aggregated.
- How much new for-sale + rental construction is in the pipeline within 1–3 miles? Heavy new supply typically softens prices + rents 12–24 months out; constrained supply supports both.
Investment metrics
- 1% rule
- 1.07% ✓
- Cap rate
- 7.32%
- Cash-on-cash
- 3.66%
- DSCR
- 1.16
- GRM
- 7.8
CMA / ARV
- ARV (on-the-fly)
- $197,102
- Comps found
- 12
Show comp detail 12 sales within ~0.75 mi
| Address | Dist | Beds/Ba | Sqft | Sold | Price | $/sf | Match |
|---|---|---|---|---|---|---|---|
| 406 E 274th St | 0.42mi | 3/1.0 (+1) | 1,366 (-4%) | 1mo | $115,000 | $84 | 68 |
| 27190 Zeman Ave | 0.43mi | 3/1.0 (+1) | 1,465 (+3%) | 2mo | $127,000 | $87 | 67 |
| 568 Sycamore Dr | 0.46mi | 3/2.0 (+1) | 1,401 (-1%) | 2mo | $176,400 | $126 | 66 |
| 411 E 270th St | 0.21mi | 3/1.0 (+1) | 1,245 (-12%) | 2mo | $207,500 | $167 | 63 |
| 298 E 270 St | 0.32mi | 3/1.5 (+1) | 1,274 (-10%) | 2mo | $160,000 | $126 | 60 |
| 295 E 276th St | 0.69mi | 3/1.5 (+1) | 1,428 (+1%) | 1mo | $245,000 | $172 | 59 |
| 730 Hemlock Dr | 0.62mi | 3/2.0 (+1) | 1,401 (-1%) | 2mo | $195,000 | $139 | 59 |
| 571 E 260th St | 0.39mi | 3/1.5 (+1) | 1,283 (-10%) | 1mo | $155,000 | $121 | 58 |
| 427 E 275 St | 0.48mi | 3/2.0 (+1) | 1,576 (+11%) | 3mo | $230,000 | $146 | 48 |
| 24891 Zeman Ave | 0.60mi | 3/1.0 (+1) | 1,246 (-12%) | 2mo | $155,000 | $124 | 45 |
| 29234 Grand Blvd | 0.68mi | 3/2.0 (+1) | 1,260 (-11%) | 0mo | $255,000 | $202 | 40 |
| 24791 Drakefield Ave | 0.70mi | 3/2.0 (+1) | 1,218 (-14%) | 2mo | $202,500 | $166 | 33 |
Match score weights: distance 35% · size 25% · config 20% · recency 20%. Top-matched comps best support the ARV.
Projected returns pro-forma
-3.0% appreciation · 8.0% rent growth · sell at horizon
- IRR
- -4.6%
- Equity multiple
- 0.82×
- Total profit
- $-7,042
- Equity at exit
- $20,725
- IRR
- 10.5%
- Equity multiple
- 2.02×
- Total profit
- $39,603
- Equity at exit
- $12,018
Cash invested: $38,920 (down + closing). Projections, not guarantees.
Landlord ↔ Tenant lean methodology
- Overall (STATE)
- 73 Landlord-Friendly
- State Ohio
- 73 Landlord-Friendly · R+6
- County
- — inherits STATE
- City
- — inherits STATE
ZIP-level market 44132
- Home prices YoY
- -16.9%
- Rents YoY
- 15.5%
- Active inventory
- 39
- Price-to-rent
- 7.8×
Monthly cashflow live
- Estimated rent
- $1,483 high interval (Pro) →
- Mortgage (P&I)
- −$729
- Tax from tax record
- −$266 /mo · $3,192/yr
- Insurance
- −$58
- HOA
- −$0
- Vacancy / Maint / Mgmt
- −$311
- Net cashflow
- $119
Break-even live
UW: 25.0% down · 7.5% · 30yr · 1.5% tax · 5.0% vac · 8.0% maint · 8.0% mgmt
Financing live
Cash to close
- Down payment
- $34,750
- Closing costs
- $4,170
- Reserves months
- —
- Total cash needed
- —
Loan-product check · same deal, 3 products live
Conventional
25% down · 7.5% · 30yr
- Down + closing
- —
- Monthly P&I
- —
- Monthly cashflow
- —
- DSCR
- —
- Eligible?
- —
Personal DTI + credit; lowest rate.
DSCR
20% down · 8.5% · 30yr
- Down + closing
- —
- Monthly P&I
- —
- Monthly cashflow
- —
- DSCR
- —
- Eligible?
- —
No personal income docs; deal must DSCR.
Hard money
10% down · 12.0% · 12mo
- Down + closing
- —
- Monthly P&I
- —
- Monthly cashflow
- —
- DSCR
- —
- Eligible?
- —
Short-term bridge; refi at stabilization.
Rent comps 27 comps
| Address | Beds | Baths | Sqft | Rent | $/sqft | DOM | Units | Dist |
|---|---|---|---|---|---|---|---|---|
| 26900 Forestview Ave Euclid, OH | 3.0 | 1.0 | 1098 | $1,450 | $1.32 | 1d | 1 | 0.19mi |
| 245 E 262nd St Euclid, OH | 3.0 | 2.0 | 1226 | $1,840 | $1.50 | 1d | 1 | 0.26mi |
| 25611 Lakeshore Blvd Unit F11 Euclid, OH | 2.0 | 1.0 | 925 | $995 | $1.08 | 43d | 1 | 0.37mi |
| 26611 Lakeshore Blvd Unit UP Euclid, OH | 3.0 | 2.0 | 1400 | $1,275 | $0.91 | 20d | 1 | 0.40mi |
| 26351 Farringdon Ave Euclid, OH | 3.0 | 1.0 | 1257 | $1,495 | $1.19 | 1d | 1 | 0.40mi |
| 25311 Lakeshore Blvd Unit C14 Euclid, OH | 2.0 | 1.0 | 925 | $995 | $1.08 | 43d | 1 | 0.42mi |
| 27471 Forestview Ave Euclid, OH | 3.0 | 1.0 | 1282 | $1,495 | $1.17 | 43d | 1 | 0.44mi |
| 25301 Shoreview Ave Euclid, OH | 3.0 | 2.0 | 1131 | $1,499 | $1.33 | 1d | 1 | 0.48mi |
| 25301 Shoreview Ave Euclid, OH | 3.0 | 2.0 | 1131 | $1,849 | $1.63 | 14d | 1 | 0.48mi |
| 611 E 260th St Euclid, OH | 3.0 | 1.0 | 875 | $1,595 | $1.82 | 43d | 1 | 0.49mi |
| 26230 Briardale Ave Euclid, OH | 3.0 | 2.0 | 1290 | $1,600 | $1.24 | 1d | 1 | 0.58mi |
| 368 E 248th St Euclid, OH | 3.0 | 1.0 | 1440 | $1,395 | $0.97 | 43d | 1 | 0.63mi |
| 24570 Lakeshore Blvd Euclid, OH | 1.0–2.0 | 1.0 | 925 | $1,200 | $1.30 | 43d | 1 | 0.63mi |
| 300 E 246th St Euclid, OH | 3.0 | 1.0 | 1116 | $1,864 | $1.67 | 43d | 1 | 0.64mi |
| 24453 Lakeshore Blvd Euclid, OH | 1.0–2.0 | 1.0–2.0 | 781 | $1,040 | $1.33 | 1d | 10 | 0.67mi |
| 23951 Lakeshore Blvd Euclid, OH | 1.0–3.0 | 1.0–1.5 | 850 | $972 | $1.14 | 1d | 7 | 0.81mi |
| 101 E 238th St Euclid, OH | 2.0 | 1.0 | 959 | $1,400 | $1.46 | 14d | 1 | 0.85mi |
| 24200 Puritan Rd Euclid, OH | 3.0 | 1.0 | 1100 | $1,199 | $1.09 | 12d | 1 | 1.13mi |
| 23214 Gay St Euclid, OH | 3.0 | 1.0 | 1634 | $1,864 | $1.14 | 23d | 1 | 1.20mi |
| 23901 Puritan Rd Euclid, OH | 3.0 | 1.0 | 1326 | $1,595 | $1.20 | 14d | 1 | 1.20mi |
| 374 E 232nd St Euclid, OH | 3.0 | 1.0 | 1222 | $1,995 | $1.63 | 43d | 1 | 1.23mi |
| 655 E 240th St Euclid, OH | 3.0 | 1.0 | 1341 | $1,550 | $1.16 | 43d | 1 | 1.24mi |
| 27701 Mills Ave Unit 2E Euclid, OH | 2.0 | 1.5 | 1176 | $1,275 | $1.08 | 43d | 1 | 1.28mi |
| 884 E 248th St Euclid, OH | 3.0 | 2.0 | 1440 | $1,699 | $1.18 | 1d | 1 | 1.39mi |
| 29103 Barjode Rd Willowick, OH | 3.0 | 2.0 | 1116 | $1,950 | $1.75 | 19d | 1 | 1.41mi |
| 29210 Green Dr Willowick, OH | 3.0 | 1.0 | 1002 | $1,700 | $1.70 | 1d | 1 | 1.46mi |
| 645 Babbitt Rd Euclid, OH | 3.0 | 1.0 | 1200 | $1,400 | $1.17 | 12d | 1 | 1.47mi |
Listing history 7 events
-
2026-06-16status $139,000 Pending 10 DOM
-
2026-06-15days on market $139,000 Active 10 DOM
-
2026-06-13days on market $139,000 Active 8 DOM
-
2026-06-09days on market $139,000 Active 4 DOM
-
2026-06-08days on market $139,000 Active 3 DOM
-
2026-06-07remarks 699-char remark
-
2026-06-07$139,000 Active 2 DOM
ⓘ Source: listings_history table (triggers on properties + properties_extension) + one-shot
backfill from property_details.listing_events for pre-trigger history.
Tax reassessment forecast OH · Partial reset (capped growth)
- Current annual tax
- $3,192 · $266/mo
- Projected year-2 tax
- $3,192 · $266/mo
- Expected delta
- $0/yr ($0/mo · 0.0%)
ⓘ Screening estimate from a state-policy table — verify with the county assessor before closing.
Climate risk First Street
- Flood 1/10 Low FEMA zone X (unshaded) · 0% chance over 30 yrs
- Wildfire 1/10 Low
- Heat 3/10 Moderate 7 d/yr ≥94°F today · 17 d/yr by 30 yrs out
- Wind 1/10 Low
- Air quality 3/10 Moderate 3 unhealthy d/yr today · 4 by 30 yrs out
Nearby sold comps map
Loading sold comps map…
Walkable amenities ~0.75 mi
Loading nearby amenities…
Taxation est. · year 1
- Rental income
- $17,797
- − Mortgage interest
- −$7,786
- − Property taxes
- −$3,192
- − Insurance
- −$695
- − Repairs & maintenance
- −$1,424
- − Management
- −$1,424
- − Depreciation
- −$4,044
- Taxable loss
- −$767
- Est. tax savings @ 24.0%
- +$184
- After-tax cash flow
- $1,610/yr
For passive investors: Depreciation is non-cash, so a rental often shows a tax loss while cash-flowing — sheltering income. Rental losses are passive: they offset passive income freely, and up to $25,000/yr can offset ordinary (W-2) income if you actively participate and your MAGI is under $100k (phasing out to $0 by $150k); unused losses carry forward. On sale, claimed depreciation is recaptured at up to 25%, and gains may owe capital-gains tax (a 1031 exchange can defer both). Figures are a year-1 estimate at your 24.0% rate — not tax advice; consult a CPA.
Schools (NCES district)
- District
- Euclid City
- NCES district ID
- 3904395
- Math proficiency
- 14% ▼ -19.00%
- Reading proficiency
- 28% ▼ -14.00%
- Median HH income
- $36,385
- Composite
- 17.39/100
- National rank
- #9067
- State rank
- #625 of 656 in OH
Livability — Euclid
- Score
- 77/100
- State rank
- #204
- US rank
- #3149
Category grades
Schools grade is shown separately in the Schools card above.
Census & demographics
- Census place
- Euclid, OH
- County
- Cuyahoga County · 1,090,369 people
- City population
- 41,855
- Metro
- Cleveland-Elyria, OH
- Population (ZIP)
- 14,633
- Household income
- $47,969
- Rent vs Own
- Severe rent burden
- 1297.0
Population outlook (Cuyahoga County) Hauer SSP2
- Today (2025)
- 1,244,621 people
- By 2030
- 1,230,093 · -1.2%
- By 2040
- 1,189,108 · -4.5%
- By 2050
- 1,145,706 · -7.9%
- By 2075
- 1,076,557 · -13.5%
- By 2100
- 978,987 · -21.3%
Race, ethnicity, and origin ACS 2023
- Neighborhood character
- Majority Black (64%)
- Race & ethnicity
- Black 64% White 29% Two or more races 3% Hispanic / Latino 2%
- Common ancestry
- Romanian 4% Italian 1% Subsaharan African 1%
- Foreign-born
- 3%
- Languages at home
- 93% English-only · Spanish 3% Russian/Polish/Slavic 1%
Political lean MEDSL · Cuyahoga
- 2024 margin
- Solid D (+31.5) · D 65.4% · R 33.9%
- 2008→2024 swing
- -7.4pp toward R · 2008: 38.9pp · 2024: 31.5pp
- All cycles
- 2024: D+31.5 2020: D+34.1 2016: D+35.0 2012: D+38.7 2008: D+38.9
Not yet ingested
- Civics
- —
Market trends
- HPI YoY
- ▼ -41.89%
- Current HPI
- 206.0583
- Rent YoY
- ▲ 15.49%
- Metro
- Cleveland-Elyria, OH
- State GDP YoY
- ▲ 1.98%
- F500 in state
- 48
Industry mix (Fortune 500 HQ in OH)
| Industry | F500 HQs | Revenue |
|---|---|---|
| Insurance | 3 | $145B |
|
||
| Industrial Machinery | 3 | $49B |
|
||
| Financial Services | 3 | $24B |
|
||
| Consumer Goods | 2 | $93B |
|
||
| Aerospace / Defense | 2 | $47B |
|
||
| Utilities | 2 | $33B |
|
||
Price history
+65.5% since first listed16 events — show timeline
- 2026-06-05 Listed $139,000 MLSNOW
- 2025-02-06 Rental Removed $1,595 PROPERTYWARE
- 2025-01-26 Listed for Rent $1,595 PROPERTYWARE
- 2024-12-14 Rental Removed $1,595 RENTALBEAST
- 2024-12-14 Rental Removed $1,595 PROPERTYWARE
- 2024-12-14 Listed for Rent $1,595 RENTALBEAST
- 2024-12-11 Listed for Rent $1,595 PROPERTYWARE
- 2020-08-31 Sold (Public Records) $88,000 Public Records
- 2020-08-28 Listing Removed — MLSNOW
- 2020-08-28 Sold (MLS) $88,000 MLSNOW
- 2020-08-04 Pending — MLSNOW
- 2019-10-20 Listed $100,000 MLSNOW
- 2005-07-12 Sold (Public Records) $108,000 Public Records
- 1996-04-25 Sold (MLS) $75,000 MLSNOW
- 1996-04-17 Sold (Public Records) $75,000 Public Records
- 1996-02-22 Listed $84,000 MLSNOW
Property tax history
+2.5%/yrLatest (2025): $3,192 · -3.0% YoY. Source: county tax records.
Cash-flow waterfall
monthlySold comps — $/sqft
last 12 mo · ≤1 miLoading sold comps…