 Multi-family
3333 Fowlerville Rd · Fowlerville, NY
Flood risk No data
- FEMA flood zone
- —
- Chance of flooding over 30 yrs
- —
- Est. flood insurance / yr
- —
Fire risk No data
- Est. fire insurance / yr
- —
Heat risk No data
- Hot days now (above threshold)
- —
- Hot days in 30 yrs
- —
Wind risk No data
- Chance of severe wind over 30 yrs
- —
Air-quality risk No data
- Unhealthy air days now
- —
- Unhealthy air days in 30 yrs
- —
Risk factors via First Street. Map © Google.
Why this score? — see what drove the B grade
The composite is a weighted blend of 9 inputs, each scored 0–100. Each bar is that input's sub-score; the figure is the points it added to the 100-point composite (weight × sub-score).
- Cash flow +29.1/30.0
- DSCR +10.0/10.0
- 1% rule +7.8/10.0
- ARV discount +7.5/15.0
- Appreciation +5.4/10.0
- Schools +4.2/10.0
- Livability +2.8/5.0
- Rent growth +2.5/5.0
- Condition / age +2.2/5.0
$129,900
🖨 Deal sheet 📄 Offer letter ✓ Due diligence
Multi-family units
County records classify this as Multi-Family (5+ Unit). Listing-text estimate: 1 unit. estimate disagrees with records
5+ unit building — per-unit beds/baths from public records are typically unavailable; the breakdown below (if shown) is an estimate from the listing text.
Listing remarks
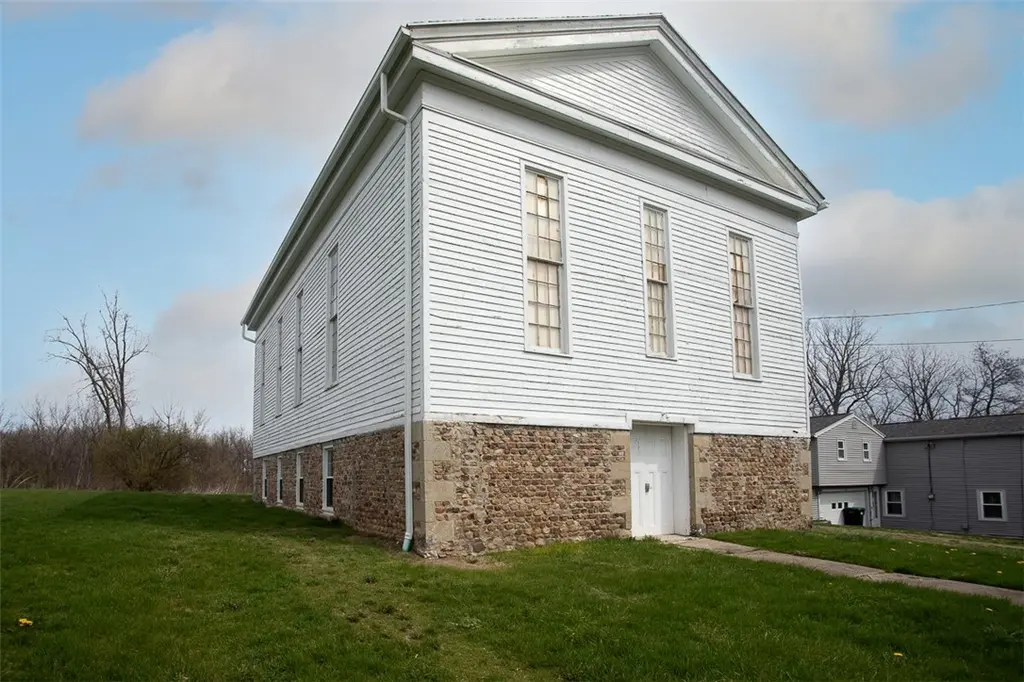
A rare opportunity to own a piece of history! Welcome to this truly unique property, full of character and opportunity. Once a church, this distinctive building is ready to be transformed into your vision. Set on a cobblestone foundation, the craftsmanship alone tells a story - one that's ready for its next chapter. The ground level (approx 1395 sq ft) has been thoughtfully renovated into a rustic and inviting one-bedroom apartment, ready for immediate occupancy. Upstairs, the former sanctuary (approx 1600 sq ft) has been fully gutted, offering a blank canvas for your ideas. With endless possibilities - art studio, Airbnb, apartments, home business or creative live/work space - this propert
Key facts
- 0.42 acre lot
- Built 1854
- Listed 28 days
Neighborhood map
What this means for you Summary
Snapshot
- This is a 2-bed/1.0-bath multifamily listed at $130k. Condition is rated fair.
Deal economics
- At list price, monthly cash flow is $450 ($5k/yr) — positive.
- The deal already cash-flows at list — no discount required.
- Meets the 1% rule at list price ($2k rent vs $130k).
- Recommended offer: $128k (1.5% below list) — sets the bar for market timing.
Location & tenants
- Location reads 56/100 on livability (#1,114 in NY) — a working-class tenant base; expect higher turnover. Strengths: employment A+, crime A; Watch: schools F, amenities F, commute F.
- York Central School District (rural): math 41% / reading 55% proficiency, ranked #403 of 590 in NY (top 68%) — families likely to look elsewhere, expect single-tenant / working-renter base with shorter leases.
- Market conditions: 5 active listings in the ZIP; 86 units permitted in Livingston County in 2024 (0 in 5+ unit buildings).
Forward outlook
- In year one you build about $2k of equity ($898 loan paydown + $1k appreciation (0.9% local appreciation)).
- Livingston County population projected at -13% by 2050 — secular population decline; favor cash flow + early exit over multi-decade hold.
- At projected returns (0.9% appreciation + 3.0% rent growth), your $36k cash investment doubles in ~5 years — after that, you're playing with house money.
Negotiation context
- It's been on market 28 days — a 2% lower offer ($128k) is reasonable based on typical stale-listing flexibility.
Risks & watch-outs
- Watch-outs: built in 1854 — expect roof / HVAC / electrical / plumbing capex.
Questions for the listing agent
- Have any recent inspections been done? Can we get a copy of the seller's disclosures and any deferred-maintenance estimates?
- Built in 1854 — when were the roof, HVAC, electrical panel, plumbing, and water heater last replaced?
- Is there a deadline driving the sale (1031 exchange, divorce, estate, relocation)? That informs how much negotiation room exists.
- Schools are F-rated, which usually means shorter tenancies and higher turnover. Who's the typical renter profile here, and what's been the actual vacancy rate?
- What's the average days-on-market for RENTAL listings here right now (not sales)? A rising rental-DOM trend means longer vacancies and softer asking-rent achievability than the comps imply.
- What's the recent tenant-quality profile in this submarket — average credit score on applications, eviction rate, late-payment / NSF rate, and stable-employment percentage? A property-management company in the area should have these aggregated.
- How much new apartment / multifamily construction is in the pipeline within 1–3 miles? Heavy new supply (>2% of stock underway) typically softens rents 12–24 months out; light construction supports rent growth.
Investment metrics
- 1% rule
- 1.28% ✓
- Cap rate
- 10.45%
- Cash-on-cash
- 14.85%
- DSCR
- 1.66
- GRM
- 6.5
CMA / ARV
No comps found within radius.
Projected returns pro-forma
0.87% appreciation · 3.0% rent growth · sell at horizon
- IRR
- 16.4%
- Equity multiple
- 1.83×
- Total profit
- $30,274
- Equity at exit
- $43,473
- IRR
- 19.9%
- Equity multiple
- 3.38×
- Total profit
- $86,669
- Equity at exit
- $57,104
Cash invested: $36,372 (down + closing). Projections, not guarantees.
Landlord ↔ Tenant lean methodology
- Overall (STATE)
- 15 Strongly Tenant-Friendly
- State New York
- 15 Strongly Tenant-Friendly · D+10
- County
- — inherits STATE
- City
- — inherits STATE
ZIP-level market 14592
- Home prices YoY
- 0.4%
- Active inventory
- 5
- Price-to-rent
- 12.9×
Monthly cashflow live
- Estimated rent
- $1,660 medium interval (Pro) →
- Mortgage (P&I)
- −$681
- Tax from tax record
- −$126 /mo · $1,513/yr
- Insurance
- −$54
- HOA
- −$0
- Vacancy / Maint / Mgmt
- −$349
- Net cashflow
- $450
Break-even live
2-unit breakdown (identical units grouped — click to expand)
| Units | Beds | Baths | Est. rent |
|---|---|---|---|
| 1× unit | 1 | 1 | $841 |
| 1× unit | 0 | 0 | $819 |
| Total (2 units) | $1,660 | ||
UW: 25.0% down · 7.5% · 30yr · 1.5% tax · 5.0% vac · 8.0% maint · 8.0% mgmt
Financing live
Cash to close
- Down payment
- $32,475
- Closing costs
- $3,897
- Reserves months
- —
- Total cash needed
- —
Loan-product check · same deal, 3 products live
Conventional
25% down · 7.5% · 30yr
- Down + closing
- —
- Monthly P&I
- —
- Monthly cashflow
- —
- DSCR
- —
- Eligible?
- —
Personal DTI + credit; lowest rate.
DSCR
20% down · 8.5% · 30yr
- Down + closing
- —
- Monthly P&I
- —
- Monthly cashflow
- —
- DSCR
- —
- Eligible?
- —
No personal income docs; deal must DSCR.
Hard money
10% down · 12.0% · 12mo
- Down + closing
- —
- Monthly P&I
- —
- Monthly cashflow
- —
- DSCR
- —
- Eligible?
- —
Short-term bridge; refi at stabilization.
Listing history 3 events
-
2026-05-13status Pending
-
2026-04-20historical Active Under Contract
-
2026-04-15$129,900 Active
ⓘ Source: listings_history table (triggers on properties + properties_extension) + one-shot
backfill from property_details.listing_events for pre-trigger history.
Tax reassessment forecast NY · Partial reset (capped growth)
- Current annual tax
- $1,513 · $126/mo
- Projected year-2 tax
- $1,854 · $154/mo
- Expected delta
- +$341/yr (+$28/mo · 22.6%)
ⓘ Screening estimate from a state-policy table — verify with the county assessor before closing.
Nearby sold comps map
Loading sold comps map…
Walkable amenities ~0.75 mi
Loading nearby amenities…
Taxation est. · year 1
- Rental income
- $19,920
- − Mortgage interest
- −$7,276
- − Property taxes
- −$1,513
- − Insurance
- −$650
- − Repairs & maintenance
- −$1,594
- − Management
- −$1,594
- − Depreciation
- −$3,779
- Taxable income
- $3,515
- Est. tax owed @ 24.0%
- −$844
- After-tax cash flow
- $4,557/yr
For passive investors: Depreciation is non-cash, so a rental often shows a tax loss while cash-flowing — sheltering income. Rental losses are passive: they offset passive income freely, and up to $25,000/yr can offset ordinary (W-2) income if you actively participate and your MAGI is under $100k (phasing out to $0 by $150k); unused losses carry forward. On sale, claimed depreciation is recaptured at up to 25%, and gains may owe capital-gains tax (a 1031 exchange can defer both). Figures are a year-1 estimate at your 24.0% rate — not tax advice; consult a CPA.
Condition & rehab AI · 2 photos
This historic property, once a church, requires extensive repairs and maintenance to bring it up to a fair condition. Significant work is needed on the roof and exterior siding, with landscaping and fencing also in poor condition. The highest-ROI updates would be to repair and replace the roof and paint the exterior siding, as these improvements would significantly enhance the home's resale and rental value.
Repairs flagged
- Major roof — Signs of significant damage
- Major exterior siding — Peeling paint and visible damage
- Minor fencing — Needs cleaning and minor repairs
Value-add opportunities
- Both repair and replace roof — A new roof would significantly improve the home's appearance and value
- Both repair and paint exterior siding — A fresh coat of paint would enhance the home's curb appeal and value
- Both landscape and maintain exterior — A well-maintained exterior would improve the home's curb appeal and rental value
Renovation cost estimate screening
| Repair item | Severity | Est. cost |
|---|---|---|
| roof · Signs of significant damage | Major | $15,000–50,000 |
| exterior siding · Peeling paint and visible damage | Major | $15,000–50,000 |
| fencing · Needs cleaning and minor repairs | Minor | $500–3,000 |
| Total estimated repair cost · 3 items | $30,500–103,000 |
Value-add ROI direction
- Both repair and replace roof — A new roof would significantly improve the home's appearance and value ↑
- Both repair and paint exterior siding — A fresh coat of paint would enhance the home's curb appeal and value ↑
- Both landscape and maintain exterior — A well-maintained exterior would improve the home's curb appeal and rental value ↑
ⓘ Cost ranges are severity-bucket heuristics (US national rule-of-thumb). Get contractor quotes + a written scope before underwriting a rehab budget.
Schools (NCES district)
- District
- York Central School District
- NCES district ID
- 3631950
- Math proficiency
- 41% ▼ -6.00%
- Reading proficiency
- 55% ▲ 7.00%
- Median HH income
- $58,572
- Composite
- 41.9/100
- National rank
- #3366
- State rank
- #403 of 590 in NY
Livability — Fowlerville
- Score
- 56/100
- State rank
- #1114
- US rank
- #22859
Category grades
Schools grade is shown separately in the Schools card above.
Census & demographics
- Census place
- Fowlerville, NY
- Population (ZIP)
- 119
Population outlook (Livingston County) Hauer SSP2
- Today (2025)
- 63,466 people
- By 2030
- 61,966 · -2.4%
- By 2040
- 58,398 · -8.0%
- By 2050
- 54,955 · -13.4%
- By 2075
- 49,958 · -21.3%
- By 2100
- 43,944 · -30.8%
Race, ethnicity, and origin ACS 2023
- Neighborhood character
- Predominantly White (100%)
- Race & ethnicity
- White 100%
- Common ancestry
- Iranian 5%
Political lean MEDSL · Livingston
- 2024 margin
- Strong R (+21.4) · D 39.3% · R 60.7%
- 2008→2024 swing
- -13.6pp toward R · 2008: -7.9pp · 2024: -21.4pp
- All cycles
- 2024: R+21.4 2020: R+18.2 2016: R+27.8 2012: R+9.4 2008: R+7.9
Not yet ingested
- Civics
- —
Market trends
- HPI YoY
- ▲ 0.87%
- Current HPI
- 226.1541
- Rent YoY
- —
- Metro
- —
- State GDP YoY
- ▲ 2.60%
- F500 in state
- 92
Industry mix (Fortune 500 HQ in NY)
| Industry | F500 HQs | Revenue |
|---|---|---|
| Financial Services | 10 | $950B |
|
||
| Consumer Goods | 9 | $162B |
|
||
| Insurance | 4 | $225B |
|
||
| Telecommunications | 2 | $144B |
|
||
| Pharmaceuticals | 2 | $112B |
|
||
| Media / Entertainment | 2 | $69B |
|
||
Price history
3 events — show timeline
- 2026-05-13 Pending — UNYREIS
- 2026-04-20 Contingent — UNYREIS
- 2026-04-15 Listed $129,900 UNYREIS
Property tax history
+2.8%/yrLatest (2025): $1,513 · +5.9% YoY. Source: county tax records.
Cash-flow waterfall
monthlySold comps — $/sqft
last 12 mo · ≤1 miLoading sold comps…