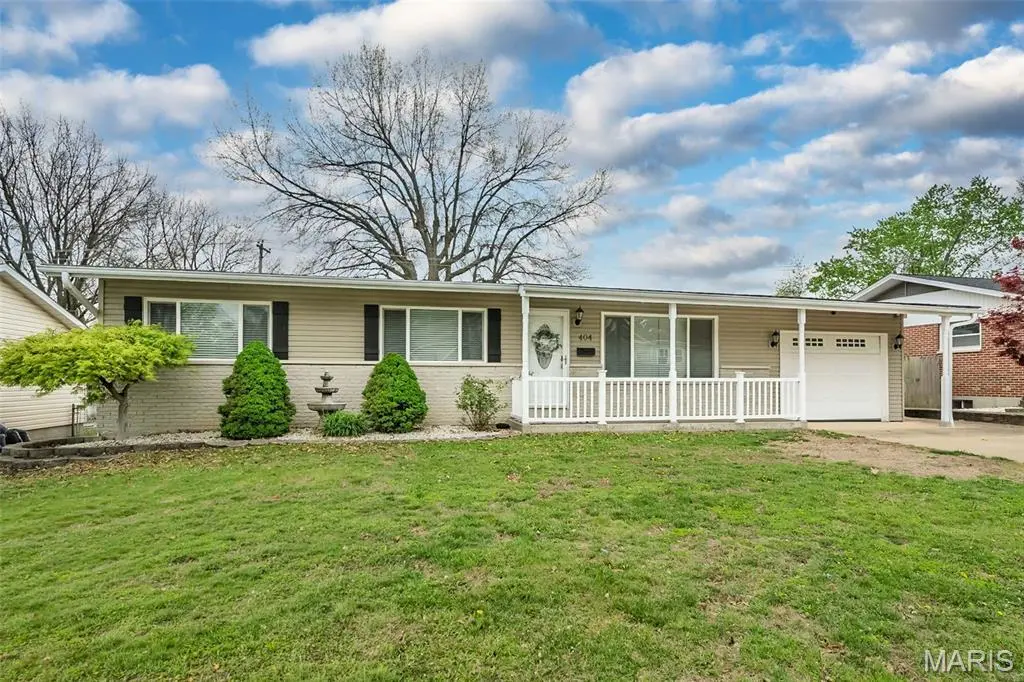
404 Elmwood Dr · St. Charles, MO
Flood risk 1/10 · Minimal
- FEMA flood zone
- X (unshaded)
- Chance of flooding over 30 yrs
- 0.0%
- Est. flood insurance / yr
- $473 – $860
Fire risk 1/10 · Minimal
- Est. fire insurance / yr
- $1,054 – $1,958
Heat risk 5/10 · Moderate
- Hot days now (above 106°F)
- 7 days/yr
- Hot days in 30 yrs
- 20 days/yr
Wind risk 2/10 · Minimal
- Chance of severe wind over 30 yrs
- 1.0%
Air-quality risk 3/10 · Minor
- Unhealthy air days now
- 2 days/yr
- Unhealthy air days in 30 yrs
- 3 days/yr
Risk factors via First Street. Map © Google.
Why this score? — see what drove the D grade
The composite is a weighted blend of 9 inputs, each scored 0–100. Each bar is that input's sub-score; the figure is the points it added to the 100-point composite (weight × sub-score).
- Cash flow +13.3/30.0
- ARV discount +9.8/15.0
- Schools +4.1/10.0
- DSCR +4.0/10.0
- Rent growth +3.3/5.0
- 1% rule +3.1/10.0
- Livability +2.5/5.0
- Condition / age +2.5/5.0
- Appreciation +0.0/10.0
$299,900
🖨 Deal sheet 📄 Offer letter ✓ Due diligence
Listing remarks MLS
Ranch w/finished basement updated from top to bottom! Offers so much! Space has been used in the most creative way to allow for your every need. Beautiful newer laminate wood flooring in Great Room, Hall & Breakfast Rm. Kitchen w/tons of counter space, updated cabinetry & counters, ceramic backsplash & flooring, newer appliances including smooth top range, microwave, deep sink & pantry. Newer tall baseboards. Master BDR w/ bath offers updated with lovely ceramic. Newer frieze carpeting in 2010. Awesome finished basement w/ 2 additional sleeping rooms, built in bar area, office & bath. The extended garage is 25 ft. deep w/ built in storage area & built in ceiling storage. Extra driveway pad length of garage. The fenced yard w/ shed for additional storage. Huge play set will stay. Pella windows new in 2008. New furnace in 2009. New A/C, roof, siding, fascia, gutters & porch railing in 2011. All fixtures, lighting & doors updated. Pride of ownership shows here! Impeccable!
Key facts
- 9,169 sq ft lot
- Garage
- Built 1960
Neighborhood map
What this means for you Summary
Snapshot
- This is a 3-bed/2.5-bath single-family listed at $300k.
Deal economics
- At list price, monthly cash flow is $2 ($23/yr) — positive.
- The deal already cash-flows at list — no discount required.
- To meet the 1% rule (rent ≥ 1% of price), the offer needs to be $244k (18.6% below list).
- Recommended offer: $244k (18.6% below list) — sets the bar for 1% rule.
- Cap rate 6.3% vs local median 3.3% in St. Charles — top-decile yield for the area; either an underpriced asset or a hidden risk that comps aren't pricing in. Stress-test before assuming the spread holds.
Location & tenants
- Location reads: area grade D — affects rentability + tenant quality, not the cash-flow math above.
- St. Charles R-VI (urban): math 44% / reading 52% proficiency, ranked #51 of 324 in MO (top 16%) — families likely to look elsewhere, expect single-tenant / working-renter base with shorter leases.
- Zoned schools: Blackhurst Elementary (math 42% / reading 47%, grade F, #413 of 1,115 statewide, top 42%, 236 students, 56% FRL); St. Charles High (math 42% / reading 54%, grade D, #153 of 521 statewide, top 29%, 817 students, 43% FRL).
- Market conditions: Rents rising (+3.2%/yr); 294 active listings in the ZIP; 4 comparable units currently listed for rent nearby; rentals lingering (median 44d on market — plan ~5-8 weeks vacancy on turnover, expect pricing pressure); 50% of comp listings sitting > 30 days — soft ceiling on asking rent; solid renter incomes; 2,021 units permitted in St. Charles County in 2024 (568 in 5+ unit buildings).
- This rent runs 34% of the median local income ($85k/yr) — at the standard rent-burdened threshold; future hikes will face affordability resistance.
Forward outlook
- Local home prices are declining (-3.0%/yr); year-one equity from $2k of loan paydown is wiped out by about $9k of value loss. Plan a longer hold.
- St. Charles County population projected at +22% by 2050 — long-run rental-demand tailwind backs the buy-and-hold thesis.
Negotiation context
- Only 5 days on market — expect competitive offers; lowballing is unlikely to land.
- 2 sale attempts since 12y ago with the ask held roughly flat each time — persistent listings suggest the price (not the market) is what's stuck; bring a comps-based counter.
- Current owner paid $150k; list at $300k implies a 100% gain — meaningful room to come down on a strong offer.
Risks & watch-outs
- Climate carrying-cost: extreme-heat days projected 7→20/yr by 2055 (HVAC capex compounding) — expect insurance premiums to compound above CPI over the hold.
Questions for the listing agent
- Built in 1960 — when were the roof, HVAC, electrical panel, plumbing, and water heater last replaced?
- Is there a deadline driving the sale (1031 exchange, divorce, estate, relocation)? That informs how much negotiation room exists.
- The area grade is low — what's the realistic commute time and amenity access for the typical tenant pool here? Any planned neighborhood developments (good or bad) we should know about?
- What's the average days-on-market for RENTAL listings here right now (not sales)? A rising rental-DOM trend means longer vacancies and softer asking-rent achievability than the comps imply.
- What's the recent tenant-quality profile in this submarket — average credit score on applications, eviction rate, late-payment / NSF rate, and stable-employment percentage? A property-management company in the area should have these aggregated.
- How much new for-sale + rental construction is in the pipeline within 1–3 miles? Heavy new supply typically softens prices + rents 12–24 months out; constrained supply supports both.
Investment metrics
- 1% rule
- 0.81% ✗
- Cap rate
- 6.30%
- Cash-on-cash
- 0.03%
- DSCR
- 1.00
- GRM
- 10.2
CMA / ARV
- ARV (on-the-fly)
- $316,316
- Comps found
- 12
Show comp detail 12 sales within ~0.75 mi
| Address | Dist | Beds/Ba | Sqft | Sold | Price | $/sf | Match |
|---|---|---|---|---|---|---|---|
| 11 Elmwood Pl | 0.08mi | 3/2.0 | 2,080 (+4%) | 0mo | $329,000 | $158 | 87 |
| 104 Ashland Pl | 0.24mi | 3/1.5 | 2,002 (0%) | 2mo | $269,900 | $135 | 83 |
| 15 Elmwood Pl | 0.06mi | 3/2.0 | 2,168 (+8%) | 3mo | $274,900 | $127 | 79 |
| 2602 West Adams St | 0.10mi | 3/2.5 | 2,188 (+9%) | 4mo | $299,900 | $137 | 76 |
| 313 Gum Tree Dr | 0.48mi | 3/2.5 | 1,802 (-10%) | 1mo | $325,000 | $180 | 60 |
| 2900 Headland Dr | 0.34mi | 3/2.0 | 2,246 (+12%) | 5mo | $325,000 | $145 | 58 |
| 2916 Mockingbird Dr | 0.60mi | 4/2.5 (+1) | 2,080 (+4%) | 4mo | $349,000 | $168 | 57 |
| 105 Hunters Rdg | 0.69mi | 3/2.0 | 2,058 (+3%) | 5mo | $332,000 | $161 | 57 |
| 821 Laurel Ln | 0.57mi | 4/2.5 (+1) | 1,848 (-8%) | 1mo | $350,000 | $189 | 55 |
| 908 Crescent Dr | 0.44mi | 3/2.5 | 1,713 (-14%) | 1mo | $365,000 | $213 | 54 |
| 116 S Cadillac Dr | 0.36mi | 3/1.0 | 1,704 (-15%) | 1mo | $245,000 | $144 | 52 |
| 520 Rebecca Dr | 0.75mi | 3/2.5 | 1,856 (-7%) | 6mo | $284,900 | $154 | 48 |
Match score weights: distance 35% · size 25% · config 20% · recency 20%. Top-matched comps best support the ARV.
Projected returns pro-forma
-3.0% appreciation · 3.2% rent growth · sell at horizon
- IRR
- -16.1%
- Equity multiple
- 0.43×
- Total profit
- $-48,035
- Equity at exit
- $44,716
- IRR
- -7.4%
- Equity multiple
- 0.53×
- Total profit
- $-39,856
- Equity at exit
- $25,930
Cash invested: $83,972 (down + closing). Projections, not guarantees.
Landlord ↔ Tenant lean methodology
- Overall (STATE)
- 81 Strongly Landlord-Friendly
- State Missouri
- 81 Strongly Landlord-Friendly · R+10
- County
- — inherits STATE
- City
- — inherits STATE
ZIP-level market 63301
- Rents YoY
- 3.2%
- Active inventory
- 294
- Price-to-rent
- 10.2×
Monthly cashflow live
- Estimated rent
- $2,442 medium interval (Pro) →
- Mortgage (P&I)
- −$1,573
- Tax from tax record
- −$229 /mo · $2,753/yr
- Insurance
- −$125
- HOA
- −$0
- Vacancy / Maint / Mgmt
- −$513
- Net cashflow
- $2
Break-even live
UW: 25.0% down · 7.5% · 30yr · 1.5% tax · 5.0% vac · 8.0% maint · 8.0% mgmt
Financing live
Cash to close
- Down payment
- $74,975
- Closing costs
- $8,997
- Reserves months
- —
- Total cash needed
- —
Loan-product check · same deal, 3 products live
Conventional
25% down · 7.5% · 30yr
- Down + closing
- —
- Monthly P&I
- —
- Monthly cashflow
- —
- DSCR
- —
- Eligible?
- —
Personal DTI + credit; lowest rate.
DSCR
20% down · 8.5% · 30yr
- Down + closing
- —
- Monthly P&I
- —
- Monthly cashflow
- —
- DSCR
- —
- Eligible?
- —
No personal income docs; deal must DSCR.
Hard money
10% down · 12.0% · 12mo
- Down + closing
- —
- Monthly P&I
- —
- Monthly cashflow
- —
- DSCR
- —
- Eligible?
- —
Short-term bridge; refi at stabilization.
Rent comps 4 comps
| Address | Beds | Baths | Sqft | Rent | $/sqft | DOM | Units | Dist |
|---|---|---|---|---|---|---|---|---|
| 317 S Pam Ave Saint Charles, MO | 4.0 | 2.5 | 1880 | $2,484 | $1.32 | 43d | 1 | 0.47mi |
| 3149 Duquette Dr Saint Charles, MO | 3.0 | 2.0 | 1597 | $2,325 | $1.46 | 43d | 1 | 0.83mi |
| 119 Beacon Hill Dr Saint Charles, MO | 4.0 | 3.5 | 2414 | $3,750 | $1.55 | 1d | 1 | 0.93mi |
| 12 Fox Bluff Ct Saint Charles, MO | 3.0 | 2.0 | 2180 | $2,616 | $1.20 | 10d | 1 | 1.47mi |
Listing history 9 events
-
2026-04-18status Pending
-
2026-04-16$299,900 Active
-
2026-04-13historical $299,900
-
2014-05-16soldstatus
-
2014-05-13soldstatus 1026-char remark
Show marketing remark (1026 chars)
Ranch w/finished basement updated from top to bottom! Offers so much! Space has been used in the most creative way to allow for your every need. Beautiful newer laminate wood flooring in Great Room, Hall & Breakfast Rm. Kitchen w/tons of counter space, updated cabinetry & counters, ceramic backsplash & flooring, newer appliances including smooth top range, microwave, deep sink & pantry. Newer tall baseboards. Master BDR w/ bath offers updated with lovely ceramic. Newer frieze carpeting in 2010. Awesome finished basement w/ 2 additional sleeping rooms, built in bar area, office & bath. The extended garage is 25 ft. deep w/ built in storage area & built in ceiling storage. Extra driveway pad length of garage. The fenced yard w/ shed for additional storage. Huge play set will stay. Pella windows new in 2008. New furnace in 2009. New A/C, roof, siding, fascia, gutters & porch railing in 2011. All fixtures, lighting & doors updated. Pride of ownership shows here! Impeccable!
-
2014-04-07$159,900 1026-char remark
Show marketing remark (1026 chars)
Ranch w/finished basement updated from top to bottom! Offers so much! Space has been used in the most creative way to allow for your every need. Beautiful newer laminate wood flooring in Great Room, Hall & Breakfast Rm. Kitchen w/tons of counter space, updated cabinetry & counters, ceramic backsplash & flooring, newer appliances including smooth top range, microwave, deep sink & pantry. Newer tall baseboards. Master BDR w/ bath offers updated with lovely ceramic. Newer frieze carpeting in 2010. Awesome finished basement w/ 2 additional sleeping rooms, built in bar area, office & bath. The extended garage is 25 ft. deep w/ built in storage area & built in ceiling storage. Extra driveway pad length of garage. The fenced yard w/ shed for additional storage. Huge play set will stay. Pella windows new in 2008. New furnace in 2009. New A/C, roof, siding, fascia, gutters & porch railing in 2011. All fixtures, lighting & doors updated. Pride of ownership shows here! Impeccable!
-
2006-11-14soldstatus $149,900
-
2005-11-02soldstatus $126,175
-
1991-08-01soldstatus $71,000
ⓘ Source: listings_history table (triggers on properties + properties_extension) + one-shot
backfill from property_details.listing_events for pre-trigger history.
Tax reassessment forecast MO · Resets to sale price
- Current annual tax
- $2,753 · $229/mo
- Projected year-2 tax
- $2,909 · $242/mo
- Expected delta
- +$156/yr (+$13/mo · 5.7%)
ⓘ Screening estimate from a state-policy table — verify with the county assessor before closing.
Climate risk First Street
- Flood 1/10 Low FEMA zone X (unshaded) · 0% chance over 30 yrs
- Wildfire 1/10 Low
- Heat 5/10 Major 7 d/yr ≥106°F today · 20 d/yr by 30 yrs out
- Wind 2/10 Low 100% chance of damaging wind over 30 yrs
- Air quality 3/10 Moderate 2 unhealthy d/yr today · 3 by 30 yrs out
Nearby sold comps map
Loading sold comps map…
Walkable amenities ~0.75 mi
Loading nearby amenities…
Taxation est. · year 1
- Rental income
- $29,301
- − Mortgage interest
- −$16,799
- − Property taxes
- −$2,753
- − Insurance
- −$1,500
- − Repairs & maintenance
- −$2,344
- − Management
- −$2,344
- − Depreciation
- −$8,724
- Taxable loss
- −$5,163
- Est. tax savings @ 24.0%
- +$1,239
- After-tax cash flow
- $1,262/yr
For passive investors: Depreciation is non-cash, so a rental often shows a tax loss while cash-flowing — sheltering income. Rental losses are passive: they offset passive income freely, and up to $25,000/yr can offset ordinary (W-2) income if you actively participate and your MAGI is under $100k (phasing out to $0 by $150k); unused losses carry forward. On sale, claimed depreciation is recaptured at up to 25%, and gains may owe capital-gains tax (a 1031 exchange can defer both). Figures are a year-1 estimate at your 24.0% rate — not tax advice; consult a CPA.
Schools (NCES district)
- District
- St. Charles R-VI
- NCES district ID
- 2928920
- Math proficiency
- 44% ▼ -4.00%
- Reading proficiency
- 52% ▼ -1.00%
- Median HH income
- $52,897
- Composite
- 41.38/100
- National rank
- #3486
- State rank
- #51 of 324 in MO
Livability — St. Charles
No livability data for this city. (Only ~50 U.S. cities are tracked.)
Census & demographics
- Census place
- St. Charles, MO
- County
- Saint Charles County · 399,703 people
- Metro
- St. Louis, MO-IL
- Population (ZIP)
- 52,667
- Household income
- $85,308
- Rent vs Own
- Severe rent burden
- 1118.0
Population outlook (St. Charles County) Hauer SSP2
- Today (2025)
- 437,857 people
- By 2030
- 461,707 · +5.4%
- By 2040
- 503,222 · +14.9%
- By 2050
- 534,684 · +22.1%
- By 2075
- 597,047 · +36.4%
- By 2100
- 609,682 · +39.2%
Race, ethnicity, and origin ACS 2023
- Neighborhood character
- Predominantly White (80%)
- Race & ethnicity
- White 80% Black 7% Two or more races 7% Hispanic / Latino 7% Asian 2%
- Hispanic origin (detail)
- Mexican 4%
- Common ancestry
- Lithuanian 3% Romanian 2% Italian 2%
- Foreign-born
- 5% · Canada, Guatemala
- Languages at home
- 93% English-only · Spanish 4%
Political lean MEDSL · St. Charles
- 2024 margin
- R (+17.0) · D 40.8% · R 57.8% · Other 1.4%
- 2008→2024 swing
- -7.2pp toward R · 2008: -9.7pp · 2024: -17.0pp
- All cycles
- 2024: R+17.0 2020: R+17.5 2016: R+26.4 2012: R+21.0 2008: R+9.7
Not yet ingested
- Civics
- —
Market trends
- HPI YoY
- ▼ -289.53%
- Current HPI
- 221.0637
- Rent YoY
- ▲ 3.20%
- Metro
- St. Louis, MO-IL
- State GDP YoY
- ▲ 1.84%
- F500 in state
- 20
Industry mix (Fortune 500 HQ in MO)
| Industry | F500 HQs | Revenue |
|---|---|---|
| Healthcare | 1 | $163B |
|
||
| Insurance | 1 | $21B |
|
||
| Industrial Technology | 1 | $17B |
|
||
| Retail | 1 | $16B |
|
||
| Industrial Distribution | 1 | $10B |
|
||
| Utilities | 1 | $9B |
|
||
Price history
+322.4% since first listed9 events — show timeline
- 2026-04-18 Pending — MARIS as Distributed by MLS Grid
- 2026-04-16 Listed $299,900 MARIS as Distributed by MLS Grid
- 2026-04-13 Coming Soon $299,900 MARIS as Distributed by MLS Grid
- 2014-05-16 Sold (Public Records) — Public Records
- 2014-05-13 Sold (MLS) — MARIS as Distributed by MLS Grid
- 2014-04-07 Listed $159,900 MARIS as Distributed by MLS Grid
- 2006-11-14 Sold (Public Records) $149,900 Public Records
- 2005-11-02 Sold (Public Records) $126,175 Public Records
- 1991-08-01 Sold (Public Records) $71,000 Public Records
Property tax history
+3.8%/yrLatest (2025): $2,753 · +5.3% YoY. Source: county tax records.
Cash-flow waterfall
monthlySold comps — $/sqft
last 12 mo · ≤1 miLoading sold comps…