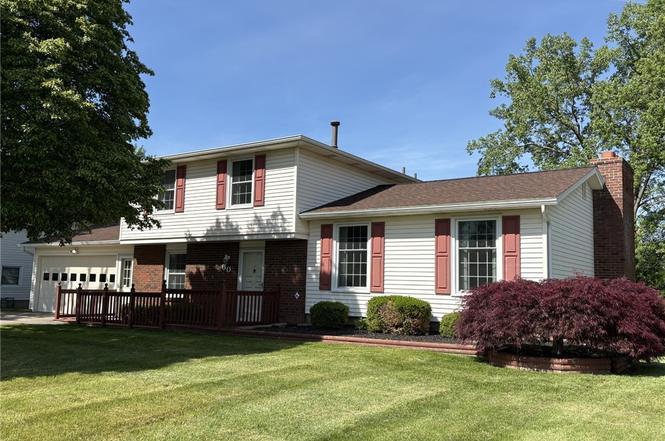
60 Riviera Dr · Gates, NY
Flood risk 1/10 · Minimal
- FEMA flood zone
- X (unshaded)
- Chance of flooding over 30 yrs
- 0.0%
- Est. flood insurance / yr
- $473 – $860
Fire risk 2/10 · Minimal
- Est. fire insurance / yr
- $691 – $1,283
Heat risk 2/10 · Minimal
- Hot days now (above 95°F)
- 7 days/yr
- Hot days in 30 yrs
- 15 days/yr
Wind risk 1/10 · Minimal
- Chance of severe wind over 30 yrs
- —
Air-quality risk 2/10 · Minimal
- Unhealthy air days now
- 1 days/yr
- Unhealthy air days in 30 yrs
- 1 days/yr
Risk factors via First Street. Map © Google.
Why this score? — see what drove the D+ grade
The composite is a weighted blend of 9 inputs, each scored 0–100. Each bar is that input's sub-score; the figure is the points it added to the 100-point composite (weight × sub-score).
- ARV discount +15.0/15.0
- Cash flow +12.3/30.0
- 1% rule +5.7/10.0
- DSCR +3.6/10.0
- Schools +3.6/10.0
- Livability +3.4/5.0
- Rent growth +2.5/5.0
- Condition / age +2.5/5.0
- Appreciation +0.0/10.0
$224,900
🖨 Deal sheet 📄 Offer letter ✓ Due diligence
Listing remarks
Welcome home to this impeccably maintained property, lovingly cared for by the same owner for more than 50 years. Originally the builder's model, this home reflects quality craftsmanship and pride of ownership throughout. Featuring three spacious bedrooms with generous closet space, one and one-half bathrooms, a nicely appointed eat-in kitchen, and formal living and dining rooms, this home offers both comfort and functionality for everyday living and entertaining. A cozy wood-burning fireplace provides the perfect gathering spot on cool evenings. Outside, you'll find a beautifully manicured yard and inviting front and rear decks—perfect for relaxing, enjoying your morning coffee, or h
Key facts
- Front and rear decks
- Eat in kitchen
- Manicured yard
Tags
Property features AI
Exterior
- Parking: Attached garage with garage door opener; Driveway; 2 garage spaces
- Utilities: Public water connected; Sewer connected; Circuit breaker electrical service
- Home design: Two-story house; Resale property
- Construction: Brick and vinyl siding exterior; Asphalt roof; Block foundation; Copper plumbing; Built (existing)
- Exterior features: Concrete driveway; Deck; Rectangular residential lot; City street frontage; Lot dimensions approximately 80 x 164
Interior
- Kitchen: Gas oven; Gas range; Range hood; Refrigerator; Exhaust fan
- Flooring: Carpet; Laminate; Tile; Varied flooring
- Bathrooms: 1 full bathroom; 1 half bathroom; 1 main-level bathroom
- Heating & cooling: Gas forced-air heating; Central air conditioning
- Interior features: Separate/formal dining room; Entrance foyer; Eat-in kitchen; Window treatments; Drapes
- Laundry & utility: Washer; Dryer; Laundry located in basement
Neighborhood map
What this means for you Summary
Snapshot
- This is a 3-bed/1.5-bath single-family listed at $225k.
Deal economics
- At list price, monthly cash flow is $-43 ($-511/yr) — negative.
- To cash-flow at today's rent, offer at most $217k (3.3% below list).
- Meets the 1% rule at list price ($2k rent vs $225k).
- Recommended offer: $217k (3.3% below list) — sets the bar for cash-flow.
Location & tenants
- Location reads 67/100 on livability (#582 in NY) — a middle-class / working-renter tenant base. Strengths: housing A+, health & safety A+; Watch: amenities F, commute F.
- Gates-Chili Central School District (suburban): math 41% / reading 42% proficiency, ranked #491 of 590 in NY (top 83%) — families likely to look elsewhere, expect single-tenant / working-renter base with shorter leases.
- Market conditions: 127 active listings in the ZIP; 6 comparable units currently listed for rent nearby; rentals at typical pace (median 15d on market — plan ~3-4 weeks tenant-placement turnaround); solid renter incomes; 1,169 units permitted in Monroe County in 2024 (591 in 5+ unit buildings).
- This rent runs 33% of the median local income ($88k/yr) — at the standard rent-burdened threshold; future hikes will face affordability resistance.
Forward outlook
- Local home prices are declining (-3.0%/yr); year-one equity from $2k of loan paydown is wiped out by about $7k of value loss. Plan a longer hold.
- Monroe County population projected to shrink 6% by 2050 — rents likely to lag national; underwrite the cash flow, not the appreciation.
Negotiation context
- Only 3 days on market — expect competitive offers; lowballing is unlikely to land.
Risks & watch-outs
- Watch-outs: property tax is 3.6% of price.
Questions for the listing agent
- What do current leases actually rent for vs. the listed asking? Can we see a recent rent roll and the last 12 months of T-12 income?
- Built in 1972 — when were the roof, HVAC, electrical panel, plumbing, and water heater last replaced?
- Property tax is high relative to price — has the assessment been appealed recently, and will the sale trigger a re-assessment?
- Is there a deadline driving the sale (1031 exchange, divorce, estate, relocation)? That informs how much negotiation room exists.
- Schools are B-rated — typically a magnet for longer-tenancy family renters. What's the average tenant stay here, and is there a school-zone premium baked into asking?
- The area grade is low — what's the realistic commute time and amenity access for the typical tenant pool here? Any planned neighborhood developments (good or bad) we should know about?
- What's the average days-on-market for RENTAL listings here right now (not sales)? A rising rental-DOM trend means longer vacancies and softer asking-rent achievability than the comps imply.
- What's the recent tenant-quality profile in this submarket — average credit score on applications, eviction rate, late-payment / NSF rate, and stable-employment percentage? A property-management company in the area should have these aggregated.
- How much new for-sale + rental construction is in the pipeline within 1–3 miles? Heavy new supply typically softens prices + rents 12–24 months out; constrained supply supports both.
Investment metrics
- 1% rule
- 1.07% ✓
- Cap rate
- 6.07%
- Cash-on-cash
- -0.81%
- DSCR
- 0.96
- GRM
- 7.8
CMA / ARV
- ARV (on-the-fly)
- $285,250
- Comps found
- 12
Show comp detail 12 sales within ~0.75 mi
| Address | Dist | Beds/Ba | Sqft | Sold | Price | $/sf | Match |
|---|---|---|---|---|---|---|---|
| 15 Currier Ln | 0.27mi | 3/1.5 | 1,625 (-0%) | 8mo | $303,000 | $186 | 80 |
| 67 Riviera Dr | 0.10mi | 4/2.0 (+1) | 1,739 (+7%) | 11mo | $260,000 | $150 | 68 |
| 18 Capri Dr | 0.50mi | 3/2.0 | 1,774 (+9%) | 2mo | $303,000 | $171 | 58 |
| 2 Sands Rd | 0.45mi | 3/2.0 | 1,730 (+6%) | 13mo | $310,000 | $179 | 56 |
| 4 Sands Rd | 0.43mi | 4/2.0 (+1) | 1,730 (+6%) | 12mo | $345,000 | $199 | 53 |
| 25 Bambi Ln | 0.64mi | 3/1.5 | 1,512 (-7%) | 9mo | $265,000 | $175 | 51 |
| 17 Courtright Ln | 0.31mi | 3/2.0 | 1,864 (+14%) | 11mo | $259,300 | $139 | 50 |
| 29 Davy Dr | 0.49mi | 4/2.0 (+1) | 1,754 (+8%) | 10mo | $275,000 | $157 | 49 |
| 30 Bambi Ln | 0.65mi | 3/1.5 | 1,480 (-9%) | 11mo | $270,000 | $182 | 45 |
| 22 Cherry Rd | 0.68mi | 3/1.5 | 1,456 (-11%) | 8mo | $108,000 | $74 | 44 |
| 39 Bambi Ln | 0.70mi | 3/2.0 | 1,480 (-9%) | 8mo | $230,000 | $155 | 43 |
| 39 Sahara Dr | 0.61mi | 4/2.5 (+1) | 1,430 (-12%) | 11mo | $308,000 | $215 | 33 |
Match score weights: distance 35% · size 25% · config 20% · recency 20%. Top-matched comps best support the ARV.
Projected returns pro-forma
-3.0% appreciation · 3.0% rent growth · sell at horizon
- IRR
- -17.5%
- Equity multiple
- 0.38×
- Total profit
- $-38,881
- Equity at exit
- $33,533
- IRR
- -9.3%
- Equity multiple
- 0.42×
- Total profit
- $-36,231
- Equity at exit
- $19,445
Cash invested: $62,972 (down + closing). Projections, not guarantees.
Landlord ↔ Tenant lean methodology
- Overall (STATE)
- 15 Strongly Tenant-Friendly
- State New York
- 15 Strongly Tenant-Friendly · D+10
- County
- — inherits STATE
- City
- — inherits STATE
ZIP-level market 14624
- Active inventory
- 127
- Price-to-rent
- 7.8×
Monthly cashflow live
- Estimated rent
- $2,407 high interval (Pro) →
- Mortgage (P&I)
- −$1,179
- Tax from tax record
- −$671 /mo · $8,052/yr
- Insurance
- −$94
- HOA
- −$0
- Vacancy / Maint / Mgmt
- −$505
- Net cashflow
- $-43
Break-even live
UW: 25.0% down · 7.5% · 30yr · 1.5% tax · 5.0% vac · 8.0% maint · 8.0% mgmt
Financing live
Cash to close
- Down payment
- $56,225
- Closing costs
- $6,747
- Reserves months
- —
- Total cash needed
- —
Loan-product check · same deal, 3 products live
Conventional
25% down · 7.5% · 30yr
- Down + closing
- —
- Monthly P&I
- —
- Monthly cashflow
- —
- DSCR
- —
- Eligible?
- —
Personal DTI + credit; lowest rate.
DSCR
20% down · 8.5% · 30yr
- Down + closing
- —
- Monthly P&I
- —
- Monthly cashflow
- —
- DSCR
- —
- Eligible?
- —
No personal income docs; deal must DSCR.
Hard money
10% down · 12.0% · 12mo
- Down + closing
- —
- Monthly P&I
- —
- Monthly cashflow
- —
- DSCR
- —
- Eligible?
- —
Short-term bridge; refi at stabilization.
Rent comps 6 comps
| Address | Beds | Baths | Sqft | Rent | $/sqft | DOM | Units | Dist |
|---|---|---|---|---|---|---|---|---|
| 50 Silverlight Way Rochester, NY | 2.0 | 2.0 | 1210 | $2,350 | $1.94 | 14d | 1 | 1.26mi |
| 25 Silverlight Way Unit 50 Rochester, NY | 3.0 | 2.5 | 1526 | $2,550 | $1.67 | 44d | 1 | 1.29mi |
| 25 Silverlight Way Unit 50 Rochester, NY | 2.0 | 2.0 | 1210 | $2,350 | $1.94 | 14d | 1 | 1.29mi |
| 50 Ivy Bridge Way Rochester, NY | 3.0 | 2.5 | 1526 | $2,550 | $1.67 | 44d | 1 | 1.32mi |
| 29 Ivy Bridge Way Westgate, NY | 3.0 | 2.5 | 1526 | $2,500 | $1.64 | 10d | 1 | 1.39mi |
| 37 Red Plank Way Rochester, NY | 3.0 | 2.5 | 1526 | $2,500 | $1.64 | 14d | 1 | 1.40mi |
Listing history 3 events
-
2026-06-15statusdays on market $224,900 Pending 3 DOM
-
2026-06-13remarks 693-char remark
-
2026-06-13$224,900 Active 2 DOM
ⓘ Source: listings_history table (triggers on properties + properties_extension) + one-shot
backfill from property_details.listing_events for pre-trigger history.
Tax reassessment forecast NY · Partial reset (capped growth)
- Current annual tax
- $8,052 · $671/mo
- Projected year-2 tax
- $8,052 · $671/mo
- Expected delta
- $0/yr ($0/mo · 0.0%)
ⓘ Screening estimate from a state-policy table — verify with the county assessor before closing.
Climate risk First Street
- Flood 1/10 Low FEMA zone X (unshaded) · 0% chance over 30 yrs
- Wildfire 2/10 Low
- Heat 2/10 Low 7 d/yr ≥95°F today · 15 d/yr by 30 yrs out
- Wind 1/10 Low
- Air quality 2/10 Low 1 unhealthy d/yr today · 1 by 30 yrs out
Nearby sold comps map
Loading sold comps map…
Walkable amenities ~0.75 mi
Loading nearby amenities…
Taxation est. · year 1
- Rental income
- $28,884
- − Mortgage interest
- −$12,598
- − Property taxes
- −$8,052
- − Insurance
- −$1,124
- − Repairs & maintenance
- −$2,311
- − Management
- −$2,311
- − Depreciation
- −$6,543
- Taxable loss
- −$4,055
- Est. tax savings @ 24.0%
- +$973
- After-tax cash flow
- $462/yr
For passive investors: Depreciation is non-cash, so a rental often shows a tax loss while cash-flowing — sheltering income. Rental losses are passive: they offset passive income freely, and up to $25,000/yr can offset ordinary (W-2) income if you actively participate and your MAGI is under $100k (phasing out to $0 by $150k); unused losses carry forward. On sale, claimed depreciation is recaptured at up to 25%, and gains may owe capital-gains tax (a 1031 exchange can defer both). Figures are a year-1 estimate at your 24.0% rate — not tax advice; consult a CPA.
Schools (NCES district)
- District
- Gates-Chili Central School District
- NCES district ID
- 3611880
- Math proficiency
- 41% ▼ -12.00%
- Reading proficiency
- 42% ▼ -6.00%
- Median HH income
- $55,045
- Composite
- 36.23/100
- National rank
- #4719
- State rank
- #491 of 590 in NY
Livability — Gates
- Score
- 67/100
- State rank
- #582
- US rank
- #10531
Category grades
Schools grade is shown separately in the Schools card above.
Census & demographics
- County
- Monroe County · 674,131 people
- Metro
- Rochester, NY
- Population (ZIP)
- 38,626
- Household income
- $87,989
- Rent vs Own
- Severe rent burden
- 584.0
Population outlook (Monroe County) Hauer SSP2
- Today (2025)
- 759,460 people
- By 2030
- 757,154 · -0.3%
- By 2040
- 740,644 · -2.5%
- By 2050
- 714,443 · -5.9%
- By 2075
- 645,883 · -15.0%
- By 2100
- 547,084 · -28.0%
Race, ethnicity, and origin ACS 2023
- Neighborhood character
- Predominantly White (78%)
- Race & ethnicity
- White 78% Black 9% Hispanic / Latino 6% Two or more races 5% Asian 3%
- Hispanic origin (detail)
- Puerto Rican 4%
- Common ancestry
- Romanian 6% Iranian 2% Lithuanian 2%
- Foreign-born
- 7% · Canada, China, India
- Languages at home
- 90% English-only · Spanish 3% Other Indo-European 3% Russian/Polish/Slavic 1%
Political lean MEDSL · Monroe
- 2024 margin
- D (+19.1) · D 59.5% · R 40.5%
- 2008→2024 swing
- +1.4pp toward D · 2008: 17.7pp · 2024: 19.1pp
- All cycles
- 2024: D+19.1 2020: D+21.0 2016: D+14.1 2012: D+17.4 2008: D+17.7
Not yet ingested
- Civics
- —
Market trends
- HPI YoY
- ▼ -151.26%
- Current HPI
- 267.356
- Rent YoY
- —
- Metro
- Rochester, NY
- State GDP YoY
- ▲ 2.60%
- F500 in state
- 92
Industry mix (Fortune 500 HQ in NY)
| Industry | F500 HQs | Revenue |
|---|---|---|
| Financial Services | 10 | $950B |
|
||
| Consumer Goods | 9 | $162B |
|
||
| Insurance | 4 | $225B |
|
||
| Telecommunications | 2 | $144B |
|
||
| Pharmaceuticals | 2 | $112B |
|
||
| Media / Entertainment | 2 | $69B |
|
||
Price history
1 event — show timeline
- 2026-06-11 Listed $224,900 UNYREIS
Property tax history
+4.7%/yrLatest (2025): $8,052 · +32.9% YoY. Source: county tax records.
Cash-flow waterfall
monthlySold comps — $/sqft
last 12 mo · ≤1 miLoading sold comps…