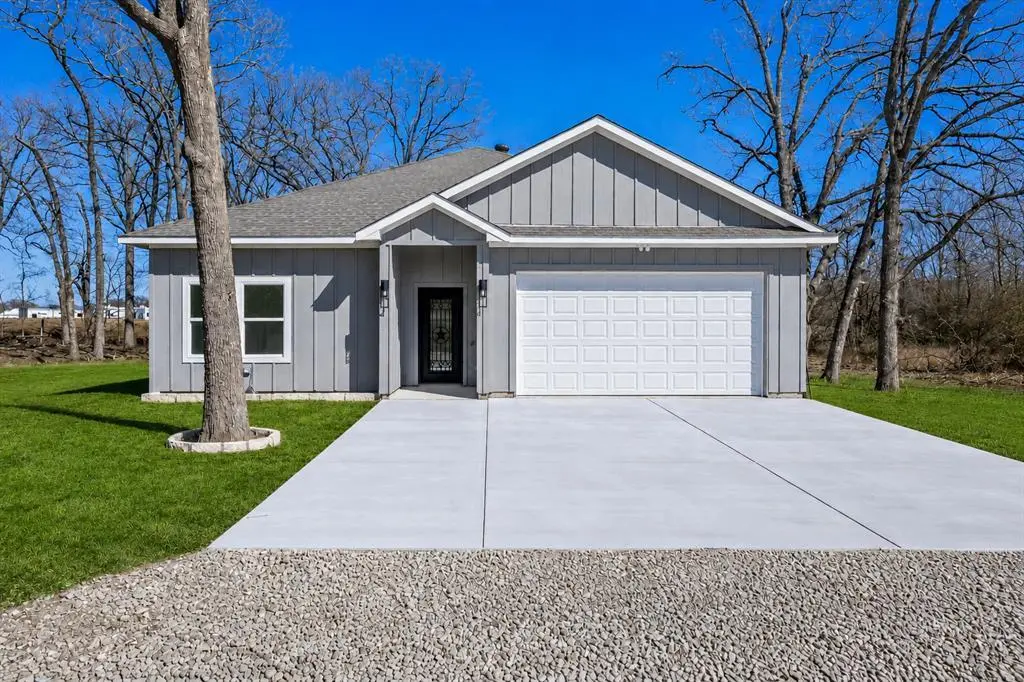
202 Dover Dr · West Tawakoni, TX
Flood risk 1/10 · Minimal
- FEMA flood zone
- X (unshaded)
- Chance of flooding over 30 yrs
- 0.0%
- Est. flood insurance / yr
- $507 – $1,088
Fire risk 4/10 · Minor
- Est. fire insurance / yr
- $1,222 – $2,270
Heat risk 7/10 · Major
- Hot days now (above 110°F)
- 7 days/yr
- Hot days in 30 yrs
- 25 days/yr
Wind risk 6/10 · Moderate
- Chance of severe wind over 30 yrs
- 27.0%
Air-quality risk 2/10 · Minimal
- Unhealthy air days now
- 0 days/yr
- Unhealthy air days in 30 yrs
- 1 days/yr
Risk factors via First Street. Map © Google.
Why this score? — see what drove the D- grade
The composite is a weighted blend of 9 inputs, each scored 0–100. Each bar is that input's sub-score; the figure is the points it added to the 100-point composite (weight × sub-score).
- Appreciation +10.0/10.0
- Cash flow +6.9/30.0
- ARV discount +6.7/15.0
- Livability +2.8/5.0
- Schools +2.6/10.0
- Rent growth +2.5/5.0
- Condition / age +2.5/5.0
- 1% rule +2.2/10.0
- DSCR +1.1/10.0
$270,000
🖨 Deal sheet 📄 Offer letter ✓ Due diligence
Listing remarks
Welcome to this beautifully maintained 4-bedroom, 2-bathroom home built in 2024, located in the Lancaster Park community of West Tawakoni. Just minutes from Lake Tawakoni and approximately an hour from Dallas, this home offers the perfect balance of peaceful living and convenient access to city amenities. Inside, you'll find a thoughtfully designed open-concept floor plan with 1,645 square feet of living space, ideal for both everyday living and entertaining. The spacious kitchen flows seamlessly into the dining and living areas, creating a functional layout for gathering with family and friends. The private primary suite features a generously sized walk-in closet and an oversized shower, p
Key facts
- 9,583 sq ft lot
- 2 garage spots
- Built 2024
Property features AI
Finance
- Financial info: No second mortgage; Loan type: Treat as Clear
- HOA & community: No association
Exterior
- Parking: Attached 2-car garage; 2 covered parking spaces; Concrete parking surfaces
- Utilities: City water; City sewer; No municipal utility district
- Home design: Single-family residence; Residential property; One story; Preowned (built in 2024)
- Construction: Built in 2024
- Exterior features: Lot in Lancaster Park subdivision; Less than 0.5 acre lot (approx. 0.22 acres); Agricultural restrictions
Interior
- Kitchen: Dishwasher; Disposal; Kitchen on level 1 (11 x 11)
- Bedrooms: Primary bedroom on level 1 (12 x 14); Bedroom on level 1 (11 x 14); Bedroom on level 1 (10 x 14)
- Bathrooms: 2 full bathrooms
- Interior features: Cable TV available; One living area; One dining area; 5 total rooms
Neighborhood map
What this means for you Summary
Snapshot
- This is a 4-bed/2.0-bath single-family listed at $270k.
Deal economics
- At list price, monthly cash flow is $-411 ($-5k/yr) — negative.
- To cash-flow at today's rent, offer at most $197k (26.9% below list).
- To meet the 1% rule (rent ≥ 1% of price), the offer needs to be $196k (27.5% below list).
- Recommended offer: $196k (27.5% below list) — sets the bar for 1% rule.
Location & tenants
- Location reads 56/100 on livability (#1,337 in TX) — a working-class tenant base; expect higher turnover. Strengths: cost of living A+, housing A+, crime A-; Watch: amenities F, commute F, employment F.
- Quinlan ISD (rural): math 27% / reading 34% proficiency, ranked #610 of 826 in TX (top 74%) — families likely to look elsewhere, expect single-tenant / working-renter base with shorter leases.
- Zoned schools: D C Cannon El (765 students, 81% FRL) — zoned schools average 81% FRL vs 60% district-wide (22 pts higher); higher-poverty schools than district average — tighter screening recommended.
- Market conditions: 335 active listings in the ZIP; 6 comparable units currently listed for rent nearby; rentals leasing fast (median 1d on market — plan ~1-2 weeks tenant-placement turnaround); 1,289 units permitted in Hunt County in 2024 (527 in 5+ unit buildings).
- This rent runs 37% of the median local income ($64k/yr) — at the standard rent-burdened threshold; future hikes will face affordability resistance.
Forward outlook
- In year one you build about $29k of equity ($2k loan paydown + $27k appreciation (10.0% local appreciation)).
- Hunt County population projected at +15% by 2050 — modest demand growth; plan on rents tracking national, not racing it.
- By year 2, paydown + projected appreciation supports a ~$46k cash-out refi (75% LTV) — recoverable capital for the next deal without selling this one.
Negotiation context
- Only 2 days on market — expect competitive offers; lowballing is unlikely to land.
- 4 sale attempts since 2y ago with the ask held roughly flat each time — persistent listings suggest the price (not the market) is what's stuck; bring a comps-based counter.
Risks & watch-outs
- Climate carrying-cost: major wind risk, 27% chance of damaging wind over 30y; extreme-heat days projected 7→25/yr by 2055 (HVAC capex compounding) — expect insurance premiums to compound above CPI over the hold.
Questions for the listing agent
- What do current leases actually rent for vs. the listed asking? Can we see a recent rent roll and the last 12 months of T-12 income?
- Is there a deadline driving the sale (1031 exchange, divorce, estate, relocation)? That informs how much negotiation room exists.
- Schools are F-rated, which usually means shorter tenancies and higher turnover. Who's the typical renter profile here, and what's been the actual vacancy rate?
- The area grade is low — what's the realistic commute time and amenity access for the typical tenant pool here? Any planned neighborhood developments (good or bad) we should know about?
- What's the average days-on-market for RENTAL listings here right now (not sales)? A rising rental-DOM trend means longer vacancies and softer asking-rent achievability than the comps imply.
- What's the recent tenant-quality profile in this submarket — average credit score on applications, eviction rate, late-payment / NSF rate, and stable-employment percentage? A property-management company in the area should have these aggregated.
- How much new for-sale + rental construction is in the pipeline within 1–3 miles? Heavy new supply typically softens prices + rents 12–24 months out; constrained supply supports both.
Investment metrics
- 1% rule
- 0.72% ✗
- Cap rate
- 4.46%
- Cash-on-cash
- -6.53%
- DSCR
- 0.71
- GRM
- 11.5
CMA / ARV
- ARV (on-the-fly)
- $265,320
- Comps found
- 12
Show comp detail 12 sales within ~0.75 mi
| Address | Dist | Beds/Ba | Sqft | Sold | Price | $/sf | Match |
|---|---|---|---|---|---|---|---|
| 200 Kings Bridge Rd | 0.15mi | 3/2.0 (-1) | 1,570 (-2%) | 16mo | $299,000 | $190 | 71 |
| 116 Kirk Ln | 0.44mi | 4/2.0 | 1,685 (+5%) | 3mo | $295,000 | $175 | 69 |
| 112 Indian Oaks Dr | 0.22mi | 4/2.0 | 1,732 (+8%) | 12mo | $284,990 | $165 | 67 |
| 1042 Crestline | 0.43mi | 3/2.0 (-1) | 1,725 (+7%) | 3mo | $239,000 | $139 | 60 |
| 1012 Shoreline Dr | 0.39mi | 3/2.0 (-1) | 1,577 (-2%) | 18mo | $340,000 | $216 | 59 |
| 404 Haralson Ln | 0.69mi | 4/2.0 | 1,662 (+3%) | 4mo | $185,000 | $111 | 59 |
| 1000 Shoreline Dr | 0.38mi | 3/2.0 (-1) | 1,730 (+8%) | 12mo | $249,900 | $144 | 54 |
| 720 Shoreline Dr | 0.35mi | 3/2.0 (-1) | 1,504 (-6%) | 18mo | $275,000 | $183 | 53 |
| 912 Oak Hill Dr | 0.37mi | 3/2.0 (-1) | 1,404 (-13%) | 7mo | $225,000 | $160 | 51 |
| 713 Hillburn | 0.25mi | 3/2.0 (-1) | 1,849 (+15%) | 10mo | $269,999 | $146 | 50 |
| 208 Shugar Cir | 0.65mi | 3/2.0 (-1) | 1,426 (-11%) | 9mo | $205,000 | $144 | 38 |
| 800 Lake Country Rd | 0.47mi | 3/2.0 (-1) | 1,797 (+12%) | 19mo | $405,000 | $225 | 38 |
Match score weights: distance 35% · size 25% · config 20% · recency 20%. Top-matched comps best support the ARV.
Projected returns pro-forma
10.0% appreciation · 3.0% rent growth · sell at horizon
- IRR
- 19.7%
- Equity multiple
- 2.60×
- Total profit
- $120,935
- Equity at exit
- $243,237
- IRR
- 18.1%
- Equity multiple
- 5.99×
- Total profit
- $376,907
- Equity at exit
- $524,551
Cash invested: $75,600 (down + closing). Projections, not guarantees.
Landlord ↔ Tenant lean methodology
- Overall (STATE)
- 87 Strongly Landlord-Friendly
- State Texas
- 87 Strongly Landlord-Friendly · R+5
- County
- — inherits STATE
- City
- — inherits STATE
ZIP-level market 75474
- Home prices YoY
- 7.5%
- Active inventory
- 335
- Price-to-rent
- 11.5×
Monthly cashflow live
- Estimated rent
- $1,956 high interval (Pro) →
- Mortgage (P&I)
- −$1,416
- Tax from tax record
- −$428 /mo · $5,140/yr
- Insurance
- −$112
- HOA
- −$0
- Vacancy / Maint / Mgmt
- −$411
- Net cashflow
- $-411
Break-even live
UW: 25.0% down · 7.5% · 30yr · 1.5% tax · 5.0% vac · 8.0% maint · 8.0% mgmt
Financing live
Cash to close
- Down payment
- $67,500
- Closing costs
- $8,100
- Reserves months
- —
- Total cash needed
- —
Loan-product check · same deal, 3 products live
Conventional
25% down · 7.5% · 30yr
- Down + closing
- —
- Monthly P&I
- —
- Monthly cashflow
- —
- DSCR
- —
- Eligible?
- —
Personal DTI + credit; lowest rate.
DSCR
20% down · 8.5% · 30yr
- Down + closing
- —
- Monthly P&I
- —
- Monthly cashflow
- —
- DSCR
- —
- Eligible?
- —
No personal income docs; deal must DSCR.
Hard money
10% down · 12.0% · 12mo
- Down + closing
- —
- Monthly P&I
- —
- Monthly cashflow
- —
- DSCR
- —
- Eligible?
- —
Short-term bridge; refi at stabilization.
Rent comps 6 comps
| Address | Beds | Baths | Sqft | Rent | $/sqft | DOM | Units | Dist |
|---|---|---|---|---|---|---|---|---|
| 200 Dover Dr Unit 1 or 2 West Tawakoni, TX | 3.0 | 2.5 | 1854 | $1,850 | $1.00 | 1d | 1 | 0.01mi |
| 820 Hillside Dr Quinlan, TX | 3.0 | 2.0 | 1410 | $1,800 | $1.28 | 2d | 1 | 0.37mi |
| 206 Perch Dr Quinlan, TX | 3.0 | 2.0 | 1565 | $1,795 | $1.15 | 1d | 1 | 0.63mi |
| 104 Perch Dr Quinlan, TX | 3.0 | 2.5 | 2082 | $1,795 | $0.86 | 1d | 1 | 0.63mi |
| 550 Quail Run Cir Quinlan, TX | 3.0 | 2.0 | 1200 | $1,300 | $1.08 | 15d | 1 | 1.14mi |
| 209 Lewald Ln Quinlan, TX | 3.0 | 2.0 | 1408 | $1,600 | $1.14 | 1d | 1 | 1.40mi |
Listing history 3 events
-
2026-06-18days on market $270,000 Active 2 DOM
-
2026-06-17remarks 699-char remark
-
2026-06-17$270,000 Active 1 DOM
ⓘ Source: listings_history table (triggers on properties + properties_extension) + one-shot
backfill from property_details.listing_events for pre-trigger history.
Tax reassessment forecast TX · Resets to sale price
- Current annual tax
- $5,140 · $428/mo
- Projected year-2 tax
- $5,140 · $428/mo
- Expected delta
- $0/yr ($0/mo · 0.0%)
ⓘ Screening estimate from a state-policy table — verify with the county assessor before closing.
Climate risk First Street
- Flood 1/10 Low FEMA zone X (unshaded) · 0% chance over 30 yrs
- Wildfire 4/10 Moderate
- Heat 7/10 Severe 7 d/yr ≥110°F today · 25 d/yr by 30 yrs out
- Wind 6/10 Major 27% chance of damaging wind over 30 yrs
- Air quality 2/10 Low 0 unhealthy d/yr today · 1 by 30 yrs out
Nearby sold comps map
Loading sold comps map…
Walkable amenities ~0.75 mi
Loading nearby amenities…
Taxation est. · year 1
- Rental income
- $23,474
- − Mortgage interest
- −$15,124
- − Property taxes
- −$5,140
- − Insurance
- −$1,350
- − Repairs & maintenance
- −$1,878
- − Management
- −$1,878
- − Depreciation
- −$7,855
- Taxable loss
- −$9,750
- Est. tax savings @ 24.0%
- +$2,340
- After-tax cash flow
- $-2,596/yr
For passive investors: Depreciation is non-cash, so a rental often shows a tax loss while cash-flowing — sheltering income. Rental losses are passive: they offset passive income freely, and up to $25,000/yr can offset ordinary (W-2) income if you actively participate and your MAGI is under $100k (phasing out to $0 by $150k); unused losses carry forward. On sale, claimed depreciation is recaptured at up to 25%, and gains may owe capital-gains tax (a 1031 exchange can defer both). Figures are a year-1 estimate at your 24.0% rate — not tax advice; consult a CPA.
Schools (NCES district)
- District
- Quinlan ISD
- NCES district ID
- 4836240
- Math proficiency
- 27% ▼ -10.00%
- Reading proficiency
- 34% ▼ -2.00%
- Median HH income
- $45,461
- Composite
- 26.16/100
- National rank
- #7271
- State rank
- #610 of 826 in TX
Livability — West Tawakoni
- Score
- 56/100
- State rank
- #1337
- US rank
- #23022
Category grades
Schools grade is shown separately in the Schools card above.
Census & demographics
- Census place
- West Tawakoni, TX
- County
- Hunt County · 71,969 people
- Metro
- Dallas-Fort Worth-Arlington, TX
- Population (ZIP)
- 17,671
- Household income
- $64,103
- Rent vs Own
- Severe rent burden
- 181.0
Population outlook (Hunt County) Hauer SSP2
- Today (2025)
- 97,090 people
- By 2030
- 100,452 · +3.5%
- By 2040
- 106,544 · +9.7%
- By 2050
- 111,218 · +14.6%
- By 2075
- 121,695 · +25.3%
- By 2100
- 123,683 · +27.4%
Race, ethnicity, and origin ACS 2023
- Neighborhood character
- Predominantly White (74%)
- Race & ethnicity
- White 74% Hispanic / Latino 19% Two or more races 8% Asian 1% Black 1%
- Hispanic origin (detail)
- Mexican 17%
- Common ancestry
- Lithuanian 2% Romanian 2% Iranian 1%
- Foreign-born
- 8% · Canada
- Languages at home
- 88% English-only · Spanish 10% Other Asian/Pacific 1%
Political lean MEDSL · Hunt
- 2024 margin
- Solid R (+55.5) · D 21.9% · R 77.4%
- 2008→2024 swing
- -14.9pp toward R · 2008: -40.6pp · 2024: -55.5pp
- All cycles
- 2024: R+55.5 2020: R+52.5 2016: R+56.3 2012: R+51.2 2008: R+40.6
Not yet ingested
- Civics
- —
Market trends
- HPI YoY
- ▲ 33.95%
- Current HPI
- 484.21
- Rent YoY
- —
- Metro
- Dallas-Fort Worth-Arlington, TX
- State GDP YoY
- ▲ 3.95%
- F500 in state
- 110
Industry mix (Fortune 500 HQ in TX)
| Industry | F500 HQs | Revenue |
|---|---|---|
| Energy | 16 | $1,198B |
|
||
| Technology | 5 | $198B |
|
||
| Engineering / Construction | 4 | $72B |
|
||
| Energy Services | 3 | $60B |
|
||
| Utilities | 3 | $41B |
|
||
| Healthcare | 2 | $330B |
|
||
Price history
-8.5% since first listed7 events — show timeline
- 2026-06-16 Listed $270,000 NTREIS
- 2025-06-15 Rental Removed $2,000 NTREIS
- 2025-06-07 Listed for Rent $2,000 NTREIS
- 2025-04-08 Rental Removed $2,000 NTREIS
- 2025-03-26 Listed for Rent $2,000 NTREIS
- 2025-03-17 Listing Removed — NTREIS
- 2024-09-22 Listed $295,000 NTREIS
Property tax history
+27.5%/yrLatest (2025): $5,140 · +921.2% YoY. Source: county tax records.
Cash-flow waterfall
monthlySold comps — $/sqft
last 12 mo · ≤1 miLoading sold comps…