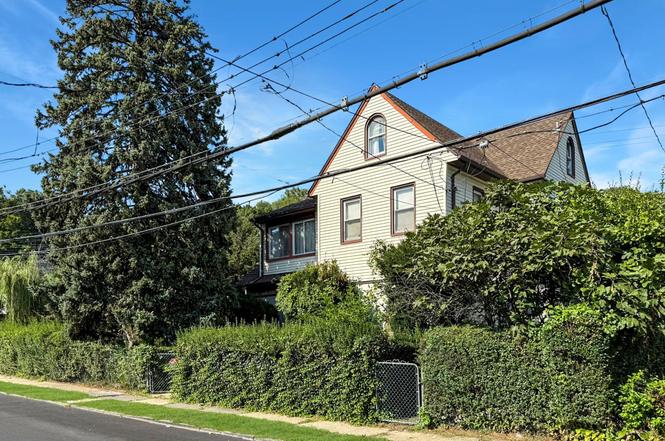
87 Brookside Ave · Mount Vernon, NY
Flood risk 6/10 · Moderate
- FEMA flood zone
- X (unshaded)
- Chance of flooding over 30 yrs
- 0.69%
- Est. flood insurance / yr
- $507 – $1,088
Fire risk 1/10 · Minimal
- Est. fire insurance / yr
- $691 – $1,283
Heat risk 6/10 · Moderate
- Hot days now (above 98°F)
- 7 days/yr
- Hot days in 30 yrs
- 15 days/yr
Wind risk 6/10 · Moderate
- Chance of severe wind over 30 yrs
- 27.0%
Air-quality risk 5/10 · Moderate
- Unhealthy air days now
- 6 days/yr
- Unhealthy air days in 30 yrs
- 8 days/yr
Risk factors via First Street. Map © Google.
Why this score? — see what drove the C grade
The composite is a weighted blend of 9 inputs, each scored 0–100. Each bar is that input's sub-score; the figure is the points it added to the 100-point composite (weight × sub-score).
- Cash flow +18.7/30.0
- ARV discount +15.0/15.0
- 1% rule +6.4/10.0
- DSCR +5.9/10.0
- Schools +3.7/10.0
- Livability +3.6/5.0
- Rent growth +2.5/5.0
- Condition / age +2.5/5.0
- Appreciation +0.0/10.0
$558,000
🖨 Deal sheet 📄 Offer letter ✓ Due diligence
Listing remarks
Nestled in the heart of Mount Vernon, this charming and spacious Colonial offers an incredible opportunity to create your dream home. With a gracious, traditional layout, this home oozes character and is waiting to be transformed into the crown jewel of the neighborhood. The first floor boasts a welcoming formal living room, formal dining room, and a spacious kitchen that flows seamlessly into an enclosed porch – perfect for entertaining or relaxing. Upstairs, you'll find five generously sized bedrooms and a full bath, providing ample space for family living. The finished basement adds additional living space, ideal for a recreation room, home office, or extra storage. Outside, the ho
Key facts
- Full basement
- 7,841 sq ft lot
- 2 garage spots
Tags
Neighborhood map
What this means for you Summary
Snapshot
- This is a 5-bed/1.0-bath single-family listed at $558k.
Deal economics
- At list price, monthly cash flow is $550 ($7k/yr) — positive.
- The deal already cash-flows at list — no discount required.
- Meets the 1% rule at list price ($6k rent vs $558k).
- Recommended offer: $525k (6.0% below list) — sets the bar for market timing.
- Cap rate 7.5% vs local median 5.3% in Mount Vernon — top-decile yield for the area; either an underpriced asset or a hidden risk that comps aren't pricing in. Stress-test before assuming the spread holds.
Location & tenants
- Location reads 71/100 on livability (#397 in NY) — a middle-class / working-renter tenant base. Strengths: commute A+, health & safety A, employment B; Watch: crime D-, cost of living F.
- Mount Vernon School District (suburban): math 35% / reading 50% proficiency, ranked #485 of 590 in NY (top 82%) — families likely to look elsewhere, expect single-tenant / working-renter base with shorter leases; 62% free/reduced lunch — lower-income household profile, screen leases tightly.
- Zoned schools: Mount Vernon Honor Academy (math 22% / reading 52%, grade F, #1,519 of 2,108 statewide, top 74%, 308 students, 58% FRL); Benjamin Turner Middle School (math 8% / reading 32%, grade F, #678 of 729 statewide, top 94%, 196 students, 71% FRL); Mount Vernon High School (math 54% / reading 75%, grade B-, #776 of 1,100 statewide, top 73%, 1,094 students, 76% FRL).
- Market conditions: 47 active listings in the ZIP; 4 comparable units currently listed for rent nearby; rentals leasing fast (median 8d on market — plan ~1-2 weeks tenant-placement turnaround); 954 units permitted in Westchester County in 2024 (649 in 5+ unit buildings).
Forward outlook
- Local home prices are declining (-3.0%/yr); year-one equity from $4k of loan paydown is wiped out by about $17k of value loss. Plan a longer hold.
- Westchester County population projected at +10% by 2050 — modest demand growth; plan on rents tracking national, not racing it.
Negotiation context
- It's been on market 77 days — a 6% lower offer ($525k) is reasonable based on typical stale-listing flexibility.
- 2 sale attempts since 21y ago; this cycle's ask has dropped $62k (10%) from the opening price — seller is motivated, your offer sets the floor, not the list.
Risks & watch-outs
- Watch-outs: property tax is 2.8% of price; built in 1957 — expect roof / HVAC / electrical / plumbing capex.
- Climate carrying-cost: major flood risk; major wind risk, 27% chance of damaging wind over 30y; extreme-heat days projected 7→15/yr by 2055 (HVAC capex compounding) — expect insurance premiums to compound above CPI over the hold.
Questions for the listing agent
- It's been on market 77 days. Have you received any prior offers? Is the seller open to a 6% concession, seller financing, or rate buy-down credit?
- Built in 1957 — when were the roof, HVAC, electrical panel, plumbing, and water heater last replaced?
- Property tax is high relative to price — has the assessment been appealed recently, and will the sale trigger a re-assessment?
- Why hasn't it sold? Are there any deal-killer items the seller is aware of (foundation, flood, title, zoning, code violations)?
- Is there a deadline driving the sale (1031 exchange, divorce, estate, relocation)? That informs how much negotiation room exists.
- Crime grade is D in this area — have there been break-ins, vandalism, or insurance claims at this property in the last 3 years? What carrier currently insures it and at what premium?
- What's the average days-on-market for RENTAL listings here right now (not sales)? A rising rental-DOM trend means longer vacancies and softer asking-rent achievability than the comps imply.
- What's the recent tenant-quality profile in this submarket — average credit score on applications, eviction rate, late-payment / NSF rate, and stable-employment percentage? A property-management company in the area should have these aggregated.
- How much new for-sale + rental construction is in the pipeline within 1–3 miles? Heavy new supply typically softens prices + rents 12–24 months out; constrained supply supports both.
Investment metrics
- 1% rule
- 1.14% ✓
- Cap rate
- 7.48%
- Cash-on-cash
- 4.23%
- DSCR
- 1.19
- GRM
- 7.3
CMA / ARV
- ARV (on-the-fly)
- $874,389
- Comps found
- 12
Show comp detail 12 sales within ~0.75 mi
| Address | Dist | Beds/Ba | Sqft | Sold | Price | $/sf | Match |
|---|---|---|---|---|---|---|---|
| 362 Nuber Ave | 0.52mi | 5/2.0 | 2,286 (+0%) | 3mo | $725,000 | $317 | 69 |
| 315 Seneca Ave | 0.51mi | 5/3.5 | 2,200 (-4%) | 1mo | $840,000 | $382 | 59 |
| 141 Beechwood Ave | 0.15mi | 4/2.5 (-1) | 2,000 (-12%) | 6mo | $780,000 | $390 | 56 |
| 425 Washington Ave | 0.73mi | 5/3.0 | 2,266 (-1%) | 3mo | $1,605,000 | $708 | 54 |
| 431 E Sidney Ave | 0.36mi | 5/3.0 | 2,000 (-12%) | 2mo | $620,000 | $310 | 53 |
| 415 E Prospect Ave | 0.30mi | 4/3.0 (-1) | 2,500 (+10%) | 6mo | $475,000 | $190 | 52 |
| 332 Tecumseh Ave | 0.51mi | 5/2.5 | 2,500 (+10%) | 2mo | $750,000 | $300 | 52 |
| 410 Third Ave | 0.71mi | 4/2.5 (-1) | 2,159 (-5%) | 2mo | $1,580,000 | $732 | 46 |
| 222 E 4th St | 0.55mi | 4/4.0 (-1) | 2,165 (-5%) | 4mo | $685,000 | $316 | 45 |
| 349 Hawthorne Ter | 0.70mi | 4/2.5 (-1) | 2,080 (-9%) | 2mo | $830,000 | $399 | 40 |
| 339 Tecumseh Ave | 0.51mi | 6/4.5 (+1) | 2,000 (-12%) | 4mo | $765,000 | $383 | 34 |
| 418 Third Ave | 0.73mi | 4/3.0 (-1) | 2,550 (+12%) | 6mo | $1,567,500 | $615 | 28 |
Match score weights: distance 35% · size 25% · config 20% · recency 20%. Top-matched comps best support the ARV.
Projected returns pro-forma
-3.0% appreciation · 3.0% rent growth · sell at horizon
- IRR
- -9.6%
- Equity multiple
- 0.65×
- Total profit
- $-54,897
- Equity at exit
- $83,200
- IRR
- -0.1%
- Equity multiple
- 1.00×
- Total profit
- $-736
- Equity at exit
- $48,246
Cash invested: $156,240 (down + closing). Projections, not guarantees.
Landlord ↔ Tenant lean methodology
- Overall (STATE)
- 15 Strongly Tenant-Friendly
- State New York
- 15 Strongly Tenant-Friendly · D+10
- County
- — inherits STATE
- City
- — inherits STATE
ZIP-level market 10553
- Active inventory
- 47
- Price-to-rent
- 7.3×
Monthly cashflow live
- Estimated rent
- $6,365 medium interval (Pro) →
- Mortgage (P&I)
- −$2,926
- Tax from tax record
- −$1,319 /mo · $15,829/yr
- Insurance
- −$232
- HOA
- −$0
- Vacancy / Maint / Mgmt
- −$1,337
- Net cashflow
- $550
Break-even live
UW: 25.0% down · 7.5% · 30yr · 1.5% tax · 5.0% vac · 8.0% maint · 8.0% mgmt
Financing live
Cash to close
- Down payment
- $139,500
- Closing costs
- $16,740
- Reserves months
- —
- Total cash needed
- —
Loan-product check · same deal, 3 products live
Conventional
25% down · 7.5% · 30yr
- Down + closing
- —
- Monthly P&I
- —
- Monthly cashflow
- —
- DSCR
- —
- Eligible?
- —
Personal DTI + credit; lowest rate.
DSCR
20% down · 8.5% · 30yr
- Down + closing
- —
- Monthly P&I
- —
- Monthly cashflow
- —
- DSCR
- —
- Eligible?
- —
No personal income docs; deal must DSCR.
Hard money
10% down · 12.0% · 12mo
- Down + closing
- —
- Monthly P&I
- —
- Monthly cashflow
- —
- DSCR
- —
- Eligible?
- —
Short-term bridge; refi at stabilization.
Rent comps 4 comps
| Address | Beds | Baths | Sqft | Rent | $/sqft | DOM | Units | Dist |
|---|---|---|---|---|---|---|---|---|
| 222 Lorraine Ave Mount Vernon, NY | 4.0 | 1.5 | 1948 | $5,500 | $2.82 | 7d | 1 | 0.49mi |
| 222 Primrose Ave Unit 2 Mt Vernon, NY | 5.0 | 2.0 | 1900 | $5,250 | $2.76 | 19d | 1 | 0.94mi |
| 641 S 5th Ave Unit 2nd/3rd Floor Mt Vernon, NY | 5.0 | 2.0 | 1800 | $3,900 | $2.17 | 4d | 1 | 1.26mi |
| 15 Hillside Rd Bronxville, NY | 5.0 | 3.5 | 2750 | $13,500 | $4.91 | 2d | 1 | 1.46mi |
Listing history 6 events
-
2025-11-25status Pending
-
2025-11-14price $558,000
-
2025-10-09price $589,000
-
2025-09-08$620,000 Active
-
2005-09-11historical
-
2005-05-11
ⓘ Source: listings_history table (triggers on properties + properties_extension) + one-shot
backfill from property_details.listing_events for pre-trigger history.
Tax reassessment forecast NY · Partial reset (capped growth)
- Current annual tax
- $15,829 · $1,319/mo
- Projected year-2 tax
- $15,829 · $1,319/mo
- Expected delta
- $0/yr ($0/mo · 0.0%)
ⓘ Screening estimate from a state-policy table — verify with the county assessor before closing.
Climate risk First Street
- Flood 6/10 Major FEMA zone X (unshaded) · 69% chance over 30 yrs
- Wildfire 1/10 Low
- Heat 6/10 Major 7 d/yr ≥98°F today · 15 d/yr by 30 yrs out
- Wind 6/10 Major 27% chance of damaging wind over 30 yrs
- Air quality 5/10 Major 6 unhealthy d/yr today · 8 by 30 yrs out
Nearby sold comps map
Loading sold comps map…
Walkable amenities ~0.75 mi
Loading nearby amenities…
Taxation est. · year 1
- Rental income
- $76,375
- − Mortgage interest
- −$31,257
- − Property taxes
- −$15,829
- − Insurance
- −$2,790
- − Repairs & maintenance
- −$6,110
- − Management
- −$6,110
- − Depreciation
- −$16,233
- Taxable loss
- −$1,953
- Est. tax savings @ 24.0%
- +$469
- After-tax cash flow
- $7,072/yr
For passive investors: Depreciation is non-cash, so a rental often shows a tax loss while cash-flowing — sheltering income. Rental losses are passive: they offset passive income freely, and up to $25,000/yr can offset ordinary (W-2) income if you actively participate and your MAGI is under $100k (phasing out to $0 by $150k); unused losses carry forward. On sale, claimed depreciation is recaptured at up to 25%, and gains may owe capital-gains tax (a 1031 exchange can defer both). Figures are a year-1 estimate at your 24.0% rate — not tax advice; consult a CPA.
Schools (NCES district)
- District
- Mount Vernon School District
- NCES district ID
- 3620100
- Math proficiency
- 35% ▼ -3.00%
- Reading proficiency
- 50% ▲ 6.00%
- Median HH income
- $50,890
- Composite
- 36.59/100
- National rank
- #4631
- State rank
- #485 of 590 in NY
Livability — Mount Vernon
- Score
- 71/100
- State rank
- #397
- US rank
- #6876
Category grades
Schools grade is shown separately in the Schools card above.
Census & demographics
- Census place
- Mount Vernon, NY
- City population
- 61,313
- Population (ZIP)
- 10,815
Population outlook (Westchester County) Hauer SSP2
- Today (2025)
- 1,028,035 people
- By 2030
- 1,051,636 · +2.3%
- By 2040
- 1,098,520 · +6.9%
- By 2050
- 1,136,044 · +10.5%
- By 2075
- 1,196,925 · +16.4%
- By 2100
- 1,175,147 · +14.3%
Race, ethnicity, and origin ACS 2023
- Neighborhood character
- Predominantly Black (67%)
- Race & ethnicity
- Black 67% Hispanic / Latino 15% White 12% Two or more races 8%
- Hispanic origin (detail)
- Puerto Rican 6% Dominican 3%
- Common ancestry
- Russian 7% Lithuanian 1% Romanian 1%
- Foreign-born
- 35% · Canada, Jamaica, Mexico
- Languages at home
- 76% English-only · Spanish 11% Other Indo-European 6% German/W. Germanic 1%
Political lean MEDSL · Westchester
- 2024 margin
- Strong D (+26.3) · D 63.1% · R 36.9%
- 2008→2024 swing
- -1.3pp toward R · 2008: 27.6pp · 2024: 26.3pp
- All cycles
- 2024: D+26.3 2020: D+36.3 2016: D+32.8 2012: D+22.2 2008: D+27.6
Not yet ingested
- Civics
- —
Market trends
- HPI YoY
- ▼ -114.74%
- Current HPI
- 206.233
- Rent YoY
- —
- Metro
- —
- State GDP YoY
- ▲ 2.60%
- F500 in state
- 92
Industry mix (Fortune 500 HQ in NY)
| Industry | F500 HQs | Revenue |
|---|---|---|
| Financial Services | 10 | $950B |
|
||
| Consumer Goods | 9 | $162B |
|
||
| Insurance | 4 | $225B |
|
||
| Telecommunications | 2 | $144B |
|
||
| Pharmaceuticals | 2 | $112B |
|
||
| Media / Entertainment | 2 | $69B |
|
||
Price history
-10.0% since first listed6 events — show timeline
- 2025-11-25 Pending — OneKey® MLS as Distributed by MLS Grid
- 2025-11-14 Price Changed $558,000 OneKey® MLS as Distributed by MLS Grid
- 2025-10-09 Price Changed $589,000 OneKey® MLS as Distributed by MLS Grid
- 2025-09-08 Listed $620,000 OneKey® MLS as Distributed by MLS Grid
- 2005-09-11 Delisted — HGMLS
- 2005-05-11 Listed — HGMLS
Property tax history
+34.3%/yrLatest (2025): $15,829 · +2.1% YoY. Source: county tax records.
Cash-flow waterfall
monthlySold comps — $/sqft
last 12 mo · ≤1 miLoading sold comps…