318 Breezy Pointe Loop · McGregor, IA
Flood risk 1/10 · Minimal
- FEMA flood zone
- X (unshaded)
- Chance of flooding over 30 yrs
- 0.0%
- Est. flood insurance / yr
- $507 – $1,088
Fire risk 1/10 · Minimal
- Est. fire insurance / yr
- $902 – $1,676
Heat risk 2/10 · Minimal
- Hot days now (above 103°F)
- 7 days/yr
- Hot days in 30 yrs
- 15 days/yr
Wind risk 2/10 · Minimal
- Chance of severe wind over 30 yrs
- —
Air-quality risk 1/10 · Minimal
- Unhealthy air days now
- 0 days/yr
- Unhealthy air days in 30 yrs
- 0 days/yr
Risk factors via First Street. Map © Google.
Why this score? — see what drove the C- grade
The composite is a weighted blend of 9 inputs, each scored 0–100. Each bar is that input's sub-score; the figure is the points it added to the 100-point composite (weight × sub-score).
- Cash flow +16.6/30.0
- ARV discount +7.5/15.0
- Schools +5.5/10.0
- DSCR +5.1/10.0
- Appreciation +5.0/10.0
- 1% rule +3.8/10.0
- Livability +3.7/5.0
- Rent growth +2.5/5.0
- Condition / age +2.5/5.0
$129,000
🖨 Deal sheet (PDF) 📄 Offer letter ✓ Due diligence
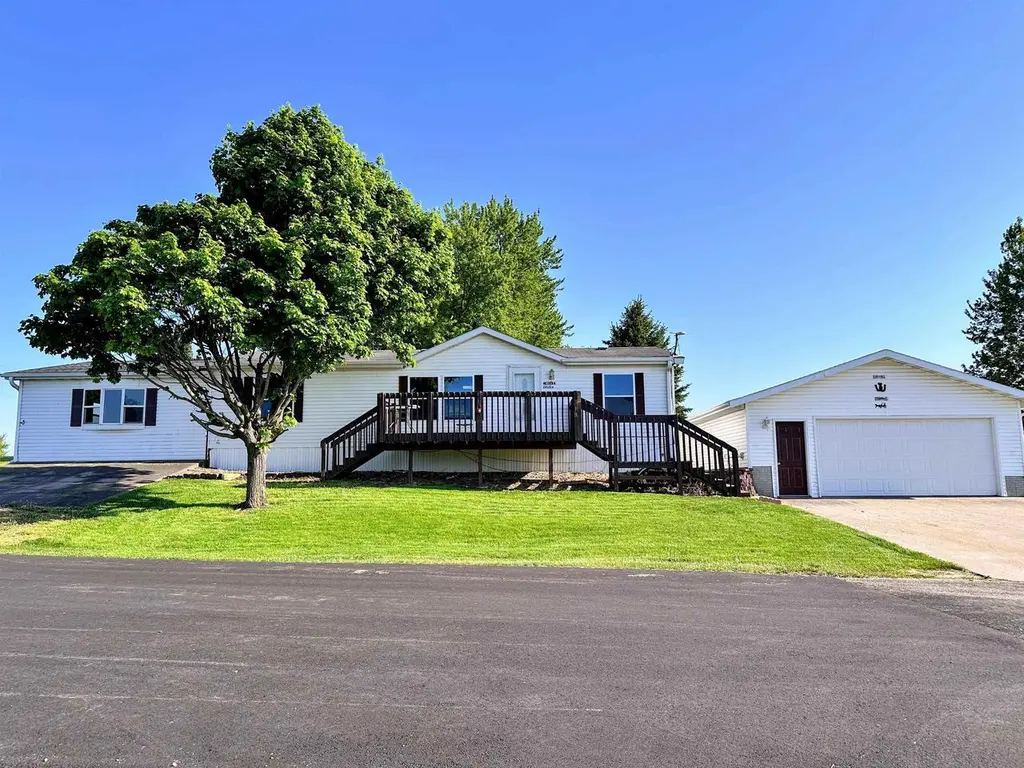
Listing remarks
3 bedroom ranch home with lots of extra space ready for you to move in! This open concept ranch level home is available for immediate possession. Roomy 2 stall insulated garage in addition to the corner lot and large "great room" this property has to offer. A spacious yard with a yard shed in addition to the large garage. Back up Generac generator is a perk you get along with all appliances included, including washer and dryer. Located in the tranquil subdivision of Breezy Point, there is a $500 a year HOA fee. The original garage has been finished off for a huge family room with large closet you have to see to believe. You'll be hosting family Christmas with this room and birthda
Key facts
- Open concept ranch
- Spacious yard
- Yard shed
Tags
Property features AI
Finance
- Other: Lot size approximately 0.28 acre; Located in the city of McGregor
Exterior
- Parking: Detached 2-car garage with opener
- Utilities: Municipal water; Municipal sewer; LP gas
- Home design: Single-family property; One-story main living (no basement/slab foundation); Zoned R
- Construction: Estimated 1,501–1,750 finished square feet (approximately 1,674 above grade)
- Exterior features: Deck; Vinyl exterior
Interior
- Kitchen: Pantry; Kitchen island; Range/oven; Refrigerator; Dishwasher; Microwave
- Bedrooms: Master bedroom on the main level (approx. 13 x 13); Second bedroom on the main level (approx. 13 x 8); Third bedroom on the main level (approx. 10 x 8)
- Bathrooms: Two full bathrooms; Master bathroom with walk-in shower and full bath/tub configuration
- Heating & cooling: Forced air heating (LP gas); Central air conditioning
- Interior features: Walk-in closets; Great room; Cathedral/vaulted ceilings; Skylights
- Laundry & utility: Washer and dryer included; Generator included
Neighborhood map
What this means for you Summary
Snapshot
- This is a 3-bed/2.5-bath manufactured listed at $129k.
Deal economics
- At list price, monthly cash flow is $77 ($929/yr) — positive.
- The deal already cash-flows at list — no discount required.
- To meet the 1% rule (rent ≥ 1% of price), the offer needs to be $113k (12.3% below list).
- Recommended offer: $113k (12.3% below list) — sets the bar for 1% rule.
Location & tenants
- Location reads 73/100 on livability (#279 in IA) — a middle-class / working-renter tenant base. Strengths: cost of living A+, housing A+, health & safety A+; Watch: employment D, amenities F, commute F.
- Mfl Marmac Community School District (rural): math 62% / reading 68% proficiency, ranked #198 of 289 in IA (top 68%) — acceptable for families but not a draw, mixed tenant base, ~2y average lease.
- Market conditions: 31 active listings in the ZIP; 48 units permitted in Clayton County in 2024 (0 in 5+ unit buildings).
Forward outlook
- In year one you build about $5k of equity ($892 loan paydown + $4k appreciation (3.0% local appreciation)).
- Clayton County population projected at -21% by 2050 — secular population decline; favor cash flow + early exit over multi-decade hold.
- At projected returns (3.0% appreciation + 3.0% rent growth), your $36k cash investment doubles in ~6 years — after that, you're playing with house money.
- By year 7, paydown + projected appreciation supports a ~$30k cash-out refi (75% LTV) — recoverable capital for the next deal without selling this one.
Negotiation context
- Only 3 days on market — expect competitive offers; lowballing is unlikely to land.
Questions for the listing agent
- Is there a deadline driving the sale (1031 exchange, divorce, estate, relocation)? That informs how much negotiation room exists.
- Schools are B-rated — typically a magnet for longer-tenancy family renters. What's the average tenant stay here, and is there a school-zone premium baked into asking?
- What's the average days-on-market for RENTAL listings here right now (not sales)? A rising rental-DOM trend means longer vacancies and softer asking-rent achievability than the comps imply.
- What's the recent tenant-quality profile in this submarket — average credit score on applications, eviction rate, late-payment / NSF rate, and stable-employment percentage? A property-management company in the area should have these aggregated.
- How much new for-sale + rental construction is in the pipeline within 1–3 miles? Heavy new supply typically softens prices + rents 12–24 months out; constrained supply supports both.
Investment metrics
- 1% rule
- 0.88% ✗
- Cap rate
- 7.01%
- Cash-on-cash
- 2.57%
- DSCR
- 1.11
- GRM
- 9.5
CMA / ARV
No comps found within radius.
Projected returns pro-forma
3.0% appreciation · 3.0% rent growth · sell at horizon
- IRR
- 9.9%
- Equity multiple
- 1.57×
- Total profit
- $20,443
- Equity at exit
- $58,004
- IRR
- 12.2%
- Equity multiple
- 2.82×
- Total profit
- $65,843
- Equity at exit
- $89,391
Cash invested: $36,120 (down + closing). Projections, not guarantees.
Landlord ↔ Tenant lean methodology
- Overall (STATE)
- 83 Strongly Landlord-Friendly
- State Iowa
- 83 Strongly Landlord-Friendly · R+6
- County
- — inherits STATE
- City
- — inherits STATE
ZIP-level market 52157
- Active inventory
- 31
- Price-to-rent
- 9.5×
Monthly cashflow live
- Estimated rent
- $1,131 medium interval (Pro) →
- Mortgage (P&I)
- −$676
- Tax from tax record
- −$86 /mo · $1,032/yr
- Insurance
- −$54
- HOA
- −$0
- Vacancy / Maint / Mgmt
- −$238
- Net cashflow
- $77
Break-even live
Sensitivity live
| Price | -10% $150 | -5% $114 | +0% $77 | +5% $41 | +10% $4 |
|---|---|---|---|---|---|
| Rent | -10% $-12 | -5% $33 | +0% $77 | +5% $122 | +10% $167 |
| Rate | -1.0pp $142 | -0.5pp $110 | base $77 | +0.5pp $44 | +1.0pp $10 |
UW: 25.0% down · 7.5% · 30yr · 1.5% tax · 5.0% vac · 8.0% maint · 8.0% mgmt
Financing live
Cash to close
- Down payment
- $32,250
- Closing costs
- $3,870
- Reserves months
- —
- Total cash needed
- —
Loan-product check · same deal, 3 products live
Conventional
25% down · 7.5% · 30yr
- Down + closing
- —
- Monthly P&I
- —
- Monthly cashflow
- —
- DSCR
- —
- Eligible?
- —
Personal DTI + credit; lowest rate.
DSCR
20% down · 8.5% · 30yr
- Down + closing
- —
- Monthly P&I
- —
- Monthly cashflow
- —
- DSCR
- —
- Eligible?
- —
No personal income docs; deal must DSCR.
Hard money
10% down · 12.0% · 12mo
- Down + closing
- —
- Monthly P&I
- —
- Monthly cashflow
- —
- DSCR
- —
- Eligible?
- —
Short-term bridge; refi at stabilization.
Listing history 3 events
-
2026-05-22status Pending
-
2026-05-18$129,000 Active
-
2020-12-28soldstatus $202,000
ⓘ Source: listings_history table (triggers on properties + properties_extension) + one-shot
backfill from property_details.listing_events for pre-trigger history.
Tax reassessment forecast IA · Partial reset (capped growth)
- Current annual tax
- $1,032 · $86/mo
- Projected year-2 tax
- $1,529 · $127/mo
- Expected delta
- +$497/yr (+$41/mo · 48.1%)
ⓘ Screening estimate from a state-policy table — verify with the county assessor before closing.
Climate risk First Street
- Flood 1/10 Low FEMA zone X (unshaded) · 0% chance over 30 yrs
- Wildfire 1/10 Low
- Heat 2/10 Low 7 d/yr ≥103°F today · 15 d/yr by 30 yrs out
- Wind 2/10 Low
- Air quality 1/10 Low 0 unhealthy d/yr today · 0 by 30 yrs out
Nearby sold comps map
Loading sold comps map…
Walkable amenities ~0.75 mi
Loading nearby amenities…
Taxation est. · year 1
- Rental income
- $13,575
- − Mortgage interest
- −$7,226
- − Property taxes
- −$1,032
- − Insurance
- −$645
- − Repairs & maintenance
- −$1,086
- − Management
- −$1,086
- − Depreciation
- −$3,753
- Taxable loss
- −$1,253
- Est. tax savings @ 24.0%
- +$301
- After-tax cash flow
- $1,230/yr
For passive investors: Depreciation is non-cash, so a rental often shows a tax loss while cash-flowing — sheltering income. Rental losses are passive: they offset passive income freely, and up to $25,000/yr can offset ordinary (W-2) income if you actively participate and your MAGI is under $100k (phasing out to $0 by $150k); unused losses carry forward. On sale, claimed depreciation is recaptured at up to 25%, and gains may owe capital-gains tax (a 1031 exchange can defer both). Figures are a year-1 estimate at your 24.0% rate — not tax advice; consult a CPA.
Schools (NCES district)
- District
- Mfl Marmac Community School District
- NCES district ID
- 1918120
- Math proficiency
- 62% ▼ -2.00%
- Reading proficiency
- 68% ▼ -3.00%
- Median HH income
- $47,395
- Composite
- 54.95/100
- National rank
- #1305
- State rank
- #198 of 289 in IA
Livability — McGregor
- Score
- 73/100
- State rank
- #279
- US rank
- #5387
Category grades
Schools grade is shown separately in the Schools card above.
Census & demographics
- Population (ZIP)
- 1,379
Population outlook (Clayton County) Hauer SSP2
- Today (2025)
- 16,656 people
- By 2030
- 15,986 · -4.0%
- By 2040
- 14,554 · -12.6%
- By 2050
- 13,187 · -20.8%
- By 2075
- 11,131 · -33.2%
- By 2100
- 9,733 · -41.6%
Race, ethnicity, and origin ACS 2023
- Neighborhood character
- Predominantly White (99%)
- Race & ethnicity
- White 99% Two or more races 1%
- Common ancestry
- Portuguese 11% Lithuanian 1% Iranian 1%
- Foreign-born
- 0%
- Languages at home
- 95% English-only · Spanish 4% French/Haitian/Cajun 1%
Political lean MEDSL · Clayton
- 2024 margin
- Solid R (+34.5) · D 32.2% · R 66.7% · Other 1.2%
- 2008→2024 swing
- -51.7pp toward R · 2008: 17.2pp · 2024: -34.5pp
- All cycles
- 2024: R+34.5 2020: R+28.8 2016: R+22.8 2012: D+6.9 2008: D+17.2
Not yet ingested
- Civics
- —
Market trends
- HPI YoY
- —
- Current HPI
- —
- Rent YoY
- —
- Metro
- —
- State GDP YoY
- ▲ 2.48%
- F500 in state
- 4
Industry mix (Fortune 500 HQ in IA)
| Industry | F500 HQs | Revenue |
|---|---|---|
| Financial Services | 1 | $16B |
|
||
| Retail / Convenience | 1 | $15B |
|
||
Price history
-36.1% since first listed3 events — show timeline
- 2026-05-22 Pending — SCWMLS
- 2026-05-18 Listed $129,000 SCWMLS
- 2020-12-28 Sold (Public Records) $202,000 Public Records
Property tax history
-0.6%/yrLatest (2025): $1,032 · +5.1% YoY. Source: county tax records.
Cash-flow waterfall
monthlySold comps — $/sqft
last 12 mo · ≤1 miLoading sold comps…