 Multi-family
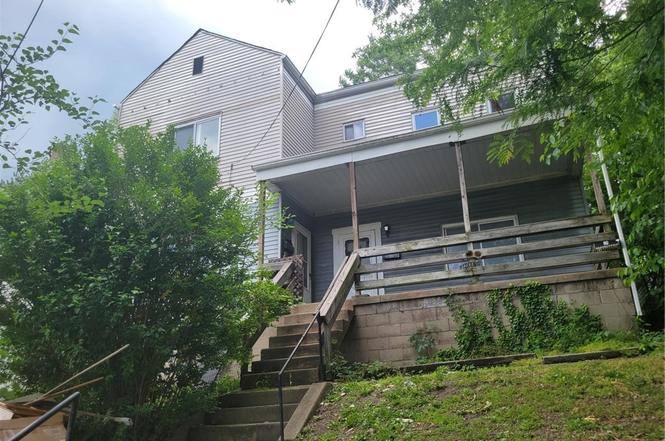
30 S Starr Ave · Avalon, PA
Flood risk 1/10 · Minimal
- FEMA flood zone
- X (unshaded)
- Chance of flooding over 30 yrs
- 0.0%
- Est. flood insurance / yr
- $473 – $860
Fire risk 1/10 · Minimal
- Est. fire insurance / yr
- $511 – $949
Heat risk 4/10 · Minor
- Hot days now (above 99°F)
- 7 days/yr
- Hot days in 30 yrs
- 18 days/yr
Wind risk 2/10 · Minimal
- Chance of severe wind over 30 yrs
- —
Air-quality risk 3/10 · Minor
- Unhealthy air days now
- 3 days/yr
- Unhealthy air days in 30 yrs
- 3 days/yr
Risk factors via First Street. Map © Google.
Why this score? — see what drove the B grade
The composite is a weighted blend of 9 inputs, each scored 0–100. Each bar is that input's sub-score; the figure is the points it added to the 100-point composite (weight × sub-score).
- Cash flow +30.0/30.0
- 1% rule +10.0/10.0
- DSCR +10.0/10.0
- ARV discount +7.5/15.0
- Livability +4.3/5.0
- Rent growth +3.8/5.0
- Schools +3.4/10.0
- Condition / age +2.5/5.0
- Appreciation +0.0/10.0
$99,000
🖨 Deal sheet 📄 Offer letter ✓ Due diligence
Multi-family units
County records classify this as Multi-Family (2-4 Unit). Listing-text estimate: 1 unit. estimate disagrees with records
Listing remarks MLS
EXCELLENT INVESTMENT OPPORTUNITY at a BARGAIN PRICE!!! Needs some cosmetics. All utilities have been separated. New electrical boxes & service line. New Plex Plumbing. New water meters-separated. Separate furnaces & hot water tanks. Updated kitchens & baths. Stove & Refrigerator included in each unit. Walking distance to Shopping & Public Transportation.
Key facts
- Eat in kitchen
- Nice front porch
- 5,410 sq ft lot
Tags
Property features AI
Finance
- Financial info: Two rental units with estimated rent of about $1,000 per unit
Exterior
- Parking: On-street parking
- Utilities: Electricity available; Natural gas available; Public sewer; Public water
- Home design: Zoned for 2-family
- Exterior features: Public transportation access
Interior
- Bedrooms: Each unit has 1 bedroom
- Bathrooms: Each unit has 1 full bathroom
- Interior features: Two-unit property (multifamily)
Neighborhood map
What this means for you Summary
Snapshot
- This is a 4-bed/2.0-bath multifamily listed at $99k.
Deal economics
- At list price, monthly cash flow is $1k ($17k/yr) — positive.
- The deal already cash-flows at list — no discount required.
- Meets the 1% rule at list price ($3k rent vs $99k).
- Cap rate 23.3% vs local median 5.2% in Avalon — top-decile yield for the area; either an underpriced asset or a hidden risk that comps aren't pricing in. Stress-test before assuming the spread holds.
Location & tenants
- Location reads 86/100 on livability (#63 in PA, #439 nationally) — a professional / high-income tenant draw. Strengths: crime A+, commute A+, cost of living A+; Watch: amenities C-.
- Northgate SD (suburban): math 25% / reading 57% proficiency, ranked #354 of 539 in PA (top 66%) — families likely to look elsewhere, expect single-tenant / working-renter base with shorter leases.
- Market conditions: Rents rising fast (+5.2%/yr); 80 active listings in the ZIP; 5 comparable units currently listed for rent nearby; rentals lingering (median 44d on market — plan ~5-8 weeks vacancy on turnover, expect pricing pressure); 60% of comp listings sitting > 30 days — soft ceiling on asking rent; 2,996 units permitted in Allegheny County in 2024 (1,588 in 5+ unit buildings).
- At $2,710/mo this rent would consume 48% of the median local household income ($68k/yr) (locally 952% of renters already pay >50% of income on rent) — very limited rent-growth headroom before tenants either downsize or default.
Forward outlook
- Local home prices are declining (-3.0%/yr); year-one equity from $684 of loan paydown is wiped out by about $3k of value loss. Plan a longer hold.
- At projected returns (-3.0% appreciation + 5.2% rent growth), your $28k cash investment doubles in ~2 years — after that, you're playing with house money.
Negotiation context
- Only 1 days on market — expect competitive offers; lowballing is unlikely to land.
- 7 sale attempts since 24y ago with the ask held roughly flat each time — persistent listings suggest the price (not the market) is what's stuck; bring a comps-based counter.
- Current owner paid $50k; list at $99k implies a 98% gain — meaningful room to come down on a strong offer.
Risks & watch-outs
- Watch-outs: built in 1930 — expect roof / HVAC / electrical / plumbing capex.
Questions for the listing agent
- Built in 1930 — when were the roof, HVAC, electrical panel, plumbing, and water heater last replaced?
- Is there a deadline driving the sale (1031 exchange, divorce, estate, relocation)? That informs how much negotiation room exists.
- What's the average days-on-market for RENTAL listings here right now (not sales)? A rising rental-DOM trend means longer vacancies and softer asking-rent achievability than the comps imply.
- What's the recent tenant-quality profile in this submarket — average credit score on applications, eviction rate, late-payment / NSF rate, and stable-employment percentage? A property-management company in the area should have these aggregated.
- How much new apartment / multifamily construction is in the pipeline within 1–3 miles? Heavy new supply (>2% of stock underway) typically softens rents 12–24 months out; light construction supports rent growth.
Investment metrics
- 1% rule
- 2.74% ✓
- Cap rate
- 23.32%
- Cash-on-cash
- 60.81%
- DSCR
- 3.71
- GRM
- 3.0
CMA / ARV
No comps found within radius.
Projected returns pro-forma
-3.0% appreciation · 5.16% rent growth · sell at horizon
- IRR
- 62.1%
- Equity multiple
- 3.87×
- Total profit
- $79,516
- Equity at exit
- $14,761
- IRR
- 67.4%
- Equity multiple
- 8.60×
- Total profit
- $210,546
- Equity at exit
- $8,560
Cash invested: $27,720 (down + closing). Projections, not guarantees.
Landlord ↔ Tenant lean methodology
- Overall (STATE)
- 62 Landlord-Friendly
- State Pennsylvania
- 62 Landlord-Friendly · EVEN
- County
- — inherits STATE
- City
- — inherits STATE
ZIP-level market 15202
- Home prices YoY
- -30.2%
- Rents YoY
- 5.2%
- Active inventory
- 80
- Price-to-rent
- 9.1×
Monthly cashflow live
- Estimated rent
- $2,710 high interval (Pro) →
- Mortgage (P&I)
- −$519
- Tax from tax record
- −$176 /mo · $2,109/yr
- Insurance
- −$41
- HOA
- −$0
- Vacancy / Maint / Mgmt
- −$569
- Net cashflow
- $1,405
Break-even live
3-unit breakdown (identical units grouped — click to expand)
| Units | Beds | Baths | Est. rent |
|---|---|---|---|
| 3× units | 1 | 1 | $2,709 |
| #1 | 1 | 1 | $903 |
| #2 | 1 | 1 | $903 |
| #3 | 1 | 1 | $903 |
| Total (3 units) | $2,710 | ||
UW: 25.0% down · 7.5% · 30yr · 1.5% tax · 5.0% vac · 8.0% maint · 8.0% mgmt
Financing live
Cash to close
- Down payment
- $24,750
- Closing costs
- $2,970
- Reserves months
- —
- Total cash needed
- —
Loan-product check · same deal, 3 products live
Conventional
25% down · 7.5% · 30yr
- Down + closing
- —
- Monthly P&I
- —
- Monthly cashflow
- —
- DSCR
- —
- Eligible?
- —
Personal DTI + credit; lowest rate.
DSCR
20% down · 8.5% · 30yr
- Down + closing
- —
- Monthly P&I
- —
- Monthly cashflow
- —
- DSCR
- —
- Eligible?
- —
No personal income docs; deal must DSCR.
Hard money
10% down · 12.0% · 12mo
- Down + closing
- —
- Monthly P&I
- —
- Monthly cashflow
- —
- DSCR
- —
- Eligible?
- —
Short-term bridge; refi at stabilization.
Rent comps 5 comps
| Address | Beds | Baths | Sqft | Rent | $/sqft | DOM | Units | Dist |
|---|---|---|---|---|---|---|---|---|
| 713 Clinton Pl Pittsburgh, PA | 4.0 | 2.0 | 1760 | $2,750 | $1.56 | 1d | 1 | 0.13mi |
| 115 Meade Ave Pittsburgh, PA | 4.0 | 1.0 | 1392 | $1,600 | $1.15 | 43d | 1 | 0.26mi |
| 555 Orchard Ave Bellevue, PA | 3.0 | 1.0 | 1400 | $1,295 | $0.93 | 43d | 1 | 0.37mi |
| 189 N Balph Ave Pittsburgh, PA | 3.0 | 1.0 | 1550 | $1,850 | $1.19 | 43d | 1 | 0.53mi |
| 421 N Ohio St Pittsburgh, PA | 3.0 | 2.0 | 1747 | $2,700 | $1.55 | 1d | 1 | 0.72mi |
Listing history 2 events
-
2026-06-17remarks 699-char remark
-
2026-06-17$99,000 Active 1 DOM
ⓘ Source: listings_history table (triggers on properties + properties_extension) + one-shot
backfill from property_details.listing_events for pre-trigger history.
Tax reassessment forecast PA · Partial reset (capped growth)
- Current annual tax
- $2,109 · $176/mo
- Projected year-2 tax
- $2,109 · $176/mo
- Expected delta
- $0/yr ($0/mo · 0.0%)
ⓘ Screening estimate from a state-policy table — verify with the county assessor before closing.
Climate risk First Street
- Flood 1/10 Low FEMA zone X (unshaded) · 0% chance over 30 yrs
- Wildfire 1/10 Low
- Heat 4/10 Moderate 7 d/yr ≥99°F today · 18 d/yr by 30 yrs out
- Wind 2/10 Low
- Air quality 3/10 Moderate 3 unhealthy d/yr today · 3 by 30 yrs out
Nearby sold comps map
Loading sold comps map…
Walkable amenities ~0.75 mi
Loading nearby amenities…
Taxation est. · year 1
- Rental income
- $32,520
- − Mortgage interest
- −$5,546
- − Property taxes
- −$2,109
- − Insurance
- −$495
- − Repairs & maintenance
- −$2,602
- − Management
- −$2,602
- − Depreciation
- −$2,880
- Taxable income
- $16,287
- Est. tax owed @ 24.0%
- −$3,909
- After-tax cash flow
- $12,948/yr
For passive investors: Depreciation is non-cash, so a rental often shows a tax loss while cash-flowing — sheltering income. Rental losses are passive: they offset passive income freely, and up to $25,000/yr can offset ordinary (W-2) income if you actively participate and your MAGI is under $100k (phasing out to $0 by $150k); unused losses carry forward. On sale, claimed depreciation is recaptured at up to 25%, and gains may owe capital-gains tax (a 1031 exchange can defer both). Figures are a year-1 estimate at your 24.0% rate — not tax advice; consult a CPA.
Schools (NCES district)
- District
- Northgate SD
- NCES district ID
- 4217770
- Math proficiency
- 25% ▼ -12.00%
- Reading proficiency
- 57% ▼ -5.00%
- Median HH income
- $39,084
- Composite
- 34.15/100
- National rank
- #5279
- State rank
- #354 of 539 in PA
Livability — Avalon
- Score
- 86/100
- State rank
- #63
- US rank
- #439
Category grades
Schools grade is shown separately in the Schools card above.
Census & demographics
- Census place
- Avalon, PA
- County
- Allegheny County · 1,022,028 people
- City population
- 19,642
- Metro
- Pittsburgh, PA
- Population (ZIP)
- 19,564
- Household income
- $68,287
- Rent vs Own
- Severe rent burden
- 952.0
Population outlook (Allegheny County) Hauer SSP2
- Today (2025)
- 1,250,282 people
- By 2030
- 1,256,482 · +0.5%
- By 2040
- 1,256,318 · +0.5%
- By 2050
- 1,244,169 · -0.5%
- By 2075
- 1,197,693 · -4.2%
- By 2100
- 1,093,187 · -12.6%
Race, ethnicity, and origin ACS 2023
- Neighborhood character
- Predominantly White (83%)
- Race & ethnicity
- White 83% Black 9% Two or more races 5% Hispanic / Latino 2% Asian 1%
- Common ancestry
- Romanian 6% Italian 2% Lithuanian 2%
- Foreign-born
- 2% · Canada, China
- Languages at home
- 96% English-only · Other Indo-European 1% Spanish 1% Chinese 1%
Political lean MEDSL · Allegheny
- 2024 margin
- Strong D (+20.3) · D 59.7% · R 39.4%
- 2008→2024 swing
- +4.8pp toward D · 2008: 15.5pp · 2024: 20.3pp
- All cycles
- 2024: D+20.3 2020: D+20.4 2016: D+16.4 2012: D+14.4 2008: D+15.5
Not yet ingested
- Civics
- —
Market trends
- HPI YoY
- ▼ -118.40%
- Current HPI
- 274.1929
- Rent YoY
- ▲ 5.16%
- Metro
- Pittsburgh, PA
- State GDP YoY
- ▲ 1.68%
- F500 in state
- 34
Industry mix (Fortune 500 HQ in PA)
| Industry | F500 HQs | Revenue |
|---|---|---|
| Healthcare | 2 | $309B |
|
||
| Insurance | 2 | $27B |
|
||
| Telecommunications / Media | 1 | $124B |
|
||
| Industrial Distribution | 1 | $22B |
|
||
| Financial Services | 1 | $20B |
|
||
| Chemicals / Materials | 1 | $18B |
|
||
Price history
+147.5% since first listed16 events — show timeline
- 2026-06-17 Listed $99,000 West Penn MLS
- 2014-01-03 Sold (Public Records) $50,000 Public Records
- 2013-12-20 Price Changed $50,000 West Penn MLS
- 2013-12-20 Sold (MLS) $50,000 West Penn MLS
- 2013-12-20 Price Changed $59,900 West Penn MLS
- 2013-08-14 Listed $59,900 West Penn MLS
- 2012-06-29 Listed $43,000 West Penn MLS
- 2010-12-29 Sold (Public Records) $30,000 Public Records
- 2010-12-16 Sold (MLS) $30,000 West Penn MLS
- 2010-12-16 Price Changed $39,500 West Penn MLS
- 2010-11-16 Listed $30,000 West Penn MLS
- 2010-06-09 Listed $39,500 West Penn MLS
- 2010-06-05 Listed $49,000 West Penn MLS
- 2003-04-21 Sold (Public Records) $28,500 Public Records
- 2003-04-10 Sold (MLS) $28,500 West Penn MLS
- 2002-02-25 Listed $40,000 West Penn MLS
Property tax history
-4.5%/yrLatest (2026): $2,109 · +2.8% YoY. Source: county tax records.
Cash-flow waterfall
monthlySold comps — $/sqft
last 12 mo · ≤1 miLoading sold comps…