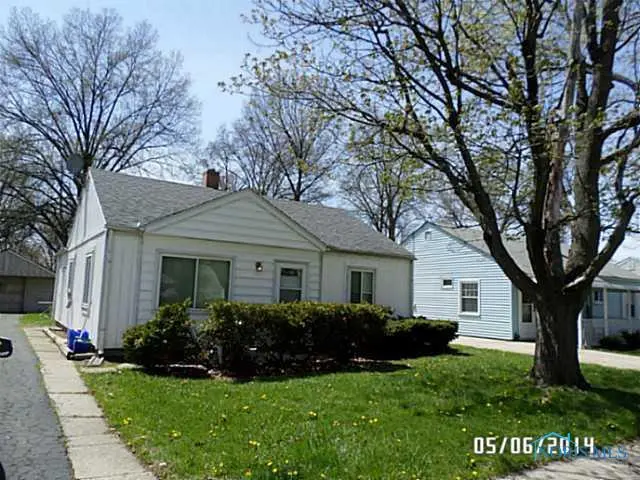
1113 Hugo St · Maumee, OH
Flood risk 1/10 · Minimal
- FEMA flood zone
- X (unshaded)
- Chance of flooding over 30 yrs
- 0.0%
- Est. flood insurance / yr
- $507 – $1,088
Fire risk 1/10 · Minimal
- Est. fire insurance / yr
- $713 – $1,323
Heat risk 3/10 · Minor
- Hot days now (above 100°F)
- 7 days/yr
- Hot days in 30 yrs
- 16 days/yr
Wind risk 2/10 · Minimal
- Chance of severe wind over 30 yrs
- —
Air-quality risk 2/10 · Minimal
- Unhealthy air days now
- 1 days/yr
- Unhealthy air days in 30 yrs
- 2 days/yr
Risk factors via First Street. Map © Google.
Why this score? — see what drove the D+ grade
The composite is a weighted blend of 9 inputs, each scored 0–100. Each bar is that input's sub-score; the figure is the points it added to the 100-point composite (weight × sub-score).
- ARV discount +13.5/15.0
- Cash flow +13.0/30.0
- Schools +5.6/10.0
- 1% rule +3.9/10.0
- DSCR +3.9/10.0
- Livability +3.8/5.0
- Rent growth +2.5/5.0
- Condition / age +2.5/5.0
- Appreciation +0.0/10.0
$165,000
🖨 Deal sheet (PDF) 📄 Offer letter ✓ Due diligence
Listing remarks MLS
Cute 2 bed, possible 3, bungalow. Maumee schools, newer windows, kitchen, bath, carpet and free appliances, motivated seller.
Key facts
- Central area
- Nearby parks
- Updated home
Tags
Neighborhood map
What this means for you Summary
Snapshot
- This is a 2-bed/1.0-bath single-family listed at $165k.
Deal economics
- At list price, monthly cash flow is $-9 ($-107/yr) — negative.
- To cash-flow at today's rent, offer at most $163k (1.0% below list).
- To meet the 1% rule (rent ≥ 1% of price), the offer needs to be $147k (11.1% below list).
- Recommended offer: $147k (11.1% below list) — sets the bar for 1% rule.
- Cap rate 6.2% vs local median 2.6% in Maumee — top-decile yield for the area; either an underpriced asset or a hidden risk that comps aren't pricing in. Stress-test before assuming the spread holds.
Location & tenants
- Location reads 76/100 on livability (#221 in OH, #3,442 nationally) — a middle-class / working-renter tenant base. Strengths: cost of living A+, housing A+, employment A-; Watch: amenities F, commute F, health & safety F.
- Maumee City (suburban): math 65% / reading 67% proficiency, ranked #194 of 656 in OH (top 30%) — acceptable for families but not a draw, mixed tenant base, ~2y average lease.
- Zoned schools: Fort Miami Elementary School (math 62% / reading 42%, grade C-, #851 of 1,584 statewide, top 56%, 330 students, 30% FRL); Gateway Middle School (math 63% / reading 66%, grade A-, #205 of 654 statewide, top 34%, 522 students, 34% FRL); Maumee High School (math 67% / reading 76%, grade B+, #98 of 781 statewide, top 13%, 648 students, 26% FRL) — zoned schools at 30% FRL track the district average.
- Market conditions: 114 active listings in the ZIP; 7 comparable units currently listed for rent nearby; rentals lingering (median 46d on market — plan ~5-8 weeks vacancy on turnover, expect pricing pressure); 57% of comp listings sitting > 30 days — soft ceiling on asking rent; solid renter incomes; 415 units permitted in Lucas County in 2024 (122 in 5+ unit buildings).
Forward outlook
- Local home prices are declining (-3.0%/yr); year-one equity from $1k of loan paydown is wiped out by about $5k of value loss. Plan a longer hold.
- Lucas County population projected at -16% by 2050 — secular population decline; favor cash flow + early exit over multi-decade hold.
Negotiation context
- Only 1 days on market — expect competitive offers; lowballing is unlikely to land.
- 3 sale attempts since 26y ago; this cycle's ask is 136% above the opening price — seller raised mid-cycle; expect resistance to lowballs.
- Current owner paid $63k; list at $165k implies a 162% gain — meaningful room to come down on a strong offer.
Risks & watch-outs
- Watch-outs: built in 1955 — expect roof / HVAC / electrical / plumbing capex.
Questions for the listing agent
- What do current leases actually rent for vs. the listed asking? Can we see a recent rent roll and the last 12 months of T-12 income?
- Built in 1955 — when were the roof, HVAC, electrical panel, plumbing, and water heater last replaced?
- Is there a deadline driving the sale (1031 exchange, divorce, estate, relocation)? That informs how much negotiation room exists.
- Schools are A-rated — typically a magnet for longer-tenancy family renters. What's the average tenant stay here, and is there a school-zone premium baked into asking?
- The area grade is low — what's the realistic commute time and amenity access for the typical tenant pool here? Any planned neighborhood developments (good or bad) we should know about?
- What's the average days-on-market for RENTAL listings here right now (not sales)? A rising rental-DOM trend means longer vacancies and softer asking-rent achievability than the comps imply.
- What's the recent tenant-quality profile in this submarket — average credit score on applications, eviction rate, late-payment / NSF rate, and stable-employment percentage? A property-management company in the area should have these aggregated.
- How much new for-sale + rental construction is in the pipeline within 1–3 miles? Heavy new supply typically softens prices + rents 12–24 months out; constrained supply supports both.
Investment metrics
- 1% rule
- 0.89% ✗
- Cap rate
- 6.23%
- Cash-on-cash
- -0.23%
- DSCR
- 0.99
- GRM
- 9.4
CMA / ARV
- ARV (on-the-fly)
- $190,344
- Comps found
- 12
Show comp detail 12 sales within ~0.75 mi
| Address | Dist | Beds/Ba | Sqft | Sold | Price | $/sf | Match |
|---|---|---|---|---|---|---|---|
| 1014 Hugo St | 0.16mi | 3/1.0 (+1) | 925 (+0%) | 3mo | $183,000 | $198 | 85 |
| 1033 Anderson Ave | 0.13mi | 3/2.0 (+1) | 925 (+0%) | 3mo | $229,000 | $248 | 82 |
| 1905 Meadow Ave | 0.05mi | 2/1.0 | 825 (-11%) | 1mo | $170,000 | $206 | 79 |
| 1047 Kirk St | 0.23mi | 3/1.0 (+1) | 875 (-5%) | 2mo | $150,000 | $171 | 74 |
| 1313 Birch Ave | 0.28mi | 3/1.0 (+1) | 999 (+8%) | 3mo | $247,000 | $247 | 65 |
| 855 Lamonde Dr | 0.40mi | 2/1.0 | 850 (-8%) | 5mo | $179,900 | $212 | 64 |
| 1371 Junior Dr | 0.35mi | 3/1.0 (+1) | 1,010 (+9%) | 2mo | $206,000 | $204 | 61 |
| 5022 Stengel Ave | 0.56mi | 3/1.0 (+1) | 960 (+4%) | 6mo | $166,500 | $173 | 58 |
| 2210 Glenview Dr | 0.37mi | 2/1.0 | 814 (-12%) | 6mo | $180,000 | $221 | 58 |
| 629 Pierce St | 0.59mi | 3/1.0 (+1) | 884 (-4%) | 5mo | $210,000 | $238 | 56 |
| 1253 Holgate Ave | 0.70mi | 3/1.5 (+1) | 960 (+4%) | 1mo | $193,500 | $202 | 53 |
| 716 Ransom St | 0.59mi | 2/1.0 | 1,058 (+14%) | 2mo | $180,000 | $170 | 46 |
Match score weights: distance 35% · size 25% · config 20% · recency 20%. Top-matched comps best support the ARV.
Projected returns pro-forma
-3.0% appreciation · 3.0% rent growth · sell at horizon
- IRR
- -16.7%
- Equity multiple
- 0.41×
- Total profit
- $-27,264
- Equity at exit
- $24,602
- IRR
- -8.4%
- Equity multiple
- 0.47×
- Total profit
- $-24,310
- Equity at exit
- $14,266
Cash invested: $46,200 (down + closing). Projections, not guarantees.
Landlord ↔ Tenant lean methodology
- Overall (STATE)
- 73 Landlord-Friendly
- State Ohio
- 73 Landlord-Friendly · R+6
- County
- — inherits STATE
- City
- — inherits STATE
ZIP-level market 43537
- Home prices YoY
- -29.6%
- Active inventory
- 114
- Price-to-rent
- 9.4×
Monthly cashflow live
- Estimated rent
- $1,468 high interval (Pro) →
- Mortgage (P&I)
- −$865
- Tax from tax record
- −$234 /mo · $2,811/yr
- Insurance
- −$69
- HOA
- −$0
- Vacancy / Maint / Mgmt
- −$308
- Net cashflow
- $-9
Break-even live
Sensitivity live
| Price | -10% $85 | -5% $38 | +0% $-9 | +5% $-56 | +10% $-102 |
|---|---|---|---|---|---|
| Rent | -10% $-125 | -5% $-67 | +0% $-9 | +5% $49 | +10% $107 |
| Rate | -1.0pp $74 | -0.5pp $33 | base $-9 | +0.5pp $-52 | +1.0pp $-95 |
UW: 25.0% down · 7.5% · 30yr · 1.5% tax · 5.0% vac · 8.0% maint · 8.0% mgmt
Financing live
Cash to close
- Down payment
- $41,250
- Closing costs
- $4,950
- Reserves months
- —
- Total cash needed
- —
Loan-product check · same deal, 3 products live
Conventional
25% down · 7.5% · 30yr
- Down + closing
- —
- Monthly P&I
- —
- Monthly cashflow
- —
- DSCR
- —
- Eligible?
- —
Personal DTI + credit; lowest rate.
DSCR
20% down · 8.5% · 30yr
- Down + closing
- —
- Monthly P&I
- —
- Monthly cashflow
- —
- DSCR
- —
- Eligible?
- —
No personal income docs; deal must DSCR.
Hard money
10% down · 12.0% · 12mo
- Down + closing
- —
- Monthly P&I
- —
- Monthly cashflow
- —
- DSCR
- —
- Eligible?
- —
Short-term bridge; refi at stabilization.
Rent comps 7 comps
| Address | Beds | Baths | Sqft | Rent | $/sqft | DOM | Units | Dist |
|---|---|---|---|---|---|---|---|---|
| 1106 Hugo St Maumee, OH | 3.0 | 1.0 | 1006 | $1,595 | $1.59 | 45d | 1 | 0.05mi |
| 123 S Masters Ct Maumee, OH | 1.0 | 1.0 | 668 | $820 | $1.23 | 25d | 1 | 0.31mi |
| 2647 Eastgate Rd Toledo, OH | 1.0–2.0 | 1.0 | 722 | $1,209 | $1.67 | 25d | 1 | 0.90mi |
| 3025 S Byrne Rd Unit 1 Toledo, OH | 3.0 | 1.0 | 1064 | $1,095 | $1.03 | 23d | 1 | 1.00mi |
| 2560 Key St Toledo, OH | 1.0 | 1.0 | 650 | $745 | $1.15 | 45d | 1 | 1.11mi |
| 3165 Glanzman Rd Toledo, OH | 1.0–2.0 | 1.0 | 658 | $799 | $1.21 | 45d | 1 | 1.42mi |
| 18 Terrace Downs St Toledo, OH | 1.0 | 1.0 | 550 | $625 | $1.14 | 45d | 1 | 1.44mi |
Listing history 11 events
-
2025-10-14price $63,000 126-char remark
Show marketing remark (126 chars)
Cute 2 bed, possible 3, bungalow. Maumee schools, newer windows, kitchen, bath, carpet and free appliances, motivated seller.
-
2014-07-22soldstatus $63,000
-
2014-07-18soldstatus $63,000 126-char remark
Show marketing remark (126 chars)
Cute 2 bed, possible 3, bungalow. Maumee schools, newer windows, kitchen, bath, carpet and free appliances, motivated seller.
-
2014-07-18price $69,900 126-char remark
Show marketing remark (126 chars)
Cute 2 bed, possible 3, bungalow. Maumee schools, newer windows, kitchen, bath, carpet and free appliances, motivated seller.
-
2014-05-04$69,900 126-char remark
Show marketing remark (126 chars)
Cute 2 bed, possible 3, bungalow. Maumee schools, newer windows, kitchen, bath, carpet and free appliances, motivated seller.
-
2000-06-27soldstatus $66,000
-
2000-06-26soldstatus $66,000 236-char remark
Show marketing remark (236 chars)
AUCTION JUNE 10 AT 12:00 NOON, 10% BUYER PREMIUM. COZY MAUMEE HOME HAS ENCL OSED PORCH WITH VIEW OF LARGE BACKYARD.COVERED PATIO, ALL APPLIANCES STAY. NEW CARPETING, ONE CAR GARAGE NEEDS REPAIR.NICE HOME IN PLEASANT MAUMEE NEIGHBORHOOD.
-
2000-05-24historical
-
2000-05-08$66,000 236-char remark
Show marketing remark (236 chars)
AUCTION JUNE 10 AT 12:00 NOON, 10% BUYER PREMIUM. COZY MAUMEE HOME HAS ENCL OSED PORCH WITH VIEW OF LARGE BACKYARD.COVERED PATIO, ALL APPLIANCES STAY. NEW CARPETING, ONE CAR GARAGE NEEDS REPAIR.NICE HOME IN PLEASANT MAUMEE NEIGHBORHOOD.
-
2000-02-29$84,900
-
1985-02-21soldstatus $31,000
ⓘ Source: listings_history table (triggers on properties + properties_extension) + one-shot
backfill from property_details.listing_events for pre-trigger history.
Tax reassessment forecast OH · Partial reset (capped growth)
- Current annual tax
- $2,811 · $234/mo
- Projected year-2 tax
- $2,811 · $234/mo
- Expected delta
- $0/yr ($0/mo · 0.0%)
ⓘ Screening estimate from a state-policy table — verify with the county assessor before closing.
Climate risk First Street
- Flood 1/10 Low FEMA zone X (unshaded) · 0% chance over 30 yrs
- Wildfire 1/10 Low
- Heat 3/10 Moderate 7 d/yr ≥100°F today · 16 d/yr by 30 yrs out
- Wind 2/10 Low
- Air quality 2/10 Low 1 unhealthy d/yr today · 2 by 30 yrs out
Nearby sold comps map
Loading sold comps map…
Walkable amenities ~0.75 mi
Loading nearby amenities…
Taxation est. · year 1
- Rental income
- $17,610
- − Mortgage interest
- −$9,243
- − Property taxes
- −$2,811
- − Insurance
- −$825
- − Repairs & maintenance
- −$1,409
- − Management
- −$1,409
- − Depreciation
- −$4,800
- Taxable loss
- −$2,885
- Est. tax savings @ 24.0%
- +$692
- After-tax cash flow
- $586/yr
For passive investors: Depreciation is non-cash, so a rental often shows a tax loss while cash-flowing — sheltering income. Rental losses are passive: they offset passive income freely, and up to $25,000/yr can offset ordinary (W-2) income if you actively participate and your MAGI is under $100k (phasing out to $0 by $150k); unused losses carry forward. On sale, claimed depreciation is recaptured at up to 25%, and gains may owe capital-gains tax (a 1031 exchange can defer both). Figures are a year-1 estimate at your 24.0% rate — not tax advice; consult a CPA.
Schools (NCES district)
- District
- Maumee City
- NCES district ID
- 3904436
- Math proficiency
- 65% ▼ -10.00%
- Reading proficiency
- 67% ▼ -7.00%
- Median HH income
- $53,412
- Composite
- 56.38/100
- National rank
- #1162
- State rank
- #194 of 656 in OH
Livability — Maumee
- Score
- 76/100
- State rank
- #221
- US rank
- #3442
Category grades
Schools grade is shown separately in the Schools card above.
Census & demographics
- Census place
- Maumee, OH
- County
- Lucas County · 380,724 people
- City population
- 30,111
- Metro
- Toledo, OH
- Population (ZIP)
- 30,111
- Household income
- $82,752
- Rent vs Own
- Severe rent burden
- 592.0
Population outlook (Lucas County) Hauer SSP2
- Today (2025)
- 420,751 people
- By 2030
- 410,187 · -2.5%
- By 2040
- 384,019 · -8.7%
- By 2050
- 355,125 · -15.6%
- By 2075
- 291,683 · -30.7%
- By 2100
- 233,670 · -44.5%
Race, ethnicity, and origin ACS 2023
- Neighborhood character
- Predominantly White (83%)
- Race & ethnicity
- White 83% Hispanic / Latino 6% Black 6% Two or more races 6% Asian 1%
- Hispanic origin (detail)
- Mexican 4%
- Common ancestry
- Romanian 9% Lithuanian 4% Slovak 2%
- Foreign-born
- 3% · Canada
- Languages at home
- 95% English-only · Spanish 2% Other Indo-European 1% German/W. Germanic 1%
Political lean MEDSL · Lucas
- 2024 margin
- D (+12.6) · D 55.8% · R 43.2%
- 2008→2024 swing
- -18.9pp toward R · 2008: 31.4pp · 2024: 12.6pp
- All cycles
- 2024: D+12.6 2020: D+16.8 2016: D+17.4 2012: D+30.4 2008: D+31.4
Not yet ingested
- Civics
- —
Market trends
- HPI YoY
- ▼ -85.67%
- Current HPI
- 203.8449
- Rent YoY
- —
- Metro
- Toledo, OH
- State GDP YoY
- ▲ 1.98%
- F500 in state
- 48
Industry mix (Fortune 500 HQ in OH)
| Industry | F500 HQs | Revenue |
|---|---|---|
| Insurance | 3 | $145B |
|
||
| Industrial Machinery | 3 | $49B |
|
||
| Financial Services | 3 | $24B |
|
||
| Consumer Goods | 2 | $93B |
|
||
| Aerospace / Defense | 2 | $47B |
|
||
| Utilities | 2 | $33B |
|
||
Price history
+103.2% since first listed11 events — show timeline
- 2025-10-14 Price Changed $63,000 NORIS
- 2014-07-22 Sold (Public Records) $63,000 Public Records
- 2014-07-18 Sold (MLS) $63,000 NORIS
- 2014-07-18 Price Changed $69,900 NORIS
- 2014-05-04 Listed $69,900 NORIS
- 2000-06-27 Sold (Public Records) $66,000 Public Records
- 2000-06-26 Sold (MLS) $66,000 NORIS
- 2000-05-24 Listing Removed — NORIS
- 2000-05-08 Listed $66,000 NORIS
- 2000-02-29 Listed $84,900 NORIS
- 1985-02-21 Sold (Public Records) $31,000 Public Records
Property tax history
+5.3%/yrLatest (2025): $2,811 · +2.2% YoY. Source: county tax records.
Cash-flow waterfall
monthlySold comps — $/sqft
last 12 mo · ≤1 miLoading sold comps…