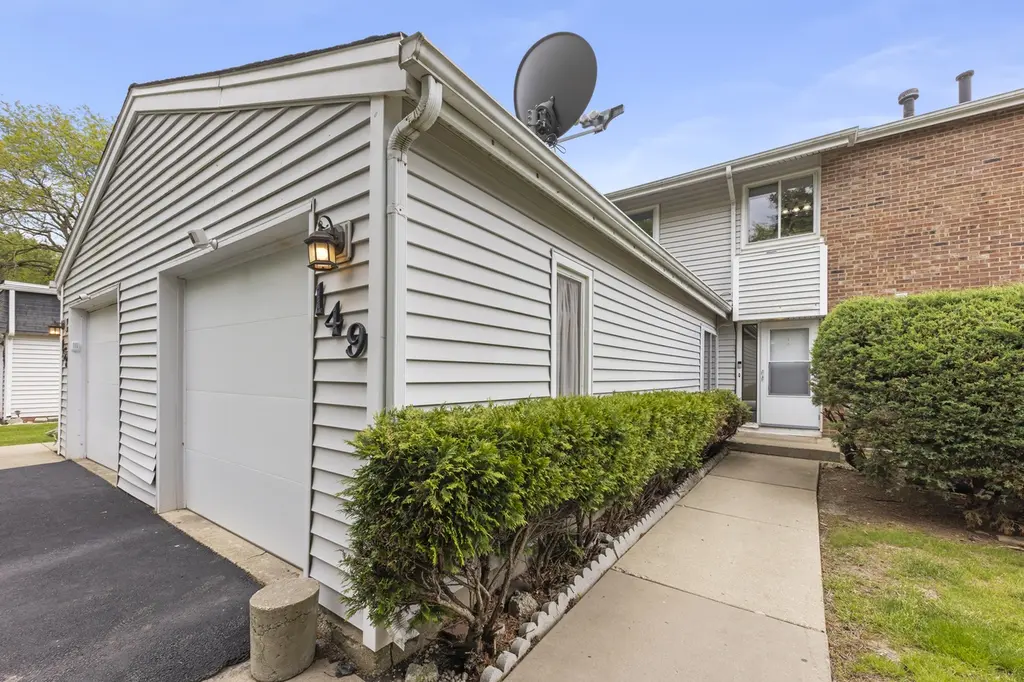
149 Thomas Rd · Bolingbrook, IL
Flood risk 1/10 · Minimal
- FEMA flood zone
- X (unshaded)
- Chance of flooding over 30 yrs
- 0.0%
- Est. flood insurance / yr
- $473 – $860
Fire risk 3/10 · Minor
- Est. fire insurance / yr
- $804 – $1,492
Heat risk 3/10 · Minor
- Hot days now (above 103°F)
- 7 days/yr
- Hot days in 30 yrs
- 15 days/yr
Wind risk 2/10 · Minimal
- Chance of severe wind over 30 yrs
- —
Air-quality risk 4/10 · Minor
- Unhealthy air days now
- 4 days/yr
- Unhealthy air days in 30 yrs
- 6 days/yr
Risk factors via First Street. Map © Google.
Why this score? — see what drove the C- grade
The composite is a weighted blend of 9 inputs, each scored 0–100. Each bar is that input's sub-score; the figure is the points it added to the 100-point composite (weight × sub-score).
- Cash flow +15.0/30.0
- ARV discount +15.0/15.0
- 1% rule +6.8/10.0
- DSCR +4.6/10.0
- Livability +3.8/5.0
- Rent growth +3.5/5.0
- Condition / age +2.5/5.0
- Schools +2.3/10.0
- Appreciation +0.0/10.0
$220,000
🖨 Deal sheet (PDF) 📄 Offer letter ✓ Due diligence
Listing remarks
Multiple offers received. RENTALS ALLOWED VALUE-ADD OPPORTUNITY! Unlock instant equity in this spacious 2+1BR, 2.5BA Bolingbrook townhome. Freshly painted (2025) and new carpet (2025) provide a clean, modern canvas to start your renovation journey. The Heavy Lifting Started: New Garage Door (2023), Smart Thermostat (2024), Stove (2020), Water Heater (2018), and Roof (~7 yrs). The Canvas: Original windows, HVAC, and siding are ready for your 2026 energy-efficient upgrades. Features a massive primary suite with bay window and 8x8 WIC, plus a finished basement with a 3rd bedroom/flex-space. Private, fenced backyard. Prime Location: Minutes to I-55/I-355, Lisle Metra, and the award-winning STEM
Key facts
- Finished basement
- Smart thermostat
- Prime location
Tags
Property features AI
Finance
- Other: School bus service available
- HOA & community: Monthly association fee of $230; HOA covers insurance, clubhouse, pool, exterior maintenance, lawn care, and snow removal; Pets allowed (cats and dogs permitted)
Exterior
- Parking: Attached garage (owned) with garage door opener; Asphalt parking; Total parking for 3 vehicles (1 garage space)
- Utilities: Public water; Public sewer; Electric with circuit breakers
- Home design: Attached single-family (townhouse) — 2-story; Entry level is the first floor; Fee simple ownership with HOA
- Construction: Built 51–60 years ago; Aluminum and vinyl siding; Asphalt roof; Concrete perimeter foundation; Property built before 1978
- Exterior features: Fenced yard; Lot dimensions approximately 23.7 x 10²
Interior
- Kitchen: Kitchen on main level with wood laminate flooring
- Bedrooms: Master bedroom on second level with bay window and full bath; Second bedroom on second level; Additional bedroom in basement (below grade); Possible third bedroom
- Flooring: Carpet in several rooms including master and living room; Vinyl in den and dining room; Wood laminate in kitchen; Ceramic tile in basement bedroom
- Bathrooms: 2 full bathrooms; 1 half bathroom
- Heating & cooling: Natural gas forced-air heating; Central air conditioning
- Interior features: Finished full basement; 7 total rooms; Den; Family room; Living room; Dining room
- Laundry & utility: Main-level laundry
Neighborhood map
What this means for you Summary
Snapshot
- This is a 3-bed/2.5-bath townhouse listed at $220k.
Deal economics
- At list price, monthly cash flow is $68 ($818/yr) — positive.
- The deal already cash-flows at list — no discount required.
- Meets the 1% rule at list price ($3k rent vs $220k).
- Recommended offer: $217k (1.5% below list) — sets the bar for market timing.
- Cap rate 6.7% vs local median 4.8% in Bolingbrook — top-decile yield for the area; either an underpriced asset or a hidden risk that comps aren't pricing in. Stress-test before assuming the spread holds.
Location & tenants
- Location reads 76/100 on livability (#199 in IL, #3,692 nationally) — a middle-class / working-renter tenant base. Strengths: employment A+, housing A+, crime A; Watch: amenities F, health & safety F.
- Valley View CUSD 365U (suburban): math 21% / reading 28% proficiency, ranked #289 of 620 in IL (top 47%) — low school quality limits family demand, transient renter base, plan for 1-2y turnover.
- Zoned schools: Wood View Elem School (math 8% / reading 12%, grade F, #1,517 of 2,056 statewide, top 78%, 450 students, 0% FRL); Brooks Middle School (math 27% / reading 40%, grade F, #214 of 665 statewide, top 32%, 933 students, 0% FRL); Bolingbrook High School (math 23% / reading 29%, grade F, #244 of 693 statewide, top 35%, 3,405 students, 0% FRL) — zoned schools average 0% FRL vs 51% district-wide (51 pts lower); this property's tenant base skews higher-income than the district average.
- Market conditions: Rents rising fast (+4.1%/yr); 68 active listings in the ZIP; 18 comparable units currently listed for rent nearby; rentals at typical pace (median 22d on market — plan ~3-4 weeks tenant-placement turnaround); solid renter incomes; 2,028 units permitted in Will County in 2024 (530 in 5+ unit buildings).
- This rent runs 33% of the median local income ($93k/yr) — at the standard rent-burdened threshold; future hikes will face affordability resistance.
Forward outlook
- Local home prices are declining (-3.0%/yr); year-one equity from $2k of loan paydown is wiped out by about $7k of value loss. Plan a longer hold.
- Will County population projected to shrink 4% by 2050 — rents likely to lag national; underwrite the cash flow, not the appreciation.
Negotiation context
- It's been on market 26 days — a 2% lower offer ($217k) is reasonable based on typical stale-listing flexibility.
- 2 sale attempts with the ask held roughly flat each time — persistent listings suggest the price (not the market) is what's stuck; bring a comps-based counter.
Risks & watch-outs
- Watch-outs: property tax is 2.8% of price.
Questions for the listing agent
- Built in 1971 — when were the roof, HVAC, electrical panel, plumbing, and water heater last replaced?
- Property tax is high relative to price — has the assessment been appealed recently, and will the sale trigger a re-assessment?
- What does the HOA fee cover, when was the last increase, and are there any pending special assessments or reserve-fund shortfalls?
- Is there a deadline driving the sale (1031 exchange, divorce, estate, relocation)? That informs how much negotiation room exists.
- Schools are D-rated, which usually means shorter tenancies and higher turnover. Who's the typical renter profile here, and what's been the actual vacancy rate?
- What's the average days-on-market for RENTAL listings here right now (not sales)? A rising rental-DOM trend means longer vacancies and softer asking-rent achievability than the comps imply.
- What's the recent tenant-quality profile in this submarket — average credit score on applications, eviction rate, late-payment / NSF rate, and stable-employment percentage? A property-management company in the area should have these aggregated.
- How much new for-sale + rental construction is in the pipeline within 1–3 miles? Heavy new supply typically softens prices + rents 12–24 months out; constrained supply supports both.
Investment metrics
- 1% rule
- 1.18% ✓
- Cap rate
- 6.66%
- Cash-on-cash
- 1.33%
- DSCR
- 1.06
- GRM
- 7.0
CMA / ARV
- ARV (median comp)
- $282,571
- List price
- $220,000
- Delta
- -22.14%
- Verdict
- UNDERPRICED
- Comps
- 20 within 1.0 mi
Show comp detail 12 sales within ~0.75 mi
| Address | Dist | Beds/Ba | Sqft | Sold | Price | $/sf | Match |
|---|---|---|---|---|---|---|---|
| 149 Thomas Rd | 0.00mi | 3/2.5 | 1,460 (0%) | 0mo | $228,000 | $156 | 100 |
| 462 Ridge Ln | 0.39mi | 2/2.0 (-1) | 1,468 (+0%) | 0mo | $406,570 | $277 | 74 |
| BUILDING 14 Ridge Ln | 0.38mi | 2/2.0 (-1) | 1,468 (+0%) | 1mo | $376,900 | $257 | 74 |
| 460 Ridge Ln | 0.39mi | 2/2.0 (-1) | 1,468 (+0%) | 2mo | $409,900 | $279 | 72 |
| 458 Ridge Ln | 0.39mi | 2/2.0 (-1) | 1,459 (-0%) | 3mo | $399,131 | $274 | 72 |
| 417 Monet Cir | 0.47mi | 3/2.0 | 1,477 (+1%) | 2mo | $295,000 | $200 | 72 |
| 490 Ridge Ln | 0.42mi | 2/2.0 (-1) | 1,468 (+0%) | 1mo | $388,868 | $265 | 72 |
| 225 Monroe Rd | 0.22mi | 2/2.5 (-1) | 1,320 (-10%) | 2mo | $225,000 | $170 | 67 |
| 419 Lakeview Cir | 0.58mi | 2/2.5 (-1) | 1,306 (-10%) | 2mo | $270,000 | $207 | 49 |
| 369 Lakeview Cir | 0.59mi | 2/2.5 (-1) | 1,306 (-10%) | 2mo | $265,000 | $203 | 48 |
| 364 Kirkwood Cir | 0.73mi | 3/1.5 | 1,250 (-14%) | 0mo | $255,000 | $204 | 38 |
| 370 Kirkwood Cir | 0.74mi | 3/1.5 | 1,250 (-14%) | 0mo | $270,000 | $216 | 37 |
Match score weights: distance 35% · size 25% · config 20% · recency 20%. Top-matched comps best support the ARV.
Projected returns pro-forma
-3.0% appreciation · 4.1% rent growth · sell at horizon
- IRR
- -12.4%
- Equity multiple
- 0.54×
- Total profit
- $-28,072
- Equity at exit
- $32,803
- IRR
- -1.2%
- Equity multiple
- 0.91×
- Total profit
- $-5,317
- Equity at exit
- $19,022
Cash invested: $61,600 (down + closing). Projections, not guarantees.
Landlord ↔ Tenant lean methodology
- Overall (STATE)
- 43 Moderately Tenant-Leaning
- State Illinois
- 43 Moderately Tenant-Leaning · D+7
- County
- — inherits STATE
- City
- — inherits STATE
ZIP-level market 60440
- Rents YoY
- 4.1%
- Active inventory
- 68
- Price-to-rent
- 7.0×
Monthly cashflow live
- Estimated rent
- $2,601 high interval (Pro) →
- Mortgage (P&I)
- −$1,154
- Tax from tax record
- −$511 /mo · $6,138/yr
- Insurance
- −$92
- HOA
- −$230
- Vacancy / Maint / Mgmt
- −$546
- Net cashflow
- $68
Break-even live
Sensitivity live
| Price | -10% $193 | -5% $130 | +0% $68 | +5% $6 | +10% $-56 |
|---|---|---|---|---|---|
| Rent | -10% $-137 | -5% $-35 | +0% $68 | +5% $171 | +10% $274 |
| Rate | -1.0pp $179 | -0.5pp $124 | base $68 | +0.5pp $11 | +1.0pp $-47 |
UW: 25.0% down · 7.5% · 30yr · 1.5% tax · 5.0% vac · 8.0% maint · 8.0% mgmt
Financing live
Cash to close
- Down payment
- $55,000
- Closing costs
- $6,600
- Reserves months
- —
- Total cash needed
- —
Loan-product check · same deal, 3 products live
Conventional
25% down · 7.5% · 30yr
- Down + closing
- —
- Monthly P&I
- —
- Monthly cashflow
- —
- DSCR
- —
- Eligible?
- —
Personal DTI + credit; lowest rate.
DSCR
20% down · 8.5% · 30yr
- Down + closing
- —
- Monthly P&I
- —
- Monthly cashflow
- —
- DSCR
- —
- Eligible?
- —
No personal income docs; deal must DSCR.
Hard money
10% down · 12.0% · 12mo
- Down + closing
- —
- Monthly P&I
- —
- Monthly cashflow
- —
- DSCR
- —
- Eligible?
- —
Short-term bridge; refi at stabilization.
Rent comps 18 comps
| Address | Beds | Baths | Sqft | Rent | $/sqft | DOM | Units | Dist |
|---|---|---|---|---|---|---|---|---|
| 228 Monroe Rd Bolingbrook, IL | 3.0 | 1.5 | 1180 | $2,600 | $2.20 | 44d | 1 | 0.23mi |
| 513 Monroe Rd Bolingbrook, IL | 2.0 | 2.5 | 1200 | $2,495 | $2.08 | 25d | 1 | 0.31mi |
| 239 Malibu Dr Bolingbrook, IL | 3.0 | 1.5 | 975 | $2,550 | $2.62 | 20d | 1 | 0.78mi |
| 327 Musial Cir Unit 1237866P Bolingbrook, IL | 3.0 | 2.0 | 1593 | $9,596 | $6.02 | 22d | 1 | 0.94mi |
| 361 Lyons Dr Bolingbrook, IL | 3.0 | 1.5 | 1675 | $2,800 | $1.67 | 3d | 1 | 1.01mi |
| 601 Preston Dr Bolingbrook, IL | 3.0 | 1.0–2.0 | 980 | $2,250 | $2.30 | 8d | 1 | 1.04mi |
| 2 Willow Ct Bolingbrook, IL | 4.0 | 2.0 | 1800 | $3,300 | $1.83 | 2d | 1 | 1.06mi |
| 131 Enclave Cir Unit C Bolingbrook, IL | 2.0 | 1.5 | 1498 | $2,499 | $1.67 | 21d | 1 | 1.15mi |
| 3420 Joann Ln Woodridge, IL | 1.0–2.0 | 1.0 | 775 | $2,085 | $2.69 | 2d | 15 | 1.19mi |
| 254 Thornhurst Rd Bolingbrook, IL | 3.0 | 2.5 | 1600 | $2,600 | $1.62 | 2d | 1 | 1.26mi |
| 238 Algonquin Ct Unit D Bolingbrook, IL | 3.0 | 1.0 | 1108 | $2,250 | $2.03 | 8d | 1 | 1.32mi |
| 231 Dakota Ct Unit B Bolingbrook, IL | 2.0 | 1.0 | 968 | $1,850 | $1.91 | 44d | 1 | 1.43mi |
| 230 Dakota Ct Unit B Bolingbrook, IL | 3.0 | 1.0 | 1400 | $2,200 | $1.57 | 25d | 1 | 1.44mi |
| 3514 83rd St Woodridge, IL | 3.0 | 3.0 | 1300 | $2,486 | $1.91 | 25d | 1 | 1.44mi |
| 2709 Northcreek Dr #2102 Woodridge, IL | 2.0 | 1.5 | 963 | $1,850 | $1.92 | 13d | 1 | 1.48mi |
| 176 Fairwood Dr Bolingbrook, IL | 3.0 | 1.5 | 1162 | $2,166 | $1.86 | 44d | 1 | 1.49mi |
| 651 Chesapeake Dr Bolingbrook, IL | 3.0 | 2.0 | 1800 | $2,700 | $1.50 | 17d | 1 | 1.49mi |
| 668 Niagara Dr Bolingbrook, IL | 3.0 | 2.5 | 1402 | $2,695 | $1.92 | 44d | 1 | 1.50mi |
HOA detail
- Monthly dues
- $230 · $2,760/yr
- Likely covers
- water
Listing history 19 events
-
2026-06-10status $220,000 Pending 26 DOM
-
2026-06-09days on market $220,000 Contingent - Continue to Show 26 DOM
-
2026-06-08days on market $220,000 Contingent - Continue to Show 25 DOM
-
2026-06-07days on market $220,000 Contingent - Continue to Show 24 DOM
-
2026-06-04days on market $220,000 Contingent - Continue to Show 21 DOM
-
2026-06-03days on market $220,000 Contingent - Continue to Show 20 DOM
-
2026-06-02days on market $220,000 Contingent - Continue to Show 19 DOM
-
2026-06-01days on market $220,000 Contingent - Continue to Show 18 DOM
-
2026-05-31days on market $220,000 Contingent - Continue to Show 17 DOM
-
2026-05-14historical
-
2026-05-14$220,000 Active 819-char remark
-
2025-12-31historical
-
2025-11-06price
-
2025-10-11price
-
2025-09-10Active
-
2005-08-12soldstatus $150,000
-
2002-06-11soldstatus $126,000
-
1997-06-17soldstatus $100,500
-
1996-02-29soldstatus $83,500
ⓘ Source: listings_history table (triggers on properties + properties_extension) + one-shot
backfill from property_details.listing_events for pre-trigger history.
Tax reassessment forecast IL · Partial reset (capped growth)
- Current annual tax
- $6,138 · $511/mo
- Projected year-2 tax
- $6,138 · $511/mo
- Expected delta
- $0/yr ($0/mo · 0.0%)
ⓘ Screening estimate from a state-policy table — verify with the county assessor before closing.
Climate risk First Street
- Flood 1/10 Low FEMA zone X (unshaded) · 0% chance over 30 yrs
- Wildfire 3/10 Moderate
- Heat 3/10 Moderate 7 d/yr ≥103°F today · 15 d/yr by 30 yrs out
- Wind 2/10 Low
- Air quality 4/10 Moderate 4 unhealthy d/yr today · 6 by 30 yrs out
Nearby sold comps map
Loading sold comps map…
Walkable amenities ~0.75 mi
Loading nearby amenities…
Taxation est. · year 1
- Rental income
- $31,215
- − Mortgage interest
- −$12,323
- − Property taxes
- −$6,138
- − Insurance
- −$1,100
- − Repairs & maintenance
- −$2,497
- − Management
- −$2,497
- − HOA
- −$2,760
- − Depreciation
- −$6,400
- Taxable loss
- −$2,500
- Est. tax savings @ 24.0%
- +$600
- After-tax cash flow
- $1,418/yr
For passive investors: Depreciation is non-cash, so a rental often shows a tax loss while cash-flowing — sheltering income. Rental losses are passive: they offset passive income freely, and up to $25,000/yr can offset ordinary (W-2) income if you actively participate and your MAGI is under $100k (phasing out to $0 by $150k); unused losses carry forward. On sale, claimed depreciation is recaptured at up to 25%, and gains may owe capital-gains tax (a 1031 exchange can defer both). Figures are a year-1 estimate at your 24.0% rate — not tax advice; consult a CPA.
Schools (NCES district)
- District
- Valley View CUSD 365U
- NCES district ID
- 1740070
- Math proficiency
- 21% ▼ -15.00%
- Reading proficiency
- 28% ▼ -10.00%
- Median HH income
- $69,424
- Composite
- 23.48/100
- National rank
- #7875
- State rank
- #289 of 620 in IL
Livability — Bolingbrook
- Score
- 76/100
- State rank
- #199
- US rank
- #3692
Category grades
Schools grade is shown separately in the Schools card above.
Census & demographics
- Census place
- Bolingbrook, IL
- County
- Will County · 412,448 people
- City population
- 74,096
- Metro
- Chicago-Naperville-Elgin, IL-IN-WI
- Population (ZIP)
- 51,940
- Household income
- $93,494
- Rent vs Own
- Severe rent burden
- 1149.0
Population outlook (Will County) Hauer SSP2
- Today (2025)
- 705,368 people
- By 2030
- 708,154 · +0.4%
- By 2040
- 702,692 · -0.4%
- By 2050
- 680,249 · -3.6%
- By 2075
- 611,990 · -13.2%
- By 2100
- 516,215 · -26.8%
Race, ethnicity, and origin ACS 2023
- Neighborhood character
- Highly diverse neighborhood (Simpson 0.72)
- Race & ethnicity
- White 36% Hispanic / Latino 33% Black 19% Two or more races 15% Asian 10%
- Hispanic origin (detail)
- Mexican 30%
- Common ancestry
- Romanian 7% Lithuanian 1% Italian 1%
- Foreign-born
- 23% · Canada, China, South Korea
- Languages at home
- 62% English-only · Spanish 26% Other Indo-European 5% Tagalog/Filipino 2%
Political lean MEDSL · Will
- 2024 margin
- Toss-up / Even · D 50.1% · R 48.5% · Other 1.4%
- 2008→2024 swing
- -11.6pp toward R · 2008: 13.2pp · 2024: 1.6pp
- All cycles
- 2024: D+1.6 2020: D+8.3 2016: D+5.7 2012: D+3.7 2008: D+13.2
Not yet ingested
- Civics
- —
Market trends
- HPI YoY
- ▼ -256.14%
- Current HPI
- 246.1906
- Rent YoY
- ▲ 4.10%
- Metro
- Chicago-Naperville-Elgin, IL-IN-WI
- State GDP YoY
- ▲ 1.59%
- F500 in state
- 60
Industry mix (Fortune 500 HQ in IL)
| Industry | F500 HQs | Revenue |
|---|---|---|
| Insurance | 4 | $201B |
|
||
| Consumer Goods | 4 | $87B |
|
||
| Industrial Machinery | 3 | $64B |
|
||
| Healthcare | 2 | $55B |
|
||
| Retail / Pharmacy | 1 | $148B |
|
||
| Agriculture / Food | 1 | $86B |
|
||
Price history
+173.1% since first listed13 events — show timeline
- 2026-06-16 Sold (MLS) $228,000 MRED as Distributed by MLS Grid
- 2026-06-09 Pending — MRED as Distributed by MLS Grid
- 2026-05-19 Contingent — MRED as Distributed by MLS Grid
- 2026-05-14 Listing Removed — MRED as Distributed by MLS Grid
- 2026-05-14 Listed $220,000 MRED as Distributed by MLS Grid
- 2025-12-31 Listing Removed — MRED as Distributed by MLS Grid
- 2025-11-06 Price Changed — MRED as Distributed by MLS Grid
- 2025-10-11 Price Changed — MRED as Distributed by MLS Grid
- 2025-09-10 Listed — MRED as Distributed by MLS Grid
- 2005-08-12 Sold (Public Records) $150,000 Public Records
- 2002-06-11 Sold (Public Records) $126,000 Public Records
- 1997-06-17 Sold (Public Records) $100,500 Public Records
- 1996-02-29 Sold (Public Records) $83,500 Public Records
Property tax history
+3.0%/yrLatest (2024): $6,138 · +7.3% YoY. Source: county tax records.
Cash-flow waterfall
monthlySold comps — $/sqft
last 12 mo · ≤1 miLoading sold comps…