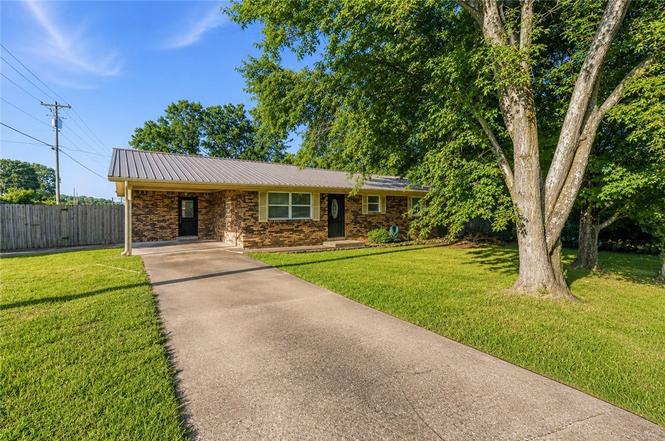
11 Northwood St · West Fork, AR
Flood risk 1/10 · Minimal
- FEMA flood zone
- X (unshaded)
- Chance of flooding over 30 yrs
- 0.0%
- Est. flood insurance / yr
- $507 – $1,088
Fire risk 5/10 · Moderate
- Est. fire insurance / yr
- $1,499 – $2,785
Heat risk 5/10 · Moderate
- Hot days now (above 103°F)
- 7 days/yr
- Hot days in 30 yrs
- 22 days/yr
Wind risk 2/10 · Minimal
- Chance of severe wind over 30 yrs
- 2.0%
Air-quality risk 2/10 · Minimal
- Unhealthy air days now
- 0 days/yr
- Unhealthy air days in 30 yrs
- 1 days/yr
Risk factors via First Street. Map © Google.
Why this score? — see what drove the C grade
The composite is a weighted blend of 9 inputs, each scored 0–100. Each bar is that input's sub-score; the figure is the points it added to the 100-point composite (weight × sub-score).
- Cash flow +28.7/30.0
- DSCR +10.0/10.0
- 1% rule +8.0/10.0
- Livability +3.3/5.0
- Rent growth +2.5/5.0
- Condition / age +2.5/5.0
- Schools +2.1/10.0
- ARV discount +1.3/15.0
- Appreciation +0.0/10.0
$235,000
🖨 Deal sheet (PDF) 📄 Offer letter ✓ Due diligence
Listing remarks MLS
VERY CUTE WELL KEPT HOME IN THE HEART OF WEST FORK. AMENITIES INCLUDE: SELLER WARRANTY, STEEL ROOF, GAS STOVE, LAMINATED FLOORS IN LIVING AREA AND HALLWAY, CERAMIC TILE IN KITCHEN AND DINING
Key facts
- New siding
- Lennox hvac
- Pella windows
Tags
Property features AI
Finance
- HOA & community: Monthly association fee; Community park
Exterior
- Parking: Attached carport (1 covered space); Has carport
- Security: Smoke detector(s)
- Utilities: Cable available; Natural gas available; Public sewer; Public water
- Home design: Single-story; 25+ years old
- Construction: Brick and vinyl siding exterior; Metal roof; Slab foundation
- Exterior features: Concrete driveway; Patio (stone); Corner lot; Landscaped yard; Level lot; Near park; Open lot; Subdivision; Public road frontage; Back yard fencing (chain link, partial)
Interior
- Kitchen: Gas cooktop; Range hood; Microwave; Disposal; Counter top
- Flooring: Carpet; Luxury vinyl plank; Tile
- Bathrooms: 1 full bathroom; 1 half bathroom
- Heating & cooling: Central heating (gas); Central air conditioning (electric)
- Interior features: Double pane windows; Ceiling fan(s)
- Laundry & utility: Washer hookup; Dryer hookup; Washer; Dryer; Electric water heater
Neighborhood map
What this means for you Summary
Snapshot
- This is a 3-bed/1.5-bath single-family listed at $235k.
Deal economics
- At list price, monthly cash flow is $785 ($9k/yr) — positive.
- The deal already cash-flows at list — no discount required.
- Meets the 1% rule at list price ($3k rent vs $235k).
- Cap rate 10.3% vs local median 5.2% in West Fork — top-decile yield for the area; either an underpriced asset or a hidden risk that comps aren't pricing in. Stress-test before assuming the spread holds.
Location & tenants
- Location reads 66/100 on livability (#126 in AR) — a middle-class / working-renter tenant base. Strengths: crime A+, cost of living A+, housing A+; Watch: amenities F, commute F, health & safety F.
- West Fork School District (rural): math 23% / reading 26% proficiency, ranked #182 of 238 in AR (top 76%) — low school quality limits family demand, transient renter base, plan for 1-2y turnover.
- Zoned schools: West Fork Elementary School (math 37% / reading 22%, grade F, #305 of 454 statewide, top 71%, 340 students, 54% FRL); West Fork Middle School (math 24% / reading 24%, grade F, #170 of 201 statewide, top 86%, 241 students, 47% FRL); West Fork High School (math 12% / reading 32%, grade F, #213 of 292 statewide, top 77%, 291 students, 42% FRL) — zoned schools at 47% FRL track the district average.
- Market conditions: 75 active listings in the ZIP; 3,494 units permitted in Washington County in 2024 (1,497 in 5+ unit buildings).
Forward outlook
- Local home prices are declining (-3.0%/yr); year-one equity from $2k of loan paydown is wiped out by about $7k of value loss. Plan a longer hold.
- Washington County population projected at +47% by 2050 — long-run rental-demand tailwind backs the buy-and-hold thesis.
- At projected returns (-3.0% appreciation + 3.0% rent growth), your $66k cash investment doubles in ~9 years — after that, you're playing with house money.
Negotiation context
- Only 4 days on market — expect competitive offers; lowballing is unlikely to land.
- 2 sale attempts since 11y ago with the ask held roughly flat each time — persistent listings suggest the price (not the market) is what's stuck; bring a comps-based counter.
- Current owner paid $91k; list at $235k implies a 158% gain — meaningful room to come down on a strong offer.
Risks & watch-outs
- Climate carrying-cost: moderate wildfire risk; extreme-heat days projected 7→22/yr by 2055 (HVAC capex compounding) — expect insurance premiums to compound above CPI over the hold.
Questions for the listing agent
- Built in 1973 — when were the roof, HVAC, electrical panel, plumbing, and water heater last replaced?
- Is there a deadline driving the sale (1031 exchange, divorce, estate, relocation)? That informs how much negotiation room exists.
- Schools are D-rated, which usually means shorter tenancies and higher turnover. Who's the typical renter profile here, and what's been the actual vacancy rate?
- What's the average days-on-market for RENTAL listings here right now (not sales)? A rising rental-DOM trend means longer vacancies and softer asking-rent achievability than the comps imply.
- What's the recent tenant-quality profile in this submarket — average credit score on applications, eviction rate, late-payment / NSF rate, and stable-employment percentage? A property-management company in the area should have these aggregated.
- How much new for-sale + rental construction is in the pipeline within 1–3 miles? Heavy new supply typically softens prices + rents 12–24 months out; constrained supply supports both.
Investment metrics
- 1% rule
- 1.30% ✓
- Cap rate
- 10.30%
- Cash-on-cash
- 14.32%
- DSCR
- 1.64
- GRM
- 6.4
CMA / ARV
- ARV (on-the-fly)
- $206,460
- Comps found
- 12
Show comp detail 12 sales within ~0.75 mi
| Address | Dist | Beds/Ba | Sqft | Sold | Price | $/sf | Match |
|---|---|---|---|---|---|---|---|
| 27 Northwood St | 0.03mi | 3/1.5 | 1,040 (-6%) | 6mo | $205,000 | $197 | 83 |
| 37 Centerwood St | 0.08mi | 3/1.5 | 1,134 (+2%) | 12mo | $199,900 | $176 | 82 |
| 279 N Centennial Ave | 0.05mi | 3/1.0 | 1,052 (-5%) | 11mo | $212,500 | $202 | 78 |
| 63 Dogwood St | 0.30mi | 3/2.0 | 1,216 (+10%) | 1mo | $255,000 | $210 | 67 |
| 212 Redbud Trl | 0.52mi | 3/1.5 | 1,056 (-5%) | 7mo | $160,000 | $152 | 62 |
| 105 Elmwood St | 0.26mi | 3/1.5 | 1,013 (-9%) | 16mo | $195,000 | $192 | 60 |
| 148 Riverwood Ave | 0.27mi | 3/2.0 | 1,223 (+10%) | 13mo | $223,000 | $182 | 58 |
| 149 Riverwood Ave | 0.30mi | 3/2.0 | 1,185 (+7%) | 20mo | $250,000 | $211 | 56 |
| 193 Westwood Ave | 0.21mi | 3/2.0 | 1,263 (+14%) | 12mo | $235,000 | $186 | 55 |
| 74 Pleasant St | 0.41mi | 3/1.0 | 1,188 (+7%) | 15mo | $220,000 | $185 | 54 |
| 126 Pleasant St | 0.43mi | 3/2.0 | 1,272 (+15%) | 2mo | $229,000 | $180 | 52 |
| 82 Main St | 0.58mi | 3/2.0 | 1,072 (-3%) | 20mo | $198,600 | $185 | 49 |
Match score weights: distance 35% · size 25% · config 20% · recency 20%. Top-matched comps best support the ARV.
Projected returns pro-forma
-3.0% appreciation · 3.0% rent growth · sell at horizon
- IRR
- 4.7%
- Equity multiple
- 1.18×
- Total profit
- $11,990
- Equity at exit
- $35,039
- IRR
- 14.2%
- Equity multiple
- 2.14×
- Total profit
- $75,042
- Equity at exit
- $20,319
Cash invested: $65,800 (down + closing). Projections, not guarantees.
Landlord ↔ Tenant lean methodology
- Overall (STATE)
- 92 Strongly Landlord-Friendly
- State Arkansas
- 92 Strongly Landlord-Friendly · R+14
- County
- — inherits STATE
- City
- — inherits STATE
ZIP-level market 72774
- Home prices YoY
- -16.0%
- Active inventory
- 75
- Price-to-rent
- 6.4×
Monthly cashflow live
- Estimated rent
- $3,050 medium interval (Pro) →
- Mortgage (P&I)
- −$1,232
- Tax est. 1.5%
- −$294 /mo · $3,525/yr
- Insurance
- −$98
- HOA
- −$0
- Vacancy / Maint / Mgmt
- −$640
- Net cashflow
- $785
Break-even live
Sensitivity live
| Price | -10% $948 | -5% $867 | +0% $785 | +5% $704 | +10% $623 |
|---|---|---|---|---|---|
| Rent | -10% $544 | -5% $665 | +0% $785 | +5% $906 | +10% $1,026 |
| Rate | -1.0pp $904 | -0.5pp $845 | base $785 | +0.5pp $725 | +1.0pp $663 |
UW: 25.0% down · 7.5% · 30yr · 1.5% tax · 5.0% vac · 8.0% maint · 8.0% mgmt
Financing live
Cash to close
- Down payment
- $58,750
- Closing costs
- $7,050
- Reserves months
- —
- Total cash needed
- —
Loan-product check · same deal, 3 products live
Conventional
25% down · 7.5% · 30yr
- Down + closing
- —
- Monthly P&I
- —
- Monthly cashflow
- —
- DSCR
- —
- Eligible?
- —
Personal DTI + credit; lowest rate.
DSCR
20% down · 8.5% · 30yr
- Down + closing
- —
- Monthly P&I
- —
- Monthly cashflow
- —
- DSCR
- —
- Eligible?
- —
No personal income docs; deal must DSCR.
Hard money
10% down · 12.0% · 12mo
- Down + closing
- —
- Monthly P&I
- —
- Monthly cashflow
- —
- DSCR
- —
- Eligible?
- —
Short-term bridge; refi at stabilization.
Listing history 3 events
-
2026-06-22days on market $235,000 Active 4 DOM
-
2026-06-17remarks 434-char remark
-
2026-06-17$235,000 Active 1 DOM
ⓘ Source: listings_history table (triggers on properties + properties_extension) + one-shot
backfill from property_details.listing_events for pre-trigger history.
Climate risk First Street
- Flood 1/10 Low FEMA zone X (unshaded) · 0% chance over 30 yrs
- Wildfire 5/10 Major
- Heat 5/10 Major 7 d/yr ≥103°F today · 22 d/yr by 30 yrs out
- Wind 2/10 Low 2% chance of damaging wind over 30 yrs
- Air quality 2/10 Low 0 unhealthy d/yr today · 1 by 30 yrs out
Nearby sold comps map
Loading sold comps map…
Walkable amenities ~0.75 mi
Loading nearby amenities…
Taxation est. · year 1
- Rental income
- $36,599
- − Mortgage interest
- −$13,164
- − Property taxes
- −$3,525
- − Insurance
- −$1,175
- − Repairs & maintenance
- −$2,928
- − Management
- −$2,928
- − Depreciation
- −$6,836
- Taxable income
- $6,043
- Est. tax owed @ 24.0%
- −$1,450
- After-tax cash flow
- $7,975/yr
For passive investors: Depreciation is non-cash, so a rental often shows a tax loss while cash-flowing — sheltering income. Rental losses are passive: they offset passive income freely, and up to $25,000/yr can offset ordinary (W-2) income if you actively participate and your MAGI is under $100k (phasing out to $0 by $150k); unused losses carry forward. On sale, claimed depreciation is recaptured at up to 25%, and gains may owe capital-gains tax (a 1031 exchange can defer both). Figures are a year-1 estimate at your 24.0% rate — not tax advice; consult a CPA.
Schools (NCES district)
- District
- West Fork School District
- NCES district ID
- 0514010
- Math proficiency
- 23% ▼ -20.00%
- Reading proficiency
- 26% ▼ -16.00%
- Median HH income
- $46,044
- Composite
- 21.26/100
- National rank
- #8396
- State rank
- #182 of 238 in AR
Livability — West Fork
- Score
- 66/100
- State rank
- #126
- US rank
- #11748
Category grades
Schools grade is shown separately in the Schools card above.
Census & demographics
- Census place
- West Fork, AR
- Population (ZIP)
- 7,298
Population outlook (Washington County) Hauer SSP2
- Today (2025)
- 271,748 people
- By 2030
- 296,414 · +9.1%
- By 2040
- 346,874 · +27.6%
- By 2050
- 398,552 · +46.7%
- By 2075
- 523,309 · +92.6%
- By 2100
- 615,280 · +126.4%
Race, ethnicity, and origin ACS 2023
- Neighborhood character
- Predominantly White (73%)
- Race & ethnicity
- White 73% Two or more races 19% Hispanic / Latino 6% Asian 2% Native American 2%
- Hispanic origin (detail)
- Mexican 4%
- Common ancestry
- Slovak 6% Italian 5% Iranian 3%
- Foreign-born
- 4% · China, Canada, South Korea
- Languages at home
- 97% English-only · Spanish 1% Chinese 1%
Political lean MEDSL · Washington
- 2024 margin
- Lean R (+6.7) · D 45.1% · R 51.7% · Other 3.2%
- 2008→2024 swing
- +6.4pp toward D · 2008: -13.1pp · 2024: -6.7pp
- All cycles
- 2024: R+6.7 2020: R+3.9 2016: R+10.4 2012: R+16.3 2008: R+13.1
Not yet ingested
- Civics
- —
Market trends
- HPI YoY
- ▼ -50.93%
- Current HPI
- 267.4622
- Rent YoY
- —
- Metro
- —
- State GDP YoY
- ▲ 3.80%
- F500 in state
- 10
Industry mix (Fortune 500 HQ in AR)
| Industry | F500 HQs | Revenue |
|---|---|---|
| Retail | 1 | $681B |
|
||
| Food / Agriculture | 1 | $53B |
|
||
| Retail / Energy | 1 | $22B |
|
||
| Transportation / Logistics | 1 | $12B |
|
||
| Energy | 1 | $4B |
|
||
Price history
+552.8% since first listed7 events — show timeline
- 2026-06-17 Listed $235,000 NWARMLS
- 2015-06-16 Sold (Public Records) $91,000 Public Records
- 2015-06-09 Sold (MLS) $91,000 NWARMLS
- 2015-01-21 Listed $92,500 NWARMLS
- 2008-12-01 Sold (Public Records) $84,000 Public Records
- 1995-10-26 Sold (Public Records) $45,000 Public Records
- 1988-01-08 Sold (Public Records) $36,000 Public Records
Property tax history
+0.2%/yrLatest (2025): $368 · -13.6% YoY. Source: county tax records.
Cash-flow waterfall
monthlySold comps — $/sqft
last 12 mo · ≤1 miLoading sold comps…