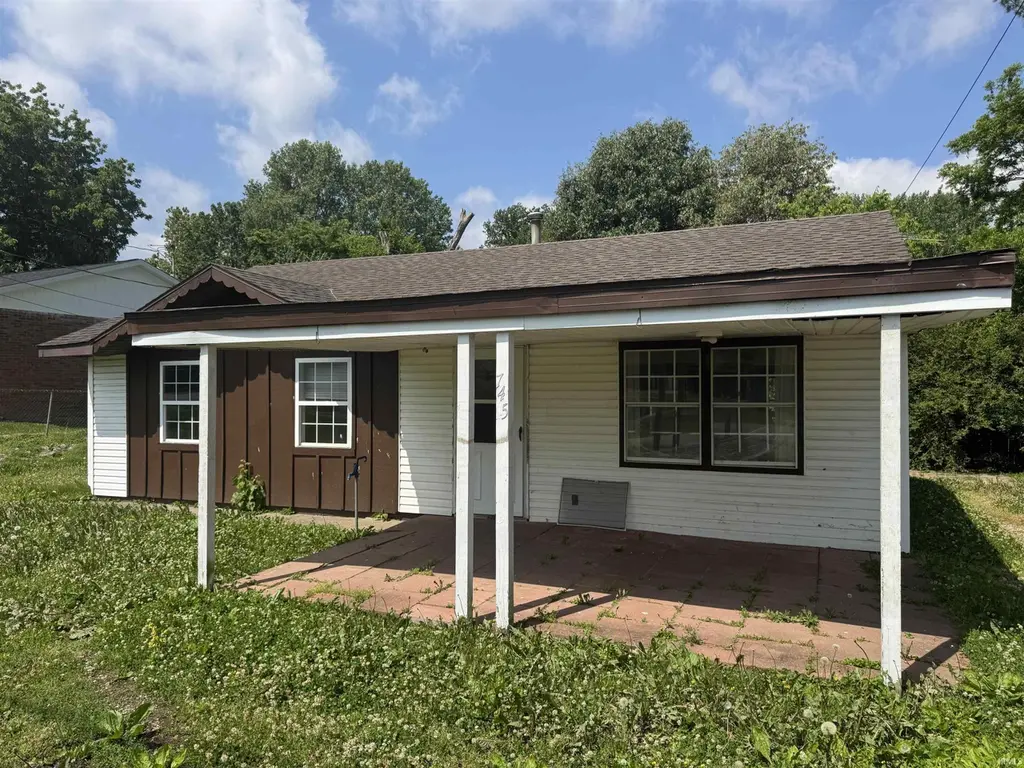
745 Jim Haaff Blvd · Rockport, IN
Flood risk 6/10 · Moderate
- FEMA flood zone
- X (unshaded)
- Chance of flooding over 30 yrs
- 0.69%
- Est. flood insurance / yr
- $507 – $1,088
Fire risk 1/10 · Minimal
- Est. fire insurance / yr
- $717 – $1,331
Heat risk 5/10 · Moderate
- Hot days now (above 107°F)
- 7 days/yr
- Hot days in 30 yrs
- 19 days/yr
Wind risk 2/10 · Minimal
- Chance of severe wind over 30 yrs
- 3.0%
Air-quality risk 3/10 · Minor
- Unhealthy air days now
- 2 days/yr
- Unhealthy air days in 30 yrs
- 3 days/yr
Risk factors via First Street. Map © Google.
Why this score? — see what drove the D+ grade
The composite is a weighted blend of 9 inputs, each scored 0–100. Each bar is that input's sub-score; the figure is the points it added to the 100-point composite (weight × sub-score).
- Cash flow +15.0/30.0
- ARV discount +7.5/15.0
- 1% rule +5.0/10.0
- DSCR +5.0/10.0
- Schools +4.2/10.0
- Livability +3.2/5.0
- Appreciation +2.5/10.0
- Rent growth +2.5/5.0
- Condition / age +2.5/5.0
$35,900
🖨 Deal sheet 📄 Offer letter ✓ Due diligence
Listing remarks
Great investment opportunity! This 3 bedroom, one bathroom home is situated on a 1/4 acre lot in a great Rockport location. Home has two living/family rooms and the potential for a 4th bedroom/bathroom. Home is sold As-Is.
Key facts
- 0.26 acre lot
- Built 1965
- Listed 30 days
Property features AI
Finance
- Other: Directions: From Hwy 66 eastbound, right on Jim Haaff; home is the 5th house on the right.
- Financial info: Tax information provided separately
- HOA & community: No subdivision
Exterior
- Parking: Parking details not specified
- Security: Security details not specified
- Utilities: Public water; Public sewer
- Home design: Single-story single family residence; Site-built home
- Construction: Vinyl siding; Built with site-built construction; Above-grade finished area reported (size not listed in this section)
- Exterior features: Level lot; Outbuilding on the property; Lot dimensions approximately 72 x 153; Lot about 0.26 acres
Interior
- Kitchen: Kitchen details not specified
- Bedrooms: Bedroom count not specified
- Flooring: Flooring details not specified
- Bathrooms: 1 full bathroom; 1 main-level bathroom
- Heating & cooling: Central air conditioning; Forced air heating
- Interior features: Total of 5 rooms; Crawl space basement
- Laundry & utility: Laundry on the main level
Neighborhood map
What this means for you Summary
Snapshot
- This is a 3-bed/1.0-bath single-family listed at $36k.
Deal economics
- At list price, monthly cash flow is $1k ($12k/yr) — positive.
- The deal already cash-flows at list — no discount required.
- Meets the 1% rule at list price ($2k rent vs $36k).
- Recommended offer: $35k (1.5% below list) — sets the bar for market timing.
Location & tenants
- Location reads 64/100 on livability (#403 in IN) — a middle-class / working-renter tenant base. Strengths: crime A+, cost of living A+, housing A+; Watch: amenities F, commute F, employment D-.
- South Spencer County School Corporation (rural): math 46% / reading 54% proficiency, ranked #58 of 301 in IN (top 19%) — acceptable for families but not a draw, mixed tenant base, ~2y average lease.
- Zoned schools: Rockport-Ohio Elementary School (math 52% / reading 52%, grade C-, #237 of 994 statewide, top 26%, 318 students, 61% FRL); South Spencer Middle School (math 39% / reading 52%, grade D+, #79 of 330 statewide, top 24%, 228 students, 56% FRL); South Spencer High School (math 47% / reading 67%, grade C, #64 of 369 statewide, top 18%, 357 students, 44% FRL).
- Market conditions: 33 active listings in the ZIP; 78 units permitted in Spencer County in 2024 (0 in 5+ unit buildings).
Forward outlook
- Local home prices are declining (-3.0%/yr); year-one equity from $248 of loan paydown is wiped out by about $1k of value loss. Plan a longer hold.
- Spencer County population projected at -16% by 2050 — secular population decline; favor cash flow + early exit over multi-decade hold.
- At projected returns (-3.0% appreciation + 3.0% rent growth), your $10k cash investment doubles in ~1 year — after that, you're playing with house money.
Negotiation context
- It's been on market 30 days — a 2% lower offer ($35k) is reasonable based on typical stale-listing flexibility.
Risks & watch-outs
- Climate carrying-cost: major flood risk; extreme-heat days projected 7→19/yr by 2055 (HVAC capex compounding) — expect insurance premiums to compound above CPI over the hold.
Questions for the listing agent
- Built in 1965 — when were the roof, HVAC, electrical panel, plumbing, and water heater last replaced?
- Is there a deadline driving the sale (1031 exchange, divorce, estate, relocation)? That informs how much negotiation room exists.
- Schools are D-rated, which usually means shorter tenancies and higher turnover. Who's the typical renter profile here, and what's been the actual vacancy rate?
- The area grade is low — what's the realistic commute time and amenity access for the typical tenant pool here? Any planned neighborhood developments (good or bad) we should know about?
- What's the average days-on-market for RENTAL listings here right now (not sales)? A rising rental-DOM trend means longer vacancies and softer asking-rent achievability than the comps imply.
- What's the recent tenant-quality profile in this submarket — average credit score on applications, eviction rate, late-payment / NSF rate, and stable-employment percentage? A property-management company in the area should have these aggregated.
- How much new for-sale + rental construction is in the pipeline within 1–3 miles? Heavy new supply typically softens prices + rents 12–24 months out; constrained supply supports both.
Investment metrics
- 1% rule
- 4.47% ✓
- Cap rate
- 40.03%
- Cash-on-cash
- 120.49%
- DSCR
- 6.36
- GRM
- 1.9
CMA / ARV
- ARV (on-the-fly)
- $195,767
- Comps found
- 10
Show comp detail 10 sales within ~0.75 mi
| Address | Dist | Beds/Ba | Sqft | Sold | Price | $/sf | Match |
|---|---|---|---|---|---|---|---|
| 1128 W Cobblefield Dr | 0.26mi | 3/2.0 | 1,337 (-2%) | 1mo | $235,960 | $176 | 79 |
| 930 Sycamore St | 0.20mi | 2/1.0 (-1) | 1,180 (-14%) | 3mo | $118,000 | $100 | 60 |
| 615 Williamson St | 0.46mi | 3/1.0 | 1,243 (-9%) | 4mo | $42,000 | $34 | 59 |
| 840 S Halbruge St | 0.25mi | 3/1.0 | 1,532 (+12%) | 14mo | $145,000 | $95 | 57 |
| 537 N Silverdale Rd | 0.28mi | 3/1.5 | 1,232 (-10%) | 14mo | $212,000 | $172 | 57 |
| 1052 W Cobblefield Dr | 0.20mi | 3/2.0 | 1,239 (-10%) | 18mo | $210,000 | $169 | 56 |
| 798 W State Road 66 Rds | 0.64mi | 3/1.0 | 1,485 (+8%) | 4mo | $212,000 | $143 | 53 |
| 411 Elm Aly | 0.67mi | 2/2.0 (-1) | 1,470 (+7%) | 1mo | $20,000 | $14 | 46 |
| 548 Elm St | 0.56mi | 2/1.0 (-1) | 1,324 (-3%) | 22mo | $146,900 | $111 | 45 |
| 708 Walnut St | 0.63mi | 3/2.0 | 1,320 (-4%) | 23mo | $228,500 | $173 | 42 |
Match score weights: distance 35% · size 25% · config 20% · recency 20%. Top-matched comps best support the ARV.
Projected returns pro-forma
-3.0% appreciation · 3.0% rent growth · sell at horizon
- IRR
- —
- Equity multiple
- 6.82×
- Total profit
- $58,497
- Equity at exit
- $5,353
- IRR
- —
- Equity multiple
- 14.31×
- Total profit
- $133,841
- Equity at exit
- $3,104
Cash invested: $10,052 (down + closing). Projections, not guarantees.
Landlord ↔ Tenant lean methodology
- Overall (STATE)
- 90 Strongly Landlord-Friendly
- State Indiana
- 90 Strongly Landlord-Friendly · R+11
- County
- — inherits STATE
- City
- — inherits STATE
ZIP-level market 47635
- Home prices YoY
- -2.4%
- Active inventory
- 33
- Price-to-rent
- 1.9×
Monthly cashflow live
- Estimated rent
- $1,606 medium interval (Pro) →
- Mortgage (P&I)
- −$188
- Tax from tax record
- −$57 /mo · $679/yr
- Insurance
- −$15
- HOA
- −$0
- Vacancy / Maint / Mgmt
- −$337
- Net cashflow
- $1,009
Break-even live
UW: 25.0% down · 7.5% · 30yr · 1.5% tax · 5.0% vac · 8.0% maint · 8.0% mgmt
Financing live
Cash to close
- Down payment
- $8,975
- Closing costs
- $1,077
- Reserves months
- —
- Total cash needed
- —
Loan-product check · same deal, 3 products live
Conventional
25% down · 7.5% · 30yr
- Down + closing
- —
- Monthly P&I
- —
- Monthly cashflow
- —
- DSCR
- —
- Eligible?
- —
Personal DTI + credit; lowest rate.
DSCR
20% down · 8.5% · 30yr
- Down + closing
- —
- Monthly P&I
- —
- Monthly cashflow
- —
- DSCR
- —
- Eligible?
- —
No personal income docs; deal must DSCR.
Hard money
10% down · 12.0% · 12mo
- Down + closing
- —
- Monthly P&I
- —
- Monthly cashflow
- —
- DSCR
- —
- Eligible?
- —
Short-term bridge; refi at stabilization.
Listing history 17 events
-
2026-06-18days on market $35,900 Active 30 DOM
-
2026-06-17days on market $35,900 Active 29 DOM
-
2026-06-16days on market $35,900 Active 28 DOM
-
2026-06-15days on market $35,900 Active 27 DOM
-
2026-06-14days on market $35,900 Active 25 DOM
-
2026-06-13days on market $35,900 Active 24 DOM
-
2026-06-10days on market $35,900 Active 22 DOM
-
2026-06-09days on market $35,900 Active 21 DOM
-
2026-06-08days on market $35,900 Active 20 DOM
-
2026-06-07days on market $35,900 Active 19 DOM
-
2026-06-05days on market $35,900 Active 16 DOM
-
2026-06-03days on market $35,900 Active 15 DOM
-
2026-06-02days on market $35,900 Active 14 DOM
-
2026-06-01days on market $35,900 Active 13 DOM
-
2026-05-31days on market $35,900 Active 12 DOM
-
2026-05-30days on market $35,900 Active 11 DOM
-
2026-05-19$35,900 Active
ⓘ Source: listings_history table (triggers on properties + properties_extension) + one-shot
backfill from property_details.listing_events for pre-trigger history.
Tax reassessment forecast IN · Partial reset (capped growth)
- Current annual tax
- $679 · $57/mo
- Projected year-2 tax
- $679 · $57/mo
- Expected delta
- $0/yr ($0/mo · 0.0%)
ⓘ Screening estimate from a state-policy table — verify with the county assessor before closing.
Climate risk First Street
- Flood 6/10 Major FEMA zone X (unshaded) · 69% chance over 30 yrs
- Wildfire 1/10 Low
- Heat 5/10 Major 7 d/yr ≥107°F today · 19 d/yr by 30 yrs out
- Wind 2/10 Low 3% chance of damaging wind over 30 yrs
- Air quality 3/10 Moderate 2 unhealthy d/yr today · 3 by 30 yrs out
Nearby sold comps map
Loading sold comps map…
Walkable amenities ~0.75 mi
Loading nearby amenities…
Taxation est. · year 1
- Rental income
- $19,277
- − Mortgage interest
- −$2,011
- − Property taxes
- −$679
- − Insurance
- −$180
- − Repairs & maintenance
- −$1,542
- − Management
- −$1,542
- − Depreciation
- −$1,044
- Taxable income
- $12,279
- Est. tax owed @ 24.0%
- −$2,947
- After-tax cash flow
- $9,165/yr
For passive investors: Depreciation is non-cash, so a rental often shows a tax loss while cash-flowing — sheltering income. Rental losses are passive: they offset passive income freely, and up to $25,000/yr can offset ordinary (W-2) income if you actively participate and your MAGI is under $100k (phasing out to $0 by $150k); unused losses carry forward. On sale, claimed depreciation is recaptured at up to 25%, and gains may owe capital-gains tax (a 1031 exchange can defer both). Figures are a year-1 estimate at your 24.0% rate — not tax advice; consult a CPA.
Schools (NCES district)
- District
- South Spencer County School Corporation
- NCES district ID
- 1810560
- Math proficiency
- 46% ▼ -6.00%
- Reading proficiency
- 54% ▼ -2.00%
- Median HH income
- $47,220
- Composite
- 42.49/100
- National rank
- #3208
- State rank
- #58 of 301 in IN
Livability — Rockport
- Score
- 64/100
- State rank
- #403
- US rank
- #14750
Category grades
Schools grade is shown separately in the Schools card above.
Census & demographics
- Census place
- Rockport, IN
- Population (ZIP)
- 5,578
Population outlook (Spencer County) Hauer SSP2
- Today (2025)
- 20,394 people
- By 2030
- 19,912 · -2.4%
- By 2040
- 18,592 · -8.8%
- By 2050
- 17,051 · -16.4%
- By 2075
- 14,010 · -31.3%
- By 2100
- 10,869 · -46.7%
Race, ethnicity, and origin ACS 2023
- Neighborhood character
- Predominantly White (93%)
- Race & ethnicity
- White 93% Two or more races 3% Hispanic / Latino 2% Black 1%
- Common ancestry
- Italian 3% Scottish 2% Iranian 2%
- Foreign-born
- 1% · China, Canada
- Languages at home
- 99% English-only · Spanish 1%
Political lean MEDSL · Spencer
- 2024 margin
- Solid R (+43.3) · D 27.4% · R 70.6% · Other 2.0%
- 2008→2024 swing
- -43.6pp toward R · 2008: 0.4pp · 2024: -43.3pp
- All cycles
- 2024: R+43.3 2020: R+38.5 2016: R+37.3 2012: R+15.3 2008: D+0.4
Not yet ingested
- Civics
- —
Market trends
- HPI YoY
- ▼ -4.91%
- Current HPI
- 199.6703
- Rent YoY
- —
- Metro
- —
- State GDP YoY
- ▲ 2.90%
- F500 in state
- 18
Industry mix (Fortune 500 HQ in IN)
| Industry | F500 HQs | Revenue |
|---|---|---|
| Industrial Machinery | 2 | $37B |
|
||
| Healthcare | 1 | $177B |
|
||
| Pharmaceuticals | 1 | $45B |
|
||
| Metals / Steel | 1 | $18B |
|
||
| Agriculture | 1 | $17B |
|
||
| Packaging | 1 | $12B |
|
||
Price history
1 event — show timeline
- 2026-05-19 Listed $35,900 IRMLS
Property tax history
+7.7%/yrLatest (2024): $679 · -3.9% YoY. Source: county tax records.
Cash-flow waterfall
monthlySold comps — $/sqft
last 12 mo · ≤1 miLoading sold comps…