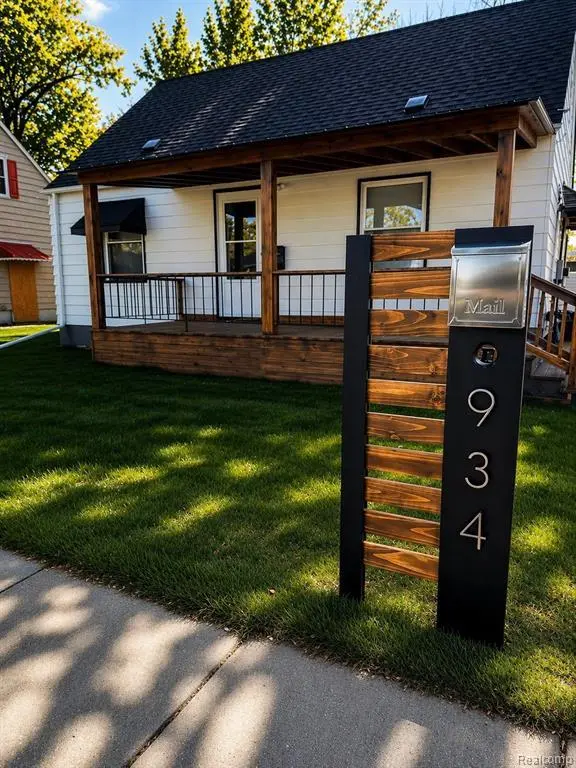
934 Campbell St · Flint, MI
Flood risk 1/10 · Minimal
- FEMA flood zone
- X (unshaded)
- Chance of flooding over 30 yrs
- 0.0%
- Est. flood insurance / yr
- $507 – $1,088
Fire risk 1/10 · Minimal
- Est. fire insurance / yr
- $784 – $1,456
Heat risk 2/10 · Minimal
- Hot days now (above 97°F)
- 7 days/yr
- Hot days in 30 yrs
- 15 days/yr
Wind risk 2/10 · Minimal
- Chance of severe wind over 30 yrs
- —
Air-quality risk 3/10 · Minor
- Unhealthy air days now
- 3 days/yr
- Unhealthy air days in 30 yrs
- 4 days/yr
Risk factors via First Street. Map © Google.
Why this score? — see what drove the D- grade
The composite is a weighted blend of 9 inputs, each scored 0–100. Each bar is that input's sub-score; the figure is the points it added to the 100-point composite (weight × sub-score).
- Cash flow +18.7/30.0
- DSCR +5.9/10.0
- 1% rule +5.0/10.0
- Livability +3.7/5.0
- Condition / age +2.5/5.0
- Rent growth +2.2/5.0
- Schools +1.1/10.0
- ARV discount +0.0/15.0
- Appreciation +0.0/10.0
$89,000
🖨 Deal sheet (PDF) 📄 Offer letter ✓ Due diligence
Listing remarks MLS
Don't miss your opportunity to own this beautifully remodeled, move-in ready home offering modern updates and peace of mind for its next owner. Recent improvements include a new roof, updated plumbing and electrical, new flooring, a beautifully remodeled kitchen, and an updated bathroom, along with additional upgrades throughout. Conveniently located near major roads, shopping, and everyday amenities, this well-priced property is ideal for a first-time homebuyer or an investor seeking a strong, turnkey opportunity. Homes like this do not last.
Key facts
- 5,663 sq ft lot
- Garage
- Built 1947
Property features AI
Exterior
- Parking: Detached 1-car garage
- Utilities: Public water; Public sewer
- Home design: Single-family residence; Two levels; Ground-level entry with steps
- Construction: Metal siding; Block foundation
- Exterior features: Paved road access; Lot dimensions approximately 52.5 x 10⁵ (0.13 acres)
Interior
- Bathrooms: 1 full bathroom
- Heating & cooling: Forced air heating; Natural gas and propane heating sources; No central cooling
- Interior features: Unfinished basement; Total of 4 rooms
Neighborhood map
What this means for you Summary
Snapshot
- This is a 2-bed/1.0-bath single-family listed at $89k.
Deal economics
- At list price, monthly cash flow is $87 ($1k/yr) — positive.
- The deal already cash-flows at list — no discount required.
- To meet the 1% rule (rent ≥ 1% of price), the offer needs to be $89k (0.5% below list).
- Recommended offer: $89k (0.5% below list) — sets the bar for 1% rule.
- Cap rate 7.5% vs local median 11.6% in Flint — below-typical yield; the buyer is paying a premium for something (appreciation thesis, condition, location) that the cap rate doesn't capture.
Location & tenants
- Location reads 74/100 on livability (#196 in MI, #4,946 nationally) — a middle-class / working-renter tenant base. Strengths: commute A+, cost of living A+, housing A+; Watch: crime F, employment F.
- Flint School District (urban): math 7% / reading 13% proficiency, ranked #714 of 760 in MI (top 94%) — low school quality limits family demand, transient renter base, plan for 1-2y turnover; 83% free/reduced lunch — lower-income household profile, screen leases tightly.
- Zoned schools: Holmes Stem Middle School Academy (math 10% / reading 30%, grade F, #420 of 493 statewide, top 86%, 324 students, 90% FRL).
- Market conditions: Rents soft (-1.0%/yr); 207 active listings in the ZIP; 5 comparable units currently listed for rent nearby; rentals at typical pace (median 15d on market — plan ~3-4 weeks tenant-placement turnaround); 419 units permitted in Genesee County in 2024 (68 in 5+ unit buildings).
Forward outlook
- Local home prices are declining (-3.0%/yr); year-one equity from $615 of loan paydown is wiped out by about $3k of value loss. Plan a longer hold.
- Genesee County population projected at -27% by 2050 — secular population decline; favor cash flow + early exit over multi-decade hold.
Negotiation context
- Only 14 days on market — expect competitive offers; lowballing is unlikely to land.
- 2 sale attempts with the ask held roughly flat each time — persistent listings suggest the price (not the market) is what's stuck; bring a comps-based counter.
Risks & watch-outs
- Watch-outs: built in 1947 — expect roof / HVAC / electrical / plumbing capex.
Questions for the listing agent
- Built in 1947 — when were the roof, HVAC, electrical panel, plumbing, and water heater last replaced?
- Is there a deadline driving the sale (1031 exchange, divorce, estate, relocation)? That informs how much negotiation room exists.
- Schools are F-rated, which usually means shorter tenancies and higher turnover. Who's the typical renter profile here, and what's been the actual vacancy rate?
- Crime grade is F in this area — have there been break-ins, vandalism, or insurance claims at this property in the last 3 years? What carrier currently insures it and at what premium?
- The area grade is low — what's the realistic commute time and amenity access for the typical tenant pool here? Any planned neighborhood developments (good or bad) we should know about?
- What's the average days-on-market for RENTAL listings here right now (not sales)? A rising rental-DOM trend means longer vacancies and softer asking-rent achievability than the comps imply.
- What's the recent tenant-quality profile in this submarket — average credit score on applications, eviction rate, late-payment / NSF rate, and stable-employment percentage? A property-management company in the area should have these aggregated.
- How much new for-sale + rental construction is in the pipeline within 1–3 miles? Heavy new supply typically softens prices + rents 12–24 months out; constrained supply supports both.
Investment metrics
- 1% rule
- 1.00% ✗
- Cap rate
- 7.47%
- Cash-on-cash
- 4.20%
- DSCR
- 1.19
- GRM
- 8.4
CMA / ARV
- ARV (on-the-fly)
- $69,300
- Comps found
- 12
Show comp detail 12 sales within ~0.75 mi
| Address | Dist | Beds/Ba | Sqft | Sold | Price | $/sf | Match |
|---|---|---|---|---|---|---|---|
| 934 Campbell St | 0.00mi | 3/1.0 (+1) | 924 (0%) | 1mo | $89,000 | $96 | 94 |
| 3805 Brunswick Ave | 0.08mi | 3/1.0 (+1) | 921 (-0%) | 4mo | $25,000 | $27 | 88 |
| 1105 Lincoln Ave | 0.22mi | 2/1.0 | 896 (-3%) | 2mo | $38,000 | $42 | 84 |
| 737 Campbell St | 0.22mi | 3/1.0 (+1) | 947 (+2%) | 5mo | $84,700 | $89 | 76 |
| 727 Waldman Ave | 0.26mi | 3/1.0 (+1) | 956 (+4%) | 5mo | $79,600 | $83 | 73 |
| 1514 W Atherton Rd | 0.43mi | 3/1.0 (+1) | 925 (+0%) | 2mo | $35,000 | $38 | 73 |
| 1514 Vermilya Ave | 0.49mi | 2/1.0 | 952 (+3%) | 0mo | $66,000 | $69 | 72 |
| 1413 Waldman Ave | 0.38mi | 3/1.0 (+1) | 903 (-2%) | 4mo | $99,900 | $111 | 70 |
| 912 Markham St | 0.40mi | 2/1.0 | 1,020 (+10%) | 4mo | $71,000 | $70 | 61 |
| 1902 Crestbrook Ln | 0.55mi | 3/1.0 (+1) | 969 (+5%) | 1mo | $111,000 | $115 | 60 |
| 839 Barrie Ave | 0.47mi | 2/1.0 | 816 (-12%) | 3mo | $35,000 | $43 | 56 |
| 1418 Blueberry Ln | 0.40mi | 3/1.0 (+1) | 1,045 (+13%) | 4mo | $78,000 | $75 | 51 |
Match score weights: distance 35% · size 25% · config 20% · recency 20%. Top-matched comps best support the ARV.
Projected returns pro-forma
-3.0% appreciation · 0.0% rent growth · sell at horizon
- IRR
- -13.2%
- Equity multiple
- 0.54×
- Total profit
- $-11,455
- Equity at exit
- $13,270
- IRR
- -9.7%
- Equity multiple
- 0.49×
- Total profit
- $-12,812
- Equity at exit
- $7,695
Cash invested: $24,920 (down + closing). Projections, not guarantees.
Landlord ↔ Tenant lean methodology
- Overall (STATE)
- 62 Landlord-Friendly
- State Michigan
- 62 Landlord-Friendly · EVEN
- County
- — inherits STATE
- City
- — inherits STATE
ZIP-level market 48507
- Rents YoY
- -1.0%
- Active inventory
- 207
- Price-to-rent
- 8.4×
Monthly cashflow live
- Estimated rent
- $886 high interval (Pro) →
- Mortgage (P&I)
- −$467
- Tax from tax record
- −$109 /mo · $1,307/yr
- Insurance
- −$37
- HOA
- −$0
- Vacancy / Maint / Mgmt
- −$186
- Net cashflow
- $87
Break-even live
Sensitivity live
| Price | -10% $138 | -5% $112 | +0% $87 | +5% $62 | +10% $37 |
|---|---|---|---|---|---|
| Rent | -10% $17 | -5% $52 | +0% $87 | +5% $122 | +10% $157 |
| Rate | -1.0pp $132 | -0.5pp $110 | base $87 | +0.5pp $64 | +1.0pp $41 |
UW: 25.0% down · 7.5% · 30yr · 1.5% tax · 5.0% vac · 8.0% maint · 8.0% mgmt
Financing live
Cash to close
- Down payment
- $22,250
- Closing costs
- $2,670
- Reserves months
- —
- Total cash needed
- —
Loan-product check · same deal, 3 products live
Conventional
25% down · 7.5% · 30yr
- Down + closing
- —
- Monthly P&I
- —
- Monthly cashflow
- —
- DSCR
- —
- Eligible?
- —
Personal DTI + credit; lowest rate.
DSCR
20% down · 8.5% · 30yr
- Down + closing
- —
- Monthly P&I
- —
- Monthly cashflow
- —
- DSCR
- —
- Eligible?
- —
No personal income docs; deal must DSCR.
Hard money
10% down · 12.0% · 12mo
- Down + closing
- —
- Monthly P&I
- —
- Monthly cashflow
- —
- DSCR
- —
- Eligible?
- —
Short-term bridge; refi at stabilization.
Rent comps 5 comps
| Address | Beds | Baths | Sqft | Rent | $/sqft | DOM | Units | Dist |
|---|---|---|---|---|---|---|---|---|
| 813 Alvord Ave Flint, MI | 2.0 | 1.0 | 724 | $850 | $1.17 | 15d | 1 | 0.24mi |
| 1426 Pettibone Ave Flint, MI | 2.0 | 1.0 | 750 | $900 | $1.20 | 22d | 1 | 0.42mi |
| 1023 Barrie Ave Flint, MI | 2.0 | 1.0 | 660 | $775 | $1.17 | 22d | 1 | 0.46mi |
| 4400 Kings Ln Burton, MI | 1.0–2.0 | 1.0–2.0 | 666 | $960 | $1.44 | 15d | 19 | 0.61mi |
| 410 Lippincott Blvd Flint, MI | 2.0 | 1.0 | 800 | $695 | $0.87 | 15d | 1 | 1.39mi |
Listing history 4 events
-
2026-04-29status Pending 549-char remark
Show marketing remark (549 chars)
Don't miss your opportunity to own this beautifully remodeled, move-in ready home offering modern updates and peace of mind for its next owner. Recent improvements include a new roof, updated plumbing and electrical, new flooring, a beautifully remodeled kitchen, and an updated bathroom, along with additional upgrades throughout. Conveniently located near major roads, shopping, and everyday amenities, this well-priced property is ideal for a first-time homebuyer or an investor seeking a strong, turnkey opportunity. Homes like this do not last.
-
2026-04-29status Pending
Show marketing remark (549 chars)
Don't miss your opportunity to own this beautifully remodeled, move-in ready home offering modern updates and peace of mind for its next owner. Recent improvements include a new roof, updated plumbing and electrical, new flooring, a beautifully remodeled kitchen, and an updated bathroom, along with additional upgrades throughout. Conveniently located near major roads, shopping, and everyday amenities, this well-priced property is ideal for a first-time homebuyer or an investor seeking a strong, turnkey opportunity. Homes like this do not last.
-
2026-04-16$89,000 Active
-
2026-04-15$89,000 Active 549-char remark
Show marketing remark (549 chars)
Don't miss your opportunity to own this beautifully remodeled, move-in ready home offering modern updates and peace of mind for its next owner. Recent improvements include a new roof, updated plumbing and electrical, new flooring, a beautifully remodeled kitchen, and an updated bathroom, along with additional upgrades throughout. Conveniently located near major roads, shopping, and everyday amenities, this well-priced property is ideal for a first-time homebuyer or an investor seeking a strong, turnkey opportunity. Homes like this do not last.
ⓘ Source: listings_history table (triggers on properties + properties_extension) + one-shot
backfill from property_details.listing_events for pre-trigger history.
Tax reassessment forecast MI · Partial reset (capped growth)
- Current annual tax
- $1,307 · $109/mo
- Projected year-2 tax
- $1,339 · $112/mo
- Expected delta
- +$32/yr (+$3/mo · 2.4%)
ⓘ Screening estimate from a state-policy table — verify with the county assessor before closing.
Climate risk First Street
- Flood 1/10 Low FEMA zone X (unshaded) · 0% chance over 30 yrs
- Wildfire 1/10 Low
- Heat 2/10 Low 7 d/yr ≥97°F today · 15 d/yr by 30 yrs out
- Wind 2/10 Low
- Air quality 3/10 Moderate 3 unhealthy d/yr today · 4 by 30 yrs out
Nearby sold comps map
Loading sold comps map…
Walkable amenities ~0.75 mi
Loading nearby amenities…
Taxation est. · year 1
- Rental income
- $10,631
- − Mortgage interest
- −$4,985
- − Property taxes
- −$1,307
- − Insurance
- −$445
- − Repairs & maintenance
- −$850
- − Management
- −$850
- − Depreciation
- −$2,589
- Taxable loss
- −$396
- Est. tax savings @ 24.0%
- +$95
- After-tax cash flow
- $1,141/yr
For passive investors: Depreciation is non-cash, so a rental often shows a tax loss while cash-flowing — sheltering income. Rental losses are passive: they offset passive income freely, and up to $25,000/yr can offset ordinary (W-2) income if you actively participate and your MAGI is under $100k (phasing out to $0 by $150k); unused losses carry forward. On sale, claimed depreciation is recaptured at up to 25%, and gains may owe capital-gains tax (a 1031 exchange can defer both). Figures are a year-1 estimate at your 24.0% rate — not tax advice; consult a CPA.
Schools (NCES district)
- District
- Flint School District
- NCES district ID
- 2614520
- Math proficiency
- 7% ▬ 0.00%
- Reading proficiency
- 13% ▲ 3.00%
- Median HH income
- $25,954
- Composite
- 10.97/100
- National rank
- #14642
- State rank
- #714 of 760 in MI
Livability — Flint
- Score
- 74/100
- State rank
- #196
- US rank
- #4946
Category grades
Schools grade is shown separately in the Schools card above.
Census & demographics
- Census place
- Flint, MI
- County
- Genesee County · 221,329 people
- City population
- 93,814
- Metro
- Flint, MI
- Population (ZIP)
- 28,723
- Household income
- $46,554
- Rent vs Own
- Severe rent burden
- 1534.0
Population outlook (Genesee County) Hauer SSP2
- Today (2025)
- 381,312 people
- By 2030
- 362,731 · -4.9%
- By 2040
- 321,550 · -15.7%
- By 2050
- 279,212 · -26.8%
- By 2075
- 193,336 · -49.3%
- By 2100
- 128,118 · -66.4%
Race, ethnicity, and origin ACS 2023
- Neighborhood character
- Diverse neighborhood (Simpson 0.57)
- Race & ethnicity
- White 59% Black 28% Two or more races 10% Hispanic / Latino 5%
- Common ancestry
- Lithuanian 4% Romanian 3% Slovak 2%
- Foreign-born
- 1% · Canada
- Languages at home
- 97% English-only · Spanish 1% Other Asian/Pacific 1%
Political lean MEDSL · Genesee
- 2024 margin
- Toss-up / Even · D 51.4% · R 47.2% · Other 1.4%
- 2008→2024 swing
- -28.3pp toward R · 2008: 32.5pp · 2024: 4.2pp
- All cycles
- 2024: D+4.2 2020: D+9.3 2016: D+9.5 2012: D+28.2 2008: D+32.5
Not yet ingested
- Civics
- —
Market trends
- HPI YoY
- ▼ -154.90%
- Current HPI
- 132.3632
- Rent YoY
- ▼ -1.04%
- Metro
- Flint, MI
- State GDP YoY
- ▲ 1.37%
- F500 in state
- 28
Industry mix (Fortune 500 HQ in MI)
| Industry | F500 HQs | Revenue |
|---|---|---|
| Automotive Parts | 3 | $48B |
|
||
| Automotive | 2 | $372B |
|
||
| Chemicals | 1 | $45B |
|
||
| Automotive Retail | 1 | $29B |
|
||
| Healthcare / Medical Devices | 1 | $23B |
|
||
| Automotive Technology | 1 | $20B |
|
||
Price history
+0.0% since first listed4 events — show timeline
- 2026-04-29 Pending — MiRealSource-MiMLS
- 2026-04-29 Pending — REALCOMP
- 2026-04-16 Listed $89,000 REALCOMP
- 2026-04-15 Listed $89,000 MiRealSource-MiMLS
Property tax history
+2.5%/yrLatest (2025): $1,307 · +1.8% YoY. Source: county tax records.
Cash-flow waterfall
monthlySold comps — $/sqft
last 12 mo · ≤1 miLoading sold comps…