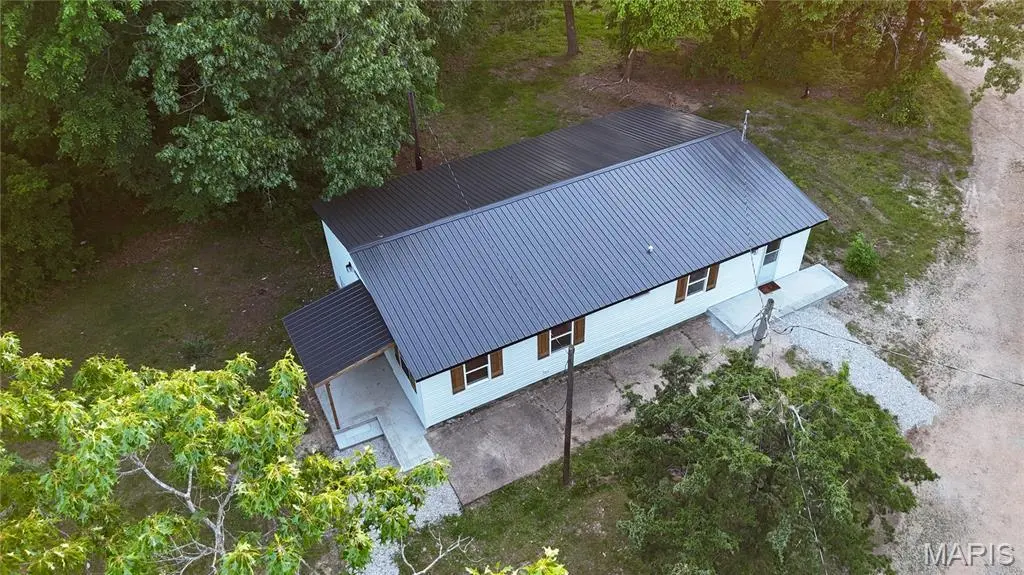
21700 Highway Y · St. Robert, MO
Flood risk 1/10 · Minimal
- FEMA flood zone
- X (unshaded)
- Chance of flooding over 30 yrs
- 0.0%
- Est. flood insurance / yr
- $507 – $1,088
Fire risk 4/10 · Minor
- Est. fire insurance / yr
- $1,054 – $1,958
Heat risk 4/10 · Minor
- Hot days now (above 106°F)
- 7 days/yr
- Hot days in 30 yrs
- 18 days/yr
Wind risk 2/10 · Minimal
- Chance of severe wind over 30 yrs
- 1.0%
Air-quality risk 1/10 · Minimal
- Unhealthy air days now
- 0 days/yr
- Unhealthy air days in 30 yrs
- 0 days/yr
Risk factors via First Street. Map © Google.
Why this score? — see what drove the D- grade
The composite is a weighted blend of 9 inputs, each scored 0–100. Each bar is that input's sub-score; the figure is the points it added to the 100-point composite (weight × sub-score).
- Cash flow +11.5/30.0
- ARV discount +7.5/15.0
- Rent growth +5.0/5.0
- Schools +4.2/10.0
- DSCR +3.4/10.0
- Livability +2.5/5.0
- Condition / age +2.5/5.0
- 1% rule +2.0/10.0
- Appreciation +0.0/10.0
$219,900
🖨 Deal sheet (PDF) 📄 Offer letter ✓ Due diligence
Listing remarks MLS
Investor Special! This 3-bedroom, 1-bathroom home sits on 3 acres with two shops —a rare find with endless potential. The property includes a spacious 2 bay shop, making it ideal for storage, hobbies, or small business use. With plenty of room to expand or renovate, this home is perfect for investors, flippers, or anyone looking to create their dream property. Don’t miss this opportunity to own acreage and a shop right in city limits!
Key facts
- Remodeled
- New exterior siding
- New roof
Tags
Property features AI
Finance
- Other: Workshop on property; Approximately 1.2 acres lot size
Exterior
- Parking: 2-car garage
- Utilities: Public water; Public sewer; Electricity connected (220 volts)
- Home design: Single family residence; One story
- Construction: Frame construction; Metal roof; Basement: cellar, unfinished
- Exterior features: Covered side porch; Private backyard; Adjoins wooded area; Back yard
Interior
- Kitchen: Stainless steel appliances; Dishwasher; Microwave; Electric range; Refrigerator
- Bedrooms: 4 bedrooms on the main level
- Bathrooms: 2 full bathrooms on the main level
- Heating & cooling: Forced air heating; Central air conditioning
- Interior features: Ceiling fans; Kitchen/dining room combo
Neighborhood map
What this means for you Summary
Snapshot
- This is a 3-bed/2.0-bath other listed at $220k.
Deal economics
- At list price, monthly cash flow is $-71 ($-852/yr) — negative.
- To cash-flow at today's rent, offer at most $207k (5.7% below list).
- To meet the 1% rule (rent ≥ 1% of price), the offer needs to be $154k (30.1% below list).
- Recommended offer: $154k (30.1% below list) — sets the bar for 1% rule.
- Cap rate 5.9% vs local median 4.5% in St. Robert — top-decile yield for the area; either an underpriced asset or a hidden risk that comps aren't pricing in. Stress-test before assuming the spread holds.
Location & tenants
- Location reads: area grade D — affects rentability + tenant quality, not the cash-flow math above.
- Waynesville R-VI (town): math 46% / reading 53% proficiency, ranked #41 of 324 in MO (top 13%) — families likely to look elsewhere, expect single-tenant / working-renter base with shorter leases.
- Zoned schools: Freedom Elem. (math 44% / reading 45%, grade F, #413 of 1,115 statewide, top 42%, 961 students, 54% FRL); Waynesville Middle (math 43% / reading 59%, grade C, #62 of 391 statewide, top 16%, 865 students, 45% FRL); Waynesville Sr. High (math 37% / reading 53%, grade D-, #176 of 521 statewide, top 34%, 1,704 students, 39% FRL) — zoned schools average 46% FRL vs 28% district-wide (18 pts higher); higher-poverty schools than district average — tighter screening recommended.
- Market conditions: Rents rising fast (+10.2%/yr); 133 active listings in the ZIP; 1 comparable units currently listed for rent nearby; 62 units permitted in Pulaski County in 2024 (0 in 5+ unit buildings).
Forward outlook
- Local home prices are declining (-3.0%/yr); year-one equity from $2k of loan paydown is wiped out by about $7k of value loss. Plan a longer hold.
Negotiation context
- It's been on market 40 days — a 3% lower offer ($213k) is reasonable based on typical stale-listing flexibility.
- 2 sale attempts with the ask held roughly flat each time — persistent listings suggest the price (not the market) is what's stuck; bring a comps-based counter.
Questions for the listing agent
- What do current leases actually rent for vs. the listed asking? Can we see a recent rent roll and the last 12 months of T-12 income?
- It's been on market 40 days. Have you received any prior offers? Is the seller open to a 30% concession, seller financing, or rate buy-down credit?
- Built in 1970 — when were the roof, HVAC, electrical panel, plumbing, and water heater last replaced?
- Is there a deadline driving the sale (1031 exchange, divorce, estate, relocation)? That informs how much negotiation room exists.
- The area grade is low — what's the realistic commute time and amenity access for the typical tenant pool here? Any planned neighborhood developments (good or bad) we should know about?
- What's the average days-on-market for RENTAL listings here right now (not sales)? A rising rental-DOM trend means longer vacancies and softer asking-rent achievability than the comps imply.
- What's the recent tenant-quality profile in this submarket — average credit score on applications, eviction rate, late-payment / NSF rate, and stable-employment percentage? A property-management company in the area should have these aggregated.
- How much new for-sale + rental construction is in the pipeline within 1–3 miles? Heavy new supply typically softens prices + rents 12–24 months out; constrained supply supports both.
Investment metrics
- 1% rule
- 0.70% ✗
- Cap rate
- 5.91%
- Cash-on-cash
- -1.38%
- DSCR
- 0.94
- GRM
- 11.9
CMA / ARV
No comps found within radius.
Projected returns pro-forma
-3.0% appreciation · 8.0% rent growth · sell at horizon
- IRR
- -14.0%
- Equity multiple
- 0.48×
- Total profit
- $-32,153
- Equity at exit
- $32,788
- IRR
- 0.5%
- Equity multiple
- 1.04×
- Total profit
- $2,653
- Equity at exit
- $19,013
Cash invested: $61,572 (down + closing). Projections, not guarantees.
Landlord ↔ Tenant lean methodology
- Overall (STATE)
- 81 Strongly Landlord-Friendly
- State Missouri
- 81 Strongly Landlord-Friendly · R+10
- County
- — inherits STATE
- City
- — inherits STATE
ZIP-level market 65584
- Home prices YoY
- -18.8%
- Rents YoY
- 10.2%
- Active inventory
- 133
- Price-to-rent
- 11.9×
Monthly cashflow live
- Estimated rent
- $1,537 medium interval (Pro) →
- Mortgage (P&I)
- −$1,153
- Tax from tax record
- −$40 /mo · $482/yr
- Insurance
- −$92
- HOA
- −$0
- Vacancy / Maint / Mgmt
- −$323
- Net cashflow
- $-71
Break-even live
Sensitivity live
| Price | -10% $54 | -5% $-9 | +0% $-71 | +5% $-133 | +10% $-458 |
|---|---|---|---|---|---|
| Rent | -10% $-192 | -5% $-132 | +0% $-71 | +5% $-10 | +10% $50 |
| Rate | -1.0pp $40 | -0.5pp $-15 | base $-71 | +0.5pp $-128 | +1.0pp $-186 |
UW: 25.0% down · 7.5% · 30yr · 1.5% tax · 5.0% vac · 8.0% maint · 8.0% mgmt
Financing live
Cash to close
- Down payment
- $54,975
- Closing costs
- $6,597
- Reserves months
- —
- Total cash needed
- —
Loan-product check · same deal, 3 products live
Conventional
25% down · 7.5% · 30yr
- Down + closing
- —
- Monthly P&I
- —
- Monthly cashflow
- —
- DSCR
- —
- Eligible?
- —
Personal DTI + credit; lowest rate.
DSCR
20% down · 8.5% · 30yr
- Down + closing
- —
- Monthly P&I
- —
- Monthly cashflow
- —
- DSCR
- —
- Eligible?
- —
No personal income docs; deal must DSCR.
Hard money
10% down · 12.0% · 12mo
- Down + closing
- —
- Monthly P&I
- —
- Monthly cashflow
- —
- DSCR
- —
- Eligible?
- —
Short-term bridge; refi at stabilization.
Rent comps 1 comps
| Address | Beds | Baths | Sqft | Rent | $/sqft | DOM | Units | Dist |
|---|---|---|---|---|---|---|---|---|
| 16324 Heartland Ln Saint Robert, MO | 3.0 | 2.0 | 1571 | $1,825 | $1.16 | 45d | 1 | 1.38mi |
Listing history 20 events
-
2026-06-21days on market $219,900 Active 40 DOM
-
2026-06-19days on market $219,900 Active 38 DOM
-
2026-06-18days on market $219,900 Active 37 DOM
-
2026-06-17days on market $219,900 Active 36 DOM
-
2026-06-16days on market $219,900 Active 35 DOM
-
2026-06-15days on market $219,900 Active 34 DOM
-
2026-06-14days on market $219,900 Active 32 DOM
-
2026-06-12pricedays on market $219,900 Active 31 DOM
-
2026-06-09days on market $229,900 Active 28 DOM
-
2026-06-08days on market $229,900 Active 27 DOM
-
2026-06-07days on market $229,900 Active 26 DOM
-
2026-06-07days on market $229,900 Active 25 DOM
-
2026-06-02days on market $229,900 Active 21 DOM
-
2026-06-01days on market $229,900 Active 20 DOM
-
2026-05-31days on market $229,900 Active 19 DOM
-
2026-05-30days on market $229,900 Active 18 DOM
-
2026-05-12$229,900 Active
-
2025-10-02soldstatus Closed 450-char remark
Show marketing remark (450 chars)
Investor Special! This 3-bedroom, 1-bathroom home sits on 3 acres with two shops —a rare find with endless potential. The property includes a spacious 2 bay shop, making it ideal for storage, hobbies, or small business use. With plenty of room to expand or renovate, this home is perfect for investors, flippers, or anyone looking to create their dream property. Don’t miss this opportunity to own acreage and a shop right in city limits!
-
2025-09-02status Pending 450-char remark
Show marketing remark (450 chars)
Investor Special! This 3-bedroom, 1-bathroom home sits on 3 acres with two shops —a rare find with endless potential. The property includes a spacious 2 bay shop, making it ideal for storage, hobbies, or small business use. With plenty of room to expand or renovate, this home is perfect for investors, flippers, or anyone looking to create their dream property. Don’t miss this opportunity to own acreage and a shop right in city limits!
-
2025-08-29$85,000 Active 450-char remark
Show marketing remark (450 chars)
Investor Special! This 3-bedroom, 1-bathroom home sits on 3 acres with two shops —a rare find with endless potential. The property includes a spacious 2 bay shop, making it ideal for storage, hobbies, or small business use. With plenty of room to expand or renovate, this home is perfect for investors, flippers, or anyone looking to create their dream property. Don’t miss this opportunity to own acreage and a shop right in city limits!
ⓘ Source: listings_history table (triggers on properties + properties_extension) + one-shot
backfill from property_details.listing_events for pre-trigger history.
Tax reassessment forecast MO · Resets to sale price
- Current annual tax
- $482 · $40/mo
- Projected year-2 tax
- $2,133 · $178/mo
- Expected delta
- +$1,651/yr (+$138/mo · 342.1%)
ⓘ Screening estimate from a state-policy table — verify with the county assessor before closing.
Climate risk First Street
- Flood 1/10 Low FEMA zone X (unshaded) · 0% chance over 30 yrs
- Wildfire 4/10 Moderate
- Heat 4/10 Moderate 7 d/yr ≥106°F today · 18 d/yr by 30 yrs out
- Wind 2/10 Low 100% chance of damaging wind over 30 yrs
- Air quality 1/10 Low 0 unhealthy d/yr today · 0 by 30 yrs out
Nearby sold comps map
Loading sold comps map…
Walkable amenities ~0.75 mi
Loading nearby amenities…
Taxation est. · year 1
- Rental income
- $18,441
- − Mortgage interest
- −$12,318
- − Property taxes
- −$482
- − Insurance
- −$1,100
- − Repairs & maintenance
- −$1,475
- − Management
- −$1,475
- − Depreciation
- −$6,397
- Taxable loss
- −$4,806
- Est. tax savings @ 24.0%
- +$1,154
- After-tax cash flow
- $302/yr
For passive investors: Depreciation is non-cash, so a rental often shows a tax loss while cash-flowing — sheltering income. Rental losses are passive: they offset passive income freely, and up to $25,000/yr can offset ordinary (W-2) income if you actively participate and your MAGI is under $100k (phasing out to $0 by $150k); unused losses carry forward. On sale, claimed depreciation is recaptured at up to 25%, and gains may owe capital-gains tax (a 1031 exchange can defer both). Figures are a year-1 estimate at your 24.0% rate — not tax advice; consult a CPA.
Schools (NCES district)
- District
- Waynesville R-VI
- NCES district ID
- 2931440
- Math proficiency
- 46% ▼ -1.00%
- Reading proficiency
- 53% ▼ -1.00%
- Median HH income
- $50,147
- Composite
- 42.36/100
- National rank
- #3246
- State rank
- #41 of 324 in MO
Livability — St. Robert
No livability data for this city. (Only ~50 U.S. cities are tracked.)
Census & demographics
- County
- Pulaski County · 25,264 people
- Metro
- Fort Leonard Wood, MO
- Population (ZIP)
- 10,553
- Household income
- $63,328
- Rent vs Own
- Severe rent burden
- 368.0
Population outlook (Pulaski County) Hauer SSP2
- Today (2025)
- 54,214 people
- By 2030
- 54,723 · +0.9%
- By 2040
- 54,885 · +1.2%
- By 2050
- 55,467 · +2.3%
- By 2075
- 58,576 · +8.0%
- By 2100
- 61,179 · +12.8%
Race, ethnicity, and origin ACS 2023
- Neighborhood character
- Diverse neighborhood (Simpson 0.56)
- Race & ethnicity
- White 65% Two or more races 15% Hispanic / Latino 11% Black 10% Asian 4%
- Hispanic origin (detail)
- Mexican 2% Puerto Rican 4%
- Common ancestry
- Slovak 3% Lithuanian 2% Italian 2%
- Foreign-born
- 6% · South Korea, Canada, China
- Languages at home
- 85% English-only · Spanish 5% German/W. Germanic 4% Korean 4%
Political lean MEDSL · Pulaski
- 2024 margin
- Solid R (+50.3) · D 24.2% · R 74.5% · Other 1.3%
- 2008→2024 swing
- -21.6pp toward R · 2008: -28.7pp · 2024: -50.3pp
- All cycles
- 2024: R+50.3 2020: R+45.7 2016: R+51.7 2012: R+36.1 2008: R+28.7
Not yet ingested
- Civics
- —
Market trends
- HPI YoY
- ▼ -30.16%
- Current HPI
- 130.0726
- Rent YoY
- ▲ 10.20%
- Metro
- Fort Leonard Wood, MO
- State GDP YoY
- ▲ 1.84%
- F500 in state
- 20
Industry mix (Fortune 500 HQ in MO)
| Industry | F500 HQs | Revenue |
|---|---|---|
| Healthcare | 1 | $163B |
|
||
| Insurance | 1 | $21B |
|
||
| Industrial Technology | 1 | $17B |
|
||
| Retail | 1 | $16B |
|
||
| Industrial Distribution | 1 | $10B |
|
||
| Utilities | 1 | $9B |
|
||
Price history
+170.5% since first listed4 events — show timeline
- 2026-05-12 Listed $229,900 MARIS as Distributed by MLS Grid
- 2025-10-02 Sold (MLS) — MARIS as Distributed by MLS Grid
- 2025-09-02 Pending — MARIS as Distributed by MLS Grid
- 2025-08-29 Listed $85,000 MARIS as Distributed by MLS Grid
Property tax history
+2.1%/yrLatest (2025): $482 · +5.9% YoY. Source: county tax records.
Cash-flow waterfall
monthlySold comps — $/sqft
last 12 mo · ≤1 miLoading sold comps…