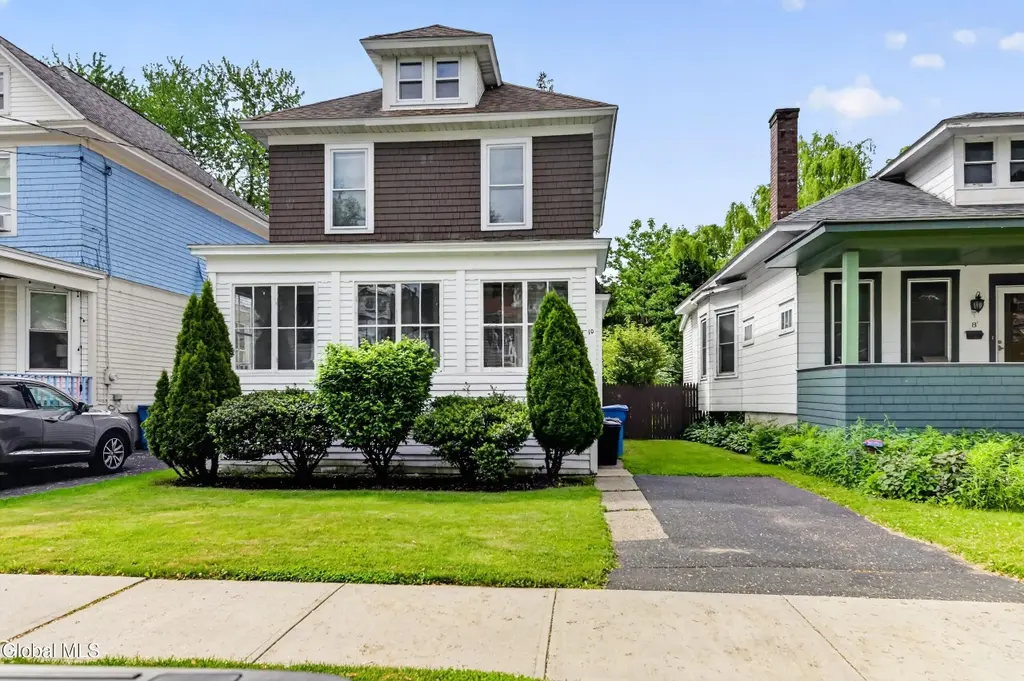
10 Matilda St · Albany, NY
Flood risk 1/10 · Minimal
- FEMA flood zone
- X (unshaded)
- Chance of flooding over 30 yrs
- 0.0%
- Est. flood insurance / yr
- $473 – $860
Fire risk 3/10 · Minor
- Est. fire insurance / yr
- $691 – $1,283
Heat risk 4/10 · Minor
- Hot days now (above 99°F)
- 7 days/yr
- Hot days in 30 yrs
- 16 days/yr
Wind risk 3/10 · Minor
- Chance of severe wind over 30 yrs
- 6.0%
Air-quality risk 1/10 · Minimal
- Unhealthy air days now
- 0 days/yr
- Unhealthy air days in 30 yrs
- 0 days/yr
Risk factors via First Street. Map © Google.
Why this score? — see what drove the C- grade
The composite is a weighted blend of 9 inputs, each scored 0–100. Each bar is that input's sub-score; the figure is the points it added to the 100-point composite (weight × sub-score).
- Cash flow +20.6/30.0
- ARV discount +11.3/15.0
- DSCR +6.6/10.0
- 1% rule +4.3/10.0
- Livability +4.0/5.0
- Schools +3.2/10.0
- Rent growth +2.5/5.0
- Condition / age +2.5/5.0
- Appreciation +0.0/10.0
$219,000
🖨 Deal sheet (PDF) 📄 Offer letter ✓ Due diligence
Listing remarks
Charming three-bedroom, one-bath home just off Whitehall Rd, conveniently close to shops, dining, and transit. Features gas hot water heat, a formal dining room, a spacious living room, and an open foyer with a staircase to the second floor. Enjoy a cozy nook off the kitchen, a full basement, and a semi-private rear yard. home is in an Estate, property sold as-is.
Key facts
- Gas hot water heat
- Formal dining room
- Full basement
Tags
Property features AI
Exterior
- Parking: Driveway with space for 1 vehicle
- Utilities: Public water; Public sewer
- Home design: Single family residence; 35' main road frontage; Lot dimensions approximately 35 x 127
- Construction: Wood siding; Asphalt roof
- Exterior features: Back yard fencing; Level lot
Interior
- Kitchen: Range; Refrigerator
- Bedrooms: Primary bedroom on second floor; Two additional bedrooms on second floor
- Flooring: Vinyl; Carpet; Ceramic tile; Hardwood
- Bathrooms: 1 full bathroom (located on second floor)
- Heating & cooling: Hot water heating; Natural gas heating
- Interior features: 8 total rooms; Full, unfinished basement
- Laundry & utility: Laundry in bathroom
Neighborhood map
What this means for you Summary
Snapshot
- This is a 3-bed/1.0-bath single-family listed at $219k.
Deal economics
- At list price, monthly cash flow is $293 ($4k/yr) — positive.
- The deal already cash-flows at list — no discount required.
- To meet the 1% rule (rent ≥ 1% of price), the offer needs to be $203k (7.2% below list).
- Recommended offer: $203k (7.2% below list) — sets the bar for 1% rule.
- Cap rate 7.9% vs local median 5.7% in Albany — top-decile yield for the area; either an underpriced asset or a hidden risk that comps aren't pricing in. Stress-test before assuming the spread holds.
Location & tenants
- Location reads 79/100 on livability (#129 in NY, #2,083 nationally) — a middle-class / working-renter tenant base. Strengths: amenities A+, commute A+, housing A+; Watch: employment C-, crime F.
- Albany City School District (urban): math 37% / reading 40% proficiency, ranked #543 of 590 in NY (top 92%) — families likely to look elsewhere, expect single-tenant / working-renter base with shorter leases; 66% free/reduced lunch — lower-income household profile, screen leases tightly.
- Zoned schools: Albany High School (math 74% / reading 67%, grade B+, #710 of 1,100 statewide, top 65%, 2,676 students, 69% FRL) — zoned schools at 69% FRL track the district average.
- Zoned-school proficiency averages 70% at this address vs 38% district-wide (+32 pts) — the actual schools serving this property are materially stronger than the Albany City School District average implies; a family-tenant draw the district grade alone would hide.
- Market conditions: 47 active listings in the ZIP; 40 comparable units currently listed for rent nearby; rentals at typical pace (median 24d on market — plan ~3-4 weeks tenant-placement turnaround); 675 units permitted in Albany County in 2024 (451 in 5+ unit buildings).
Forward outlook
- Local home prices are declining (-3.0%/yr); year-one equity from $2k of loan paydown is wiped out by about $7k of value loss. Plan a longer hold.
- Albany County population projected at +9% by 2050 — modest demand growth; plan on rents tracking national, not racing it.
Negotiation context
- Only 5 days on market — expect competitive offers; lowballing is unlikely to land.
Risks & watch-outs
- Watch-outs: built in 1940 — expect roof / HVAC / electrical / plumbing capex.
Questions for the listing agent
- Built in 1940 — when were the roof, HVAC, electrical panel, plumbing, and water heater last replaced?
- Is there a deadline driving the sale (1031 exchange, divorce, estate, relocation)? That informs how much negotiation room exists.
- Crime grade is F in this area — have there been break-ins, vandalism, or insurance claims at this property in the last 3 years? What carrier currently insures it and at what premium?
- What's the average days-on-market for RENTAL listings here right now (not sales)? A rising rental-DOM trend means longer vacancies and softer asking-rent achievability than the comps imply.
- What's the recent tenant-quality profile in this submarket — average credit score on applications, eviction rate, late-payment / NSF rate, and stable-employment percentage? A property-management company in the area should have these aggregated.
- How much new for-sale + rental construction is in the pipeline within 1–3 miles? Heavy new supply typically softens prices + rents 12–24 months out; constrained supply supports both.
Investment metrics
- 1% rule
- 0.93% ✗
- Cap rate
- 7.90%
- Cash-on-cash
- 5.74%
- DSCR
- 1.26
- GRM
- 9.0
CMA / ARV
- ARV (on-the-fly)
- $239,136
- Comps found
- 12
Show comp detail 12 sales within ~0.75 mi
| Address | Dist | Beds/Ba | Sqft | Sold | Price | $/sf | Match |
|---|---|---|---|---|---|---|---|
| 3 Mapleridge Ave | 0.16mi | 3/2.0 | 1,280 (+1%) | 3mo | $255,000 | $199 | 85 |
| 23 Barrows St | 0.38mi | 3/1.5 | 1,312 (+3%) | 6mo | $198,000 | $151 | 71 |
| 415 Second Ave | 0.28mi | 3/1.5 | 1,168 (-8%) | 1mo | $209,000 | $179 | 70 |
| 555 Delaware Ave | 0.23mi | 2/1.0 (-1) | 1,170 (-8%) | 1mo | $210,000 | $179 | 70 |
| 167 Southern Blvd | 0.59mi | 3/2.0 | 1,277 (+0%) | 3mo | $225,000 | $176 | 66 |
| 19 Fordham Ct | 0.70mi | 3/1.5 | 1,263 (-1%) | 1mo | $331,000 | $262 | 64 |
| 484 Delaware Ave | 0.19mi | 2/2.0 (-1) | 1,132 (-11%) | 2mo | $160,000 | $141 | 62 |
| 65 Rose Ct | 0.27mi | 3/2.0 | 1,106 (-13%) | 5mo | $275,000 | $249 | 58 |
| 106 Edgecomb St | 0.30mi | 3/2.0 | 1,101 (-13%) | 4mo | $265,000 | $241 | 56 |
| 19 W Van Vechten St | 0.58mi | 3/1.5 | 1,145 (-10%) | 4mo | $215,000 | $188 | 51 |
| 52 Lawnridge Ave | 0.59mi | 3/2.0 | 1,123 (-12%) | 2mo | $325,000 | $289 | 47 |
| 310 Mccarty Ave | 0.58mi | 2/1.5 (-1) | 1,154 (-9%) | 4mo | $184,000 | $159 | 47 |
Match score weights: distance 35% · size 25% · config 20% · recency 20%. Top-matched comps best support the ARV.
Projected returns pro-forma
-3.0% appreciation · 3.0% rent growth · sell at horizon
- IRR
- -7.5%
- Equity multiple
- 0.72×
- Total profit
- $-16,892
- Equity at exit
- $32,654
- IRR
- 2.1%
- Equity multiple
- 1.15×
- Total profit
- $8,977
- Equity at exit
- $18,935
Cash invested: $61,320 (down + closing). Projections, not guarantees.
Landlord ↔ Tenant lean methodology
- Overall (STATE)
- 15 Strongly Tenant-Friendly
- State New York
- 15 Strongly Tenant-Friendly · D+10
- County
- — inherits STATE
- City
- — inherits STATE
ZIP-level market 12209
- Home prices YoY
- -7.3%
- Active inventory
- 47
- Price-to-rent
- 9.0×
Monthly cashflow live
- Estimated rent
- $2,032 high interval (Pro) →
- Mortgage (P&I)
- −$1,148
- Tax from tax record
- −$72 /mo · $870/yr
- Insurance
- −$91
- HOA
- −$0
- Vacancy / Maint / Mgmt
- −$427
- Net cashflow
- $293
Break-even live
Sensitivity live
| Price | -10% $417 | -5% $355 | +0% $293 | +5% $231 | +10% $169 |
|---|---|---|---|---|---|
| Rent | -10% $133 | -5% $213 | +0% $293 | +5% $374 | +10% $454 |
| Rate | -1.0pp $404 | -0.5pp $349 | base $293 | +0.5pp $237 | +1.0pp $179 |
UW: 25.0% down · 7.5% · 30yr · 1.5% tax · 5.0% vac · 8.0% maint · 8.0% mgmt
Financing live
Cash to close
- Down payment
- $54,750
- Closing costs
- $6,570
- Reserves months
- —
- Total cash needed
- —
Loan-product check · same deal, 3 products live
Conventional
25% down · 7.5% · 30yr
- Down + closing
- —
- Monthly P&I
- —
- Monthly cashflow
- —
- DSCR
- —
- Eligible?
- —
Personal DTI + credit; lowest rate.
DSCR
20% down · 8.5% · 30yr
- Down + closing
- —
- Monthly P&I
- —
- Monthly cashflow
- —
- DSCR
- —
- Eligible?
- —
No personal income docs; deal must DSCR.
Hard money
10% down · 12.0% · 12mo
- Down + closing
- —
- Monthly P&I
- —
- Monthly cashflow
- —
- DSCR
- —
- Eligible?
- —
Short-term bridge; refi at stabilization.
Rent comps 40 comps
| Address | Beds | Baths | Sqft | Rent | $/sqft | DOM | Units | Dist |
|---|---|---|---|---|---|---|---|---|
| 502 Second Ave #3 Albany, NY | 3.0 | 1.0 | 1100 | $1,800 | $1.64 | 44d | 1 | 0.23mi |
| 86 Hackett Blvd Albany, NY | 2.0 | 1.0 | 1100 | $1,900 | $1.73 | 24d | 1 | 0.29mi |
| 50 Southern Blvd Albany, NY | 3.0 | 1.0 | 1200 | $1,650 | $1.38 | 14d | 1 | 0.31mi |
| 15 Stanwix St Albany, NY | 4.0 | 1.5 | 1660 | $2,500 | $1.51 | 14d | 1 | 0.35mi |
| 31 Bertha St Albany, NY | 4.0 | 1.0 | 1116 | $2,000 | $1.79 | 24d | 1 | 0.49mi |
| 22 Hurlbut St Albany, NY | 3.0 | 1.0 | 1209 | $2,050 | $1.70 | 44d | 1 | 0.52mi |
| 42 Harris Ave Unit 2 Albany, NY | 2.0 | 1.0 | 1000 | $1,600 | $1.60 | 14d | 1 | 0.59mi |
| 52 Grove Ave Albany, NY | 4.0 | 1.0 | 1200 | $2,200 | $1.83 | 21d | 1 | 0.73mi |
| 21 Woodlawn Ave Unit 3RDFL Albany, NY | 3.0 | 1.0 | 1300 | $1,500 | $1.15 | 44d | 1 | 0.85mi |
| 21 Woodlawn Ave Unit 3rd floor Albany, NY | 3.0 | 1.0 | 1300 | $1,500 | $1.15 | 24d | 1 | 0.85mi |
| 30 Cardinal Ave Albany, NY | 4.0 | 1.0 | 1529 | $2,800 | $1.83 | 45d | 1 | 0.92mi |
| 546 Mercer St Unit 1 Albany, NY | 3.0 | 1.0 | 1400 | $1,800 | $1.29 | 24d | 1 | 0.94mi |
| 35 Parkwood St Albany, NY | 2.0 | 1.0 | 900 | $1,495 | $1.66 | 24d | 1 | 1.02mi |
| 38 W Erie St Albany, NY | 4.0 | 2.0 | 1440 | $2,800 | $1.94 | 24d | 1 | 1.04mi |
| 614 Park Ave Albany, NY | 3.0 | 1.0 | 1118 | $2,500 | $2.24 | 44d | 1 | 1.09mi |
| 363 Ontario St Albany, NY | 1.0–2.0 | 1.0–2.5 | 1610 | $3,485 | $2.16 | 14d | 1 | 1.13mi |
| 6A Weis Rd Albany, NY | 2.0 | 1.0 | 900 | $1,610 | $1.79 | 14d | 1 | 1.14mi |
| 201 Park Ave Unit 10 Albany, NY | 3.0 | 2.0 | 1600 | $2,100 | $1.31 | 44d | 1 | 1.18mi |
| 520 Madison Ave Unit 1 Albany, NY | 3.0 | 1.0 | 1080 | $1,700 | $1.57 | 44d | 1 | 1.20mi |
| 673 Myrtle Ave Albany, NY | 4.0 | 1.0 | 1076 | $2,400 | $2.23 | 21d | 1 | 1.23mi |
| 563 New Scotland Ave Albany, NY | 2.0 | 1.0–2.0 | 931 | $3,125 | $3.36 | 14d | 37 | 1.24mi |
| 32 Peyster St Unit 2nd Albany, NY | 3.0 | 2.0 | 1500 | $2,300 | $1.53 | 44d | 1 | 1.25mi |
| 4 Irving St Unit 2nd Floor Albany, NY | 3.0 | 1.0 | 1000 | $1,695 | $1.70 | 44d | 1 | 1.25mi |
| 98 Mount Hope Dr Albany, NY | 2.0 | 1.5 | 1200 | $2,000 | $1.67 | 14d | 1 | 1.26mi |
| 409 Madison Ave Albany, NY | 2.0 | 2.0 | 1050 | $2,094 | $1.99 | 24d | 1 | 1.29mi |
| 104 S Main Ave Unit 1 Albany, NY | 3.0 | 1.0 | 1300 | $2,600 | $2.00 | 44d | 1 | 1.29mi |
| 830 Madison Ave Albany, NY | 3.0 | 1.0 | 1180 | $1,700 | $1.44 | 24d | 1 | 1.29mi |
| 88 Willett St Albany, NY | 3.0 | 1.0 | 825 | $2,080 | $2.52 | 14d | 10 | 1.29mi |
| 292 Lark St Albany, NY | 2.0 | 1.0 | 1100 | $1,500 | $1.36 | 44d | 1 | 1.30mi |
| 364 Madison Ave Albany, NY | 2.0 | 2.0 | 1150 | $1,850 | $1.61 | 21d | 1 | 1.31mi |
| 433 Hamilton St Unit 1 Albany, NY | 4.0 | 1.0 | 1200 | $2,300 | $1.92 | 14d | 1 | 1.33mi |
| 346 Madison Ave Unit 3 Albany, NY | 3.0 | 2.0 | 1110 | $2,725 | $2.45 | 44d | 1 | 1.33mi |
| 346 Madison Ave Albany, NY | 3.0 | 2.0 | 1500 | $2,495 | $1.66 | 24d | 1 | 1.33mi |
| 437 Hamilton St Unit 2 Albany, NY | 4.0 | 1.0 | 1200 | $2,300 | $1.92 | 14d | 1 | 1.33mi |
| 341 Madison Ave Albany, NY | 2.0 | 1.0 | 1000 | $1,800 | $1.80 | 14d | 1 | 1.36mi |
| 489 Hamilton St Unit 1 Albany, NY | 3.0 | 1.0 | 1100 | $1,800 | $1.64 | 14d | 1 | 1.38mi |
| 602 Morris St Albany, NY | 3.0 | 1.0 | 1270 | $1,850 | $1.46 | 14d | 1 | 1.39mi |
| 517 Hamilton St Albany, NY | 4.0 | 1.0 | 1020 | $2,000 | $1.96 | 24d | 1 | 1.42mi |
| 58 Elberon Pl Apt 2 Albany, NY | 4.0 | 1.0 | 1250 | $2,200 | $1.76 | 44d | 1 | 1.42mi |
| 475 S Pearl St #3 Albany, NY | 4.0 | 2.0 | 1200 | $1,850 | $1.54 | 14d | 1 | 1.42mi |
Listing history 5 events
-
2026-06-03statusdays on market $219,000 Pending 5 DOM
-
2026-06-02days on market $219,000 Active 4 DOM
-
2026-06-01days on market $219,000 Active 3 DOM
-
2026-05-31days on market $219,000 Active 2 DOM
-
2026-05-29$219,000 Active
ⓘ Source: listings_history table (triggers on properties + properties_extension) + one-shot
backfill from property_details.listing_events for pre-trigger history.
Tax reassessment forecast NY · Partial reset (capped growth)
- Current annual tax
- $870 · $72/mo
- Projected year-2 tax
- $2,285 · $190/mo
- Expected delta
- +$1,416/yr (+$118/mo · 162.7%)
ⓘ Screening estimate from a state-policy table — verify with the county assessor before closing.
Climate risk First Street
- Flood 1/10 Low FEMA zone X (unshaded) · 0% chance over 30 yrs
- Wildfire 3/10 Moderate
- Heat 4/10 Moderate 7 d/yr ≥99°F today · 16 d/yr by 30 yrs out
- Wind 3/10 Moderate 6% chance of damaging wind over 30 yrs
- Air quality 1/10 Low 0 unhealthy d/yr today · 0 by 30 yrs out
Nearby sold comps map
Loading sold comps map…
Walkable amenities ~0.75 mi
Loading nearby amenities…
Taxation est. · year 1
- Rental income
- $24,389
- − Mortgage interest
- −$12,267
- − Property taxes
- −$870
- − Insurance
- −$1,095
- − Repairs & maintenance
- −$1,951
- − Management
- −$1,951
- − Depreciation
- −$6,371
- Taxable loss
- −$116
- Est. tax savings @ 24.0%
- +$28
- After-tax cash flow
- $3,549/yr
For passive investors: Depreciation is non-cash, so a rental often shows a tax loss while cash-flowing — sheltering income. Rental losses are passive: they offset passive income freely, and up to $25,000/yr can offset ordinary (W-2) income if you actively participate and your MAGI is under $100k (phasing out to $0 by $150k); unused losses carry forward. On sale, claimed depreciation is recaptured at up to 25%, and gains may owe capital-gains tax (a 1031 exchange can defer both). Figures are a year-1 estimate at your 24.0% rate — not tax advice; consult a CPA.
Schools (NCES district)
- District
- Albany City School District
- NCES district ID
- 3602460
- Math proficiency
- 37% ▲ 6.00%
- Reading proficiency
- 40% ▲ 7.00%
- Median HH income
- $40,568
- Composite
- 32.34/100
- National rank
- #5744
- State rank
- #543 of 590 in NY
Livability — Albany
- Score
- 79/100
- State rank
- #129
- US rank
- #2083
Category grades
Schools grade is shown separately in the Schools card above.
Census & demographics
- Census place
- Albany, NY
- City population
- 116,921
- Population (ZIP)
- 10,754
Population outlook (Albany County) Hauer SSP2
- Today (2025)
- 320,794 people
- By 2030
- 327,401 · +2.1%
- By 2040
- 338,218 · +5.4%
- By 2050
- 348,467 · +8.6%
- By 2075
- 381,693 · +19.0%
- By 2100
- 393,809 · +22.8%
Race, ethnicity, and origin ACS 2023
- Neighborhood character
- Diverse neighborhood (Simpson 0.69)
- Race & ethnicity
- White 46% Black 23% Hispanic / Latino 19% Asian 8% Two or more races 7%
- Hispanic origin (detail)
- Puerto Rican 6%
- Common ancestry
- Romanian 4% Lithuanian 3% Serbian 1%
- Foreign-born
- 18% · Canada, Philippines, South Korea
- Languages at home
- 77% English-only · Spanish 13% Other Asian/Pacific 3% Tagalog/Filipino 1%
Political lean MEDSL · Albany
- 2024 margin
- Strong D (+25.8) · D 62.9% · R 37.1%
- 2008→2024 swing
- -3.6pp toward R · 2008: 29.4pp · 2024: 25.8pp
- All cycles
- 2024: D+25.8 2020: D+31.4 2016: D+24.3 2012: D+31.0 2008: D+29.4
Not yet ingested
- Civics
- —
Market trends
- HPI YoY
- ▼ -24.91%
- Current HPI
- 318.0191
- Rent YoY
- —
- Metro
- —
- State GDP YoY
- ▲ 2.60%
- F500 in state
- 92
Industry mix (Fortune 500 HQ in NY)
| Industry | F500 HQs | Revenue |
|---|---|---|
| Financial Services | 10 | $950B |
|
||
| Consumer Goods | 9 | $162B |
|
||
| Insurance | 4 | $225B |
|
||
| Telecommunications | 2 | $144B |
|
||
| Pharmaceuticals | 2 | $112B |
|
||
| Media / Entertainment | 2 | $69B |
|
||
Price history
1 event — show timeline
- 2026-05-29 Listed $219,000 Global MLS
Property tax history
-3.4%/yrLatest (2025): $870 · +2.0% YoY. Source: county tax records.
Cash-flow waterfall
monthlySold comps — $/sqft
last 12 mo · ≤1 miLoading sold comps…