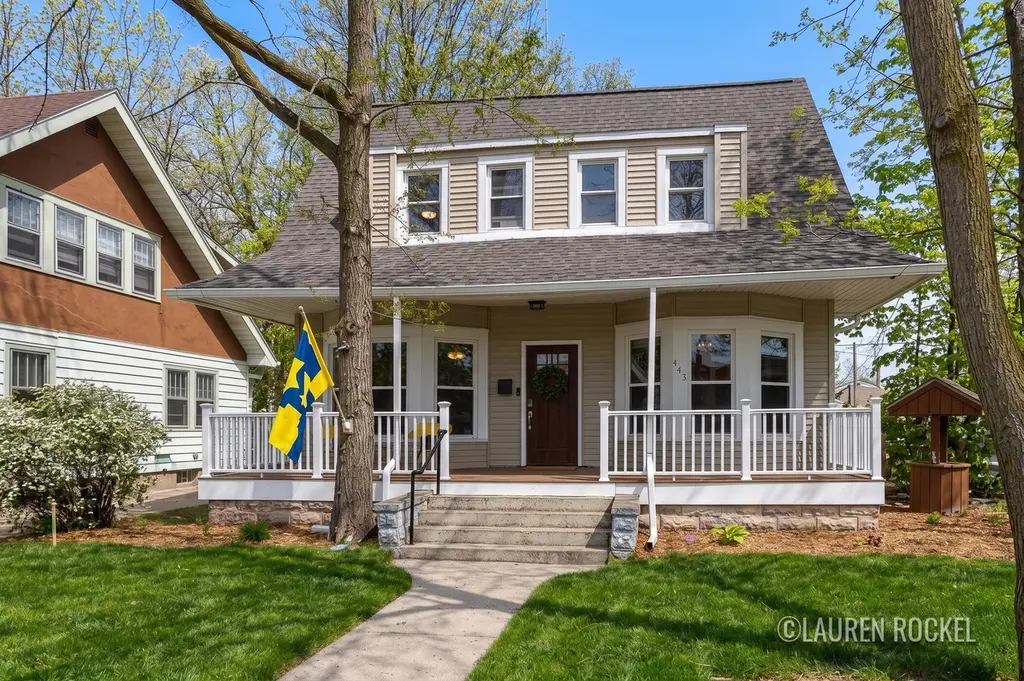
443 Dickinson St SE · Grand Rapids, MI
Flood risk 1/10 · Minimal
- FEMA flood zone
- X (unshaded)
- Chance of flooding over 30 yrs
- 0.0%
- Est. flood insurance / yr
- $473 – $860
Fire risk 1/10 · Minimal
- Est. fire insurance / yr
- $784 – $1,456
Heat risk 3/10 · Minor
- Hot days now (above 96°F)
- 7 days/yr
- Hot days in 30 yrs
- 16 days/yr
Wind risk 2/10 · Minimal
- Chance of severe wind over 30 yrs
- —
Air-quality risk 2/10 · Minimal
- Unhealthy air days now
- 2 days/yr
- Unhealthy air days in 30 yrs
- 2 days/yr
Risk factors via First Street. Map © Google.
Why this score? — see what drove the C- grade
The composite is a weighted blend of 9 inputs, each scored 0–100. Each bar is that input's sub-score; the figure is the points it added to the 100-point composite (weight × sub-score).
- Cash flow +20.4/30.0
- ARV discount +8.0/15.0
- DSCR +6.5/10.0
- 1% rule +4.6/10.0
- Livability +4.2/5.0
- Rent growth +3.7/5.0
- Condition / age +2.5/5.0
- Schools +1.9/10.0
- Appreciation +0.0/10.0
$239,900
🖨 Deal sheet 📄 Offer letter ✓ Due diligence
Listing remarks MLS
Character, charm, and sunlight in all the right places. This 4-bedroom, 1.5 bath home features beautiful hardwood floors, tall ceilings, and timeless details throughout. The main floor offers a spacious living room with a stunning focal-point fireplace, a formal dining room, an updated kitchen with newer appliances, convenient main floor laundry, and a half bath. Upstairs you'll find all four bedrooms along with a full bathroom. Outside, enjoy the brand new composite front deck, plus plenty of space out back for gardening, pets, or tossing a ball around. Recent updates include a new electrical panel, gutters, updated plumbing, and more. A warm and welcoming home with so much personality in every corner. Offers due by 12pm on Monday, May 18th.
Key facts
- Formal dining room
- Tall ceilings
- Main floor laundry
Tags
Property features AI
Exterior
- Utilities: Public water
- Home design: Traditional style single-family residence; Public water
- Construction: Built in 1920; Vinyl siding; Composition roof; Crawl space and full Michigan-style basement
- Exterior features: Sidewalk; Paved road access
Interior
- Kitchen: Dishwasher; Range; Microwave; Refrigerator
- Bathrooms: 1 full bathroom; 1 half bathroom
- Heating & cooling: Forced air heating; Window air conditioning units
- Interior features: Fireplace; Window treatments; 8 total rooms
- Laundry & utility: Washer; Dryer
Neighborhood map
What this means for you Summary
Snapshot
- This is a 4-bed/1.5-bath single-family listed at $240k.
Deal economics
- At list price, monthly cash flow is $312 ($4k/yr) — positive.
- The deal already cash-flows at list — no discount required.
- To meet the 1% rule (rent ≥ 1% of price), the offer needs to be $231k (3.6% below list).
- Recommended offer: $231k (3.6% below list) — sets the bar for 1% rule.
- Cap rate 7.9% vs local median 4.5% in Grand Rapids — top-decile yield for the area; either an underpriced asset or a hidden risk that comps aren't pricing in. Stress-test before assuming the spread holds.
Location & tenants
- Location reads 83/100 on livability (#44 in MI, #939 nationally) — a professional / high-income tenant draw. Strengths: amenities A+, commute A+, cost of living A+; Watch: employment C-, crime F.
- Grand Rapids Public Schools (urban): math 15% / reading 29% proficiency, ranked #451 of 540 in MI (top 84%) — low school quality limits family demand, transient renter base, plan for 1-2y turnover; 80% free/reduced lunch — lower-income household profile, screen leases tightly.
- Market conditions: Rents rising fast (+4.7%/yr); 178 active listings in the ZIP; 9 comparable units currently listed for rent nearby; rentals lingering (median 44d on market — plan ~5-8 weeks vacancy on turnover, expect pricing pressure); 78% of comp listings sitting > 30 days — soft ceiling on asking rent; 2,253 units permitted in Kent County in 2024 (969 in 5+ unit buildings).
- At $2,313/mo this rent would consume 45% of the median local household income ($61k/yr) (locally 1625% of renters already pay >50% of income on rent) — very limited rent-growth headroom before tenants either downsize or default.
Forward outlook
- Local home prices are declining (-3.0%/yr); year-one equity from $2k of loan paydown is wiped out by about $7k of value loss. Plan a longer hold.
- Kent County population projected at +22% by 2050 — long-run rental-demand tailwind backs the buy-and-hold thesis.
Negotiation context
- Only 5 days on market — expect competitive offers; lowballing is unlikely to land.
- 21 sale attempts since 32y ago with the ask held roughly flat each time — persistent listings suggest the price (not the market) is what's stuck; bring a comps-based counter.
- Current owner paid $150k; list at $240k implies a 60% gain — meaningful room to come down on a strong offer.
Risks & watch-outs
- Watch-outs: built in 1920 — expect roof / HVAC / electrical / plumbing capex.
Questions for the listing agent
- Built in 1920 — when were the roof, HVAC, electrical panel, plumbing, and water heater last replaced?
- Is there a deadline driving the sale (1031 exchange, divorce, estate, relocation)? That informs how much negotiation room exists.
- Crime grade is F in this area — have there been break-ins, vandalism, or insurance claims at this property in the last 3 years? What carrier currently insures it and at what premium?
- What's the average days-on-market for RENTAL listings here right now (not sales)? A rising rental-DOM trend means longer vacancies and softer asking-rent achievability than the comps imply.
- What's the recent tenant-quality profile in this submarket — average credit score on applications, eviction rate, late-payment / NSF rate, and stable-employment percentage? A property-management company in the area should have these aggregated.
- How much new for-sale + rental construction is in the pipeline within 1–3 miles? Heavy new supply typically softens prices + rents 12–24 months out; constrained supply supports both.
Investment metrics
- 1% rule
- 0.96% ✗
- Cap rate
- 7.85%
- Cash-on-cash
- 5.57%
- DSCR
- 1.25
- GRM
- 8.6
CMA / ARV
- ARV (median comp)
- $242,387
- List price
- $239,900
- Delta
- -1.03%
- Verdict
- FAIR
- Comps
- 20 within 2.0 mi
Projected returns pro-forma
-3.0% appreciation · 4.74% rent growth · sell at horizon
- IRR
- -5.9%
- Equity multiple
- 0.78×
- Total profit
- $-14,952
- Equity at exit
- $35,770
- IRR
- 5.6%
- Equity multiple
- 1.44×
- Total profit
- $29,851
- Equity at exit
- $20,742
Cash invested: $67,172 (down + closing). Projections, not guarantees.
Landlord ↔ Tenant lean methodology
- Overall (STATE)
- 62 Landlord-Friendly
- State Michigan
- 62 Landlord-Friendly · EVEN
- County
- — inherits STATE
- City
- — inherits STATE
ZIP-level market 49507
- Rents YoY
- 4.7%
- Active inventory
- 178
- Price-to-rent
- 8.6×
Monthly cashflow live
- Estimated rent
- $2,313 high interval (Pro) →
- Mortgage (P&I)
- −$1,258
- Tax from tax record
- −$158 /mo · $1,892/yr
- Insurance
- −$100
- HOA
- −$0
- Vacancy / Maint / Mgmt
- −$486
- Net cashflow
- $312
Break-even live
UW: 25.0% down · 7.5% · 30yr · 1.5% tax · 5.0% vac · 8.0% maint · 8.0% mgmt
Financing live
Cash to close
- Down payment
- $59,975
- Closing costs
- $7,197
- Reserves months
- —
- Total cash needed
- —
Loan-product check · same deal, 3 products live
Conventional
25% down · 7.5% · 30yr
- Down + closing
- —
- Monthly P&I
- —
- Monthly cashflow
- —
- DSCR
- —
- Eligible?
- —
Personal DTI + credit; lowest rate.
DSCR
20% down · 8.5% · 30yr
- Down + closing
- —
- Monthly P&I
- —
- Monthly cashflow
- —
- DSCR
- —
- Eligible?
- —
No personal income docs; deal must DSCR.
Hard money
10% down · 12.0% · 12mo
- Down + closing
- —
- Monthly P&I
- —
- Monthly cashflow
- —
- DSCR
- —
- Eligible?
- —
Short-term bridge; refi at stabilization.
Rent comps 9 comps
| Address | Beds | Baths | Sqft | Rent | $/sqft | DOM | Units | Dist |
|---|---|---|---|---|---|---|---|---|
| 1154 Prospect Ave SE Grand Rapids, MI | 5.0 | 2.0 | 1800 | $2,300 | $1.28 | 43d | 1 | 0.64mi |
| 950 Merritt St SE Grand Rapids, MI | 3.0 | 1.0 | 1000 | $2,100 | $2.10 | 43d | 1 | 0.84mi |
| 1031 Merrifield St SE Grand Rapids, MI | 3.0 | 2.0 | 1238 | $2,300 | $1.86 | 14d | 1 | 0.96mi |
| 840 Lafayette Ave SE Unit 2 Grand Rapids, MI | 3.0 | 1.0 | 950 | $1,600 | $1.68 | 43d | 1 | 1.02mi |
| 729 Bates St SE Unit 1 Grand Rapids, MI | 4.0 | 3.5 | 1576 | $2,395 | $1.52 | 43d | 1 | 1.18mi |
| 2551 Eastern Ave SE Unit 1 Grand Rapids, MI | 3.0 | 2.0 | 1600 | $2,100 | $1.31 | 43d | 1 | 1.20mi |
| 1027 Underwood Ave SE Grand Rapids, MI | 4.0 | 2.0 | 1600 | $2,300 | $1.44 | 14d | 1 | 1.20mi |
| 1400 Rossman Ave SE Grand Rapids, MI | 3.0 | 1.0 | 1400 | $2,200 | $1.57 | 43d | 1 | 1.34mi |
| 550 Union Ave SE Grand Rapids, MI | 3.0 | 1.5 | 1743 | $2,800 | $1.61 | 43d | 1 | 1.36mi |
Listing history 46 events
-
2026-05-14$239,900 Active 752-char remark
Show marketing remark (752 chars)
Character, charm, and sunlight in all the right places. This 4-bedroom, 1.5 bath home features beautiful hardwood floors, tall ceilings, and timeless details throughout. The main floor offers a spacious living room with a stunning focal-point fireplace, a formal dining room, an updated kitchen with newer appliances, convenient main floor laundry, and a half bath. Upstairs you'll find all four bedrooms along with a full bathroom. Outside, enjoy the brand new composite front deck, plus plenty of space out back for gardening, pets, or tossing a ball around. Recent updates include a new electrical panel, gutters, updated plumbing, and more. A warm and welcoming home with so much personality in every corner. Offers due by 12pm on Monday, May 18th.
-
2026-05-14$239,900 Active
Show marketing remark (752 chars)
Character, charm, and sunlight in all the right places. This 4-bedroom, 1.5 bath home features beautiful hardwood floors, tall ceilings, and timeless details throughout. The main floor offers a spacious living room with a stunning focal-point fireplace, a formal dining room, an updated kitchen with newer appliances, convenient main floor laundry, and a half bath. Upstairs you'll find all four bedrooms along with a full bathroom. Outside, enjoy the brand new composite front deck, plus plenty of space out back for gardening, pets, or tossing a ball around. Recent updates include a new electrical panel, gutters, updated plumbing, and more. A warm and welcoming home with so much personality in every corner. Offers due by 12pm on Monday, May 18th.
-
2019-05-20soldstatus $150,000
-
2019-05-17soldstatus $150,000
-
2019-05-17soldstatus $150,000
-
2019-05-17$150,000
-
2019-05-17$150,000
-
2019-05-17$150,000
-
2019-02-26soldstatus $83,000
-
2019-02-22soldstatus $83,000
-
2019-02-22soldstatus $83,000 Sold
-
2019-02-11status Pending
-
2019-02-06price $89,900
-
2018-12-11$89,900
-
2018-12-11$99,900 Active
-
2018-12-11$89,900
-
2017-03-02soldstatus $73,000
-
2017-02-24soldstatus $73,000
-
2017-02-24soldstatus $73,000 Sold
-
2017-01-20status Pending
-
2016-10-04$79,900 Active
-
2016-10-04$79,900
-
2016-08-22historical
-
2016-08-21historical
-
2016-06-21$84,900 Active
-
2016-06-21$84,900
-
2015-11-11historical
-
2015-11-10historical
-
2015-10-05price $82,900
-
2015-09-04$89,900 Active
-
2015-07-17$82,900
-
2004-12-06soldstatus $49,500
-
2004-11-18soldstatus $49,500
-
2004-11-18soldstatus $49,500
-
2004-06-15$49,800
-
2004-06-15$49,800
-
2000-02-04soldstatus $65,000
-
1998-02-13soldstatus $30,000
-
1998-02-13soldstatus $30,000
-
1997-10-13$30,000
-
1997-10-13$30,000
-
1996-04-17soldstatus $36,900
-
1996-04-17soldstatus $36,900
-
1994-12-21$35,900
-
1994-12-21$35,900
ⓘ Source: listings_history table (triggers on properties + properties_extension) + one-shot
backfill from property_details.listing_events for pre-trigger history.
Tax reassessment forecast MI · Partial reset (capped growth)
- Current annual tax
- $1,892 · $158/mo
- Projected year-2 tax
- $2,793 · $233/mo
- Expected delta
- +$901/yr (+$75/mo · 47.6%)
ⓘ Screening estimate from a state-policy table — verify with the county assessor before closing.
Climate risk First Street
- Flood 1/10 Low FEMA zone X (unshaded) · 0% chance over 30 yrs
- Wildfire 1/10 Low
- Heat 3/10 Moderate 7 d/yr ≥96°F today · 16 d/yr by 30 yrs out
- Wind 2/10 Low
- Air quality 2/10 Low 2 unhealthy d/yr today · 2 by 30 yrs out
Nearby sold comps map
Loading sold comps map…
Walkable amenities ~0.75 mi
Loading nearby amenities…
Taxation est. · year 1
- Rental income
- $27,758
- − Mortgage interest
- −$13,438
- − Property taxes
- −$1,892
- − Insurance
- −$1,200
- − Repairs & maintenance
- −$2,221
- − Management
- −$2,221
- − Depreciation
- −$6,979
- Taxable loss
- −$192
- Est. tax savings @ 24.0%
- +$46
- After-tax cash flow
- $3,787/yr
For passive investors: Depreciation is non-cash, so a rental often shows a tax loss while cash-flowing — sheltering income. Rental losses are passive: they offset passive income freely, and up to $25,000/yr can offset ordinary (W-2) income if you actively participate and your MAGI is under $100k (phasing out to $0 by $150k); unused losses carry forward. On sale, claimed depreciation is recaptured at up to 25%, and gains may owe capital-gains tax (a 1031 exchange can defer both). Figures are a year-1 estimate at your 24.0% rate — not tax advice; consult a CPA.
Schools (NCES district)
- District
- Grand Rapids Public Schools
- NCES district ID
- 2616440
- Math proficiency
- 15% ▼ -5.00%
- Reading proficiency
- 29% ▼ -1.00%
- Median HH income
- $40,612
- Composite
- 18.62/100
- National rank
- #8899
- State rank
- #451 of 540 in MI
Livability — Grand Rapids
- Score
- 83/100
- State rank
- #44
- US rank
- #939
Category grades
Schools grade is shown separately in the Schools card above.
Census & demographics
- Census place
- Grand Rapids, MI
- County
- Kent County · 533,805 people
- City population
- 181,325
- Metro
- Grand Rapids-Kentwood, MI
- Population (ZIP)
- 38,487
- Household income
- $61,461
- Rent vs Own
- Severe rent burden
- 1625.0
Population outlook (Kent County) Hauer SSP2
- Today (2025)
- 712,484 people
- By 2030
- 748,618 · +5.1%
- By 2040
- 814,777 · +14.4%
- By 2050
- 868,556 · +21.9%
- By 2075
- 966,487 · +35.7%
- By 2100
- 967,975 · +35.9%
Race, ethnicity, and origin ACS 2023
- Neighborhood character
- Highly diverse neighborhood (Simpson 0.71)
- Race & ethnicity
- Hispanic / Latino 31% Black 31% White 30% Two or more races 21%
- Hispanic origin (detail)
- Mexican 18% Puerto Rican 3% Dominican 1%
- Common ancestry
- Iranian 8% Romanian 2% Lithuanian 1%
- Foreign-born
- 18% · Canada
- Languages at home
- 71% English-only · Spanish 23% Arabic 1% Other Indo-European 1%
Political lean MEDSL · Kent
- 2024 margin
- Lean D (+5.4) · D 51.8% · R 46.5% · Other 1.7%
- 2008→2024 swing
- +4.8pp toward D · 2008: 0.5pp · 2024: 5.4pp
- All cycles
- 2024: D+5.4 2020: D+6.1 2016: R+3.1 2012: R+7.9 2008: D+0.5
Not yet ingested
- Civics
- —
Market trends
- HPI YoY
- ▼ -301.99%
- Current HPI
- 325.3878
- Rent YoY
- ▲ 4.74%
- Metro
- Grand Rapids-Kentwood, MI
- State GDP YoY
- ▲ 1.37%
- F500 in state
- 28
Industry mix (Fortune 500 HQ in MI)
| Industry | F500 HQs | Revenue |
|---|---|---|
| Automotive Parts | 3 | $48B |
|
||
| Automotive | 2 | $372B |
|
||
| Chemicals | 1 | $45B |
|
||
| Automotive Retail | 1 | $29B |
|
||
| Healthcare / Medical Devices | 1 | $23B |
|
||
| Automotive Technology | 1 | $20B |
|
||
Price history
+568.2% since first listed49 events — show timeline
- 2026-05-20 Pending — REALCOMP
- 2026-05-19 Pending — MiRealSource-MiMLS
- 2026-05-19 Pending — SW Michigan MLS
- 2026-05-14 Listed $239,900 SW Michigan MLS
- 2026-05-14 Listed $239,900 MiRealSource-MiMLS
- 2026-05-14 Listed $239,900 REALCOMP
- 2019-05-20 Sold (Public Records) $150,000 Public Records
- 2019-05-17 Listed $150,000 MiRealSource-MiMLS
- 2019-05-17 Listed $150,000 SW Michigan MLS
- 2019-05-17 Listed $150,000 REALCOMP
- 2019-05-17 Sold (MLS) $150,000 SW Michigan MLS
- 2019-05-17 Sold (MLS) $150,000 REALCOMP
- 2019-02-26 Sold (Public Records) $83,000 Public Records
- 2019-02-22 Sold (MLS) $83,000 SW Michigan MLS
- 2019-02-22 Sold (MLS) $83,000 REALCOMP
- 2019-02-11 Pending — SW Michigan MLS
- 2019-02-06 Price Changed $89,900 SW Michigan MLS
- 2018-12-11 Listed $89,900 MiRealSource-MiMLS
- 2018-12-11 Listed $99,900 SW Michigan MLS
- 2018-12-11 Listed $89,900 REALCOMP
- 2017-03-02 Sold (Public Records) $73,000 Public Records
- 2017-02-24 Sold (MLS) $73,000 SW Michigan MLS
- 2017-02-24 Sold (MLS) $73,000 REALCOMP
- 2017-01-20 Pending — SW Michigan MLS
- 2016-10-04 Listed $79,900 SW Michigan MLS
- 2016-10-04 Listed $79,900 REALCOMP
- 2016-08-22 Listing Removed — SW Michigan MLS
- 2016-08-21 Listing Removed — REALCOMP
- 2016-06-21 Listed $84,900 SW Michigan MLS
- 2016-06-21 Listed $84,900 REALCOMP
- 2015-11-11 Listing Removed — SW Michigan MLS
- 2015-11-10 Listing Removed — REALCOMP
- 2015-10-05 Price Changed $82,900 SW Michigan MLS
- 2015-09-04 Listed $89,900 SW Michigan MLS
- 2015-07-17 Listed $82,900 REALCOMP
- 2004-12-06 Sold (Public Records) $49,500 Public Records
- 2004-11-18 Sold (MLS) $49,500 REALCOMP
- 2004-11-18 Sold (MLS) $49,500 SW Michigan MLS
- 2004-06-15 Listed $49,800 REALCOMP
- 2004-06-15 Listed $49,800 SW Michigan MLS
- 2000-02-04 Sold (Public Records) $65,000 Public Records
- 1998-02-13 Sold (MLS) $30,000 REALCOMP
- 1998-02-13 Sold (MLS) $30,000 SW Michigan MLS
- 1997-10-13 Listed $30,000 REALCOMP
- 1997-10-13 Listed $30,000 SW Michigan MLS
- 1996-04-17 Sold (MLS) $36,900 REALCOMP
- 1996-04-17 Sold (MLS) $36,900 SW Michigan MLS
- 1994-12-21 Listed $35,900 REALCOMP
- 1994-12-21 Listed $35,900 SW Michigan MLS
Property tax history
+4.5%/yrLatest (2025): $1,892 · +2.4% YoY. Source: county tax records.
Cash-flow waterfall
monthlySold comps — $/sqft
last 12 mo · ≤1 miLoading sold comps…