11231 Green Lake Dr #202 · Golf, FL
Flood risk 1/10 · Minimal
- FEMA flood zone
- X (unshaded)
- Chance of flooding over 30 yrs
- 0.0%
- Est. flood insurance / yr
- $507 – $1,088
Fire risk 1/10 · Minimal
- Est. fire insurance / yr
- $947 – $1,759
Heat risk 9/10 · Severe
- Hot days now (above 106°F)
- 7 days/yr
- Hot days in 30 yrs
- 26 days/yr
Wind risk 10/10 · Severe
- Chance of severe wind over 30 yrs
- 99.0%
Air-quality risk 2/10 · Minimal
- Unhealthy air days now
- 1 days/yr
- Unhealthy air days in 30 yrs
- 2 days/yr
Risk factors via First Street. Map © Google.
Why this score? — see what drove the D grade
The composite is a weighted blend of 9 inputs, each scored 0–100. Each bar is that input's sub-score; the figure is the points it added to the 100-point composite (weight × sub-score).
- Cash flow +8.6/30.0
- ARV discount +7.5/15.0
- 1% rule +4.9/10.0
- Appreciation +4.9/10.0
- Schools +4.3/10.0
- Livability +3.2/5.0
- Rent growth +2.8/5.0
- Condition / age +2.5/5.0
- DSCR +2.3/10.0
$299,000
🖨 Deal sheet (PDF) 📄 Offer letter ✓ Due diligence
Listing remarks MLS
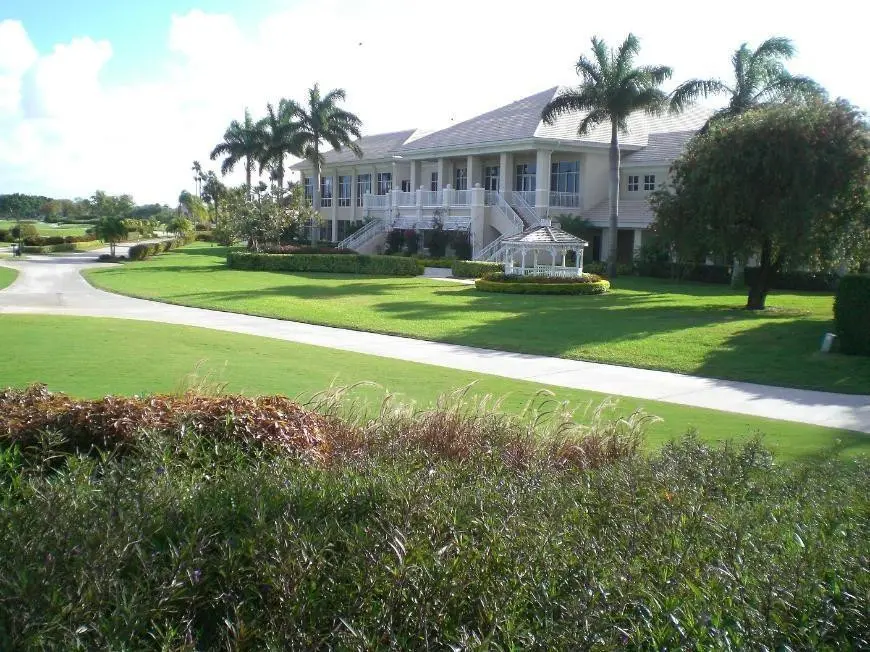
LIVE AND LOVE THIS IMPECCABLY MAINTAINED HUGE TWO BEDROOM/TWO FULL BATH CONDO IN THE MOST PRESTIGIOUS INDIAN SPRINGS COMMUNITY. MOST BEAUTIFUL AND SERENE LAKE VIEWS FROM YOUR OVERSIZED SCREENED PATIO. NO MANDATORY MEMBERSHIP! ENJOY THE VAST ARRAY OF AMMENTIES IN THE GATED PARADISE! FULL SIZED WASHER/DRYER IN UNIT. PRIVATE WALK UP LOCATION WITH LARGE STORAGE ROOM. MINUTES TO SHOPPING AND EASY ACCESS TO BEACHES.
Key facts
- Dual-suite layout
- Community pool
- Private balcony
Tags
Property features AI
Finance
- Other: Pets not allowed
- HOA & community: Association: Green Lake Condo; HOA includes cable TV; Monthly association fee; Community amenities include pool and security; Senior community
Exterior
- Parking: Assigned parking (1 open space / total 1 parking)
- Security: Security guard; Security patrol
- Utilities: Public water; Public sewer; Electricity with circuit breakers; Cable available
- Home design: Condominium; One level living; West-facing
- Construction: Built with brick, concrete, stucco and CBS; Flat roof; Slab foundation; 2 total stories (building)
- Exterior features: Waterfront property; Asphalt road access
Interior
- Kitchen: Dishwasher
- Bedrooms: 2 bedrooms (both on main level)
- Flooring: Laminate
- Bathrooms: 2 full bathrooms (both on main level)
- Heating & cooling: Central heating (electric); Central air; Ceiling fan(s)
- Interior features: Furnished; Disposal
- Laundry & utility: Laundry in hall; Electric water heater
Neighborhood map
What this means for you Summary
Snapshot
- This is a 2-bed/2.0-bath condo listed at $299k.
Deal economics
- At list price, monthly cash flow is $-260 ($-3k/yr) — negative.
- To cash-flow at today's rent, offer at most $253k (15.3% below list).
- To meet the 1% rule (rent ≥ 1% of price), the offer needs to be $297k (0.5% below list).
- Recommended offer: $253k (15.3% below list) — sets the bar for cash-flow.
Location & tenants
- Location reads 63/100 on livability (#703 in FL) — a middle-class / working-renter tenant base. Strengths: crime A+, employment A+, housing A+; Watch: amenities F, commute F, cost of living F.
- Palm Beach (suburban): math 46% / reading 53% proficiency, ranked #34 of 73 in FL (top 47%) — families likely to look elsewhere, expect single-tenant / working-renter base with shorter leases.
- Zoned schools: Hagen Road Elementary School (math 55% / reading 63%, grade B-, #722 of 2,144 statewide, top 34%, 773 students, 46% FRL); Carver Middle School (math 22% / reading 34%, grade F, #486 of 571 statewide, top 86%, 732 students, 73% FRL); Boynton Beach Community High (math 13% / reading 25%, grade F, #565 of 667 statewide, top 85%, 1,547 students, 65% FRL).
- Zoned-school proficiency averages 35% at this address vs 50% district-wide (-14 pts) — the specific schools serving this property underperform the Palm Beach average; the district grade overstates school quality for this exact location.
- Market conditions: Rents rising (+1.3%/yr); 488 active listings in the ZIP; 40 comparable units currently listed for rent nearby; rentals at typical pace (median 27d on market — plan ~3-4 weeks tenant-placement turnaround); solid renter incomes; 3,974 units permitted in Palm Beach County in 2024 (1,012 in 5+ unit buildings).
- This rent runs 44% of the median local income ($81k/yr) — at the standard rent-burdened threshold; future hikes will face affordability resistance.
Forward outlook
- In year one you build about $1k of equity ($2k loan paydown + $-723 appreciation (-0.2% local appreciation)).
- Palm Beach County population projected at +30% by 2050 — long-run rental-demand tailwind backs the buy-and-hold thesis.
Negotiation context
- It's been on market 24 days — a 2% lower offer ($295k) is reasonable based on typical stale-listing flexibility.
- 5 sale attempts since 2y ago with the ask held roughly flat each time — persistent listings suggest the price (not the market) is what's stuck; bring a comps-based counter.
- Current owner paid $195k; list at $299k implies a 53% gain — meaningful room to come down on a strong offer.
Risks & watch-outs
- Watch-outs: HOA is 23% of rent.
- Climate carrying-cost: severe wind risk, 99% chance of damaging wind over 30y; extreme-heat days projected 7→26/yr by 2055 (HVAC capex compounding) — expect insurance premiums to compound above CPI over the hold.
Questions for the listing agent
- What do current leases actually rent for vs. the listed asking? Can we see a recent rent roll and the last 12 months of T-12 income?
- Built in 1979 — when were the roof, HVAC, electrical panel, plumbing, and water heater last replaced?
- What does the HOA fee cover, when was the last increase, and are there any pending special assessments or reserve-fund shortfalls?
- Any open or pending special assessments — roof, HVAC, plumbing, elevator, façade? What's the per-unit balance and payoff schedule, and is the seller paying it off at close or rolling it to the buyer?
- Is there a deadline driving the sale (1031 exchange, divorce, estate, relocation)? That informs how much negotiation room exists.
- The area grade is low — what's the realistic commute time and amenity access for the typical tenant pool here? Any planned neighborhood developments (good or bad) we should know about?
- What's the average days-on-market for RENTAL listings here right now (not sales)? A rising rental-DOM trend means longer vacancies and softer asking-rent achievability than the comps imply.
- What's the recent tenant-quality profile in this submarket — average credit score on applications, eviction rate, late-payment / NSF rate, and stable-employment percentage? A property-management company in the area should have these aggregated.
- How much new apartment / multifamily construction is in the pipeline within 1–3 miles? Heavy new supply (>2% of stock underway) typically softens rents 12–24 months out; light construction supports rent growth.
Investment metrics
- 1% rule
- 0.99% ✗
- Cap rate
- 5.25%
- Cash-on-cash
- -3.72%
- DSCR
- 0.83
- GRM
- 8.4
CMA / ARV
No comps found within radius.
Projected returns pro-forma
-0.24% appreciation · 1.28% rent growth · sell at horizon
- IRR
- -8.8%
- Equity multiple
- 0.60×
- Total profit
- $-33,355
- Equity at exit
- $83,224
- IRR
- -4.1%
- Equity multiple
- 0.60×
- Total profit
- $-33,421
- Equity at exit
- $97,214
Cash invested: $83,720 (down + closing). Projections, not guarantees.
Landlord ↔ Tenant lean methodology
- Overall (STATE)
- 87 Strongly Landlord-Friendly
- State Florida
- 87 Strongly Landlord-Friendly · R+3
- County
- — inherits STATE
- City
- — inherits STATE
ZIP-level market 33437
- Home prices YoY
- -0.1%
- Rents YoY
- 1.3%
- Active inventory
- 488
- Price-to-rent
- 8.4×
Monthly cashflow live
- Estimated rent
- $2,974 high interval (Pro) →
- Mortgage (P&I)
- −$1,568
- Tax from tax record
- −$246 /mo · $2,956/yr
- Insurance
- −$125
- HOA
- −$670
- Lot rent
- −$0
- Vacancy / Maint / Mgmt
- −$624
- Net cashflow
- $-260
Break-even live
Sensitivity live
| Price | -10% $-91 | -5% $-175 | +0% $-260 | +5% $-344 | +10% $-429 |
|---|---|---|---|---|---|
| Rent | -10% $-495 | -5% $-377 | +0% $-260 | +5% $-142 | +10% $-25 |
| Rate | -1.0pp $-109 | -0.5pp $-184 | base $-260 | +0.5pp $-337 | +1.0pp $-416 |
UW: 25.0% down · 7.5% · 30yr · 1.5% tax · 5.0% vac · 8.0% maint · 8.0% mgmt
Financing live
Cash to close
- Down payment
- $74,750
- Closing costs
- $8,970
- Reserves months
- —
- Total cash needed
- —
Loan-product check · same deal, 3 products live
Conventional
25% down · 7.5% · 30yr
- Down + closing
- —
- Monthly P&I
- —
- Monthly cashflow
- —
- DSCR
- —
- Eligible?
- —
Personal DTI + credit; lowest rate.
DSCR
20% down · 8.5% · 30yr
- Down + closing
- —
- Monthly P&I
- —
- Monthly cashflow
- —
- DSCR
- —
- Eligible?
- —
No personal income docs; deal must DSCR.
Hard money
10% down · 12.0% · 12mo
- Down + closing
- —
- Monthly P&I
- —
- Monthly cashflow
- —
- DSCR
- —
- Eligible?
- —
Short-term bridge; refi at stabilization.
Rent comps 40 comps
| Address | Beds | Baths | Sqft | Rent | $/sqft | DOM | Units | Dist |
|---|---|---|---|---|---|---|---|---|
| 11234 Green Lake Dr #102 Boynton Beach, FL | 2.0 | 2.0 | 1196 | $2,200 | $1.84 | 27d | 1 | 0.04mi |
| 11282 Green Lake Dr #204 Boynton Beach, FL | 2.0 | 2.0 | 1196 | $3,750 | $3.14 | 27d | 1 | 0.05mi |
| 11230 Green Lake Dr #204 Boynton Beach, FL | 3.0 | 2.0 | 1549 | $3,000 | $1.94 | 14d | 1 | 0.05mi |
| 11115 Oakdale Rd Boynton Beach, FL | 3.0 | 2.0 | 1713 | $4,200 | $2.45 | 27d | 1 | 0.39mi |
| 5570 Piping Rock Dr Boynton Beach, FL | 2.0 | 2.0 | 1478 | $3,000 | $2.03 | 2d | 1 | 0.39mi |
| 5570 Piping Rock Dr Boynton Beach, FL | 2.0 | 2.0 | 1478 | $2,850 | $1.93 | 27d | 1 | 0.39mi |
| 10921 Royal Caribbean Cir Boynton Beach, FL | 3.0 | 2.0 | 1782 | $3,800 | $2.13 | 27d | 1 | 0.40mi |
| 10921 Royal Caribbean Cir Boynton Beach, FL | 3.0 | 2.0 | 1762 | $3,800 | $2.16 | 6d | 1 | 0.40mi |
| 6446 Aspen Glen Cir Unit 6446 Boynton Beach, FL | 3.0 | 2.0 | 1800 | $4,000 | $2.22 | 27d | 1 | 0.46mi |
| 6446 Aspen Glen Cir Boynton Beach, FL | 3.0 | 2.0 | 1800 | $3,800 | $2.11 | 23d | 1 | 0.46mi |
| 10596 Sunset Isles Ct Boynton Beach, FL | 3.0 | 2.0 | 1769 | $4,500 | $2.54 | 27d | 1 | 0.59mi |
| 10624 Tropic Palm Ave #202 Boynton Beach, FL | 3.0 | 2.0 | 1385 | $2,550 | $1.84 | 27d | 1 | 0.73mi |
| 5750 Fairway Park Ct #101 Boynton Beach, FL | 3.0 | 2.0 | 1426 | $1,850 | $1.30 | 27d | 1 | 0.73mi |
| 10592 Tropic Palm Ave #202 Boynton Beach, FL | 2.0 | 2.0 | 1385 | $2,450 | $1.77 | 27d | 1 | 0.77mi |
| 11211 S Military Trl Boynton Beach, FL | 1.0–3.0 | 1.0–2.0 | 1033 | $2,260 | $2.19 | 0d | 31 | 0.79mi |
| 5734 Northpointe Ln Boynton Beach, FL | 2.0 | 2.0 | 1125 | $2,600 | $2.31 | 6d | 1 | 0.88mi |
| 5734 Northpointe Ln Boynton Beach, FL | 2.0 | 2.0 | 1125 | $2,750 | $2.44 | 17d | 1 | 0.88mi |
| 6396 Park Lake Cir Boynton Beach, FL | 3.0 | 2.5 | 1422 | $2,950 | $2.07 | 17d | 1 | 0.88mi |
| 5694 Northpointe Ln Boynton Beach, FL | 2.0 | 2.0 | 1125 | $2,825 | $2.51 | 10d | 1 | 0.89mi |
| 5675 Northpointe Ln Boynton Beach, FL | 2.0 | 2.5 | 1163 | $2,950 | $2.54 | 27d | 1 | 0.90mi |
| 5675 Northpointe Ln Boynton Beach, FL | 2.0 | 2.0 | 1163 | $3,000 | $2.58 | 5d | 1 | 0.90mi |
| 12118 Country Greens Blvd Boynton Beach, FL | 3.0 | 2.0 | 1566 | $3,000 | $1.92 | 13d | 1 | 0.94mi |
| 6037 Rossmoor Lakes Ct Boynton Beach, FL | 3.0 | 2.0 | 1617 | $4,700 | $2.91 | 27d | 1 | 0.99mi |
| 10390 Utopia Cir E Unit 10390 Boynton Beach, FL | 3.0 | 2.0 | 1845 | $4,200 | $2.28 | 27d | 1 | 1.02mi |
| 10390 Utopia Cir E Unit E Boynton Beach, FL | 3.0 | 2.0 | 1845 | $4,200 | $2.28 | 5d | 1 | 1.02mi |
| 5217 Cedar Lake Rd Boynton Beach, FL | 1.0–3.0 | 1.0–2.0 | 1030 | $2,266 | $2.20 | 4d | 51 | 1.07mi |
| 10187 Mangrove Dr #104 Boynton Beach, FL | 2.0 | 2.0 | 1260 | $2,350 | $1.87 | 27d | 1 | 1.09mi |
| 12299 Forest Greens Dr Boynton Beach, FL | 2.0 | 2.0 | 1310 | $2,450 | $1.87 | 20d | 1 | 1.10mi |
| 10056 Boynton Place Cir Boynton Beach, FL | 3.0 | 2.0 | 1253 | $3,000 | $2.39 | 27d | 1 | 1.11mi |
| 10056 Boynton Place Cir Boynton Beach, FL | 3.0 | 2.0 | 1253 | $2,950 | $2.35 | 4d | 1 | 1.11mi |
| 5895 Autumn Lake Ln Unit A Boynton Beach, FL | 3.0 | 2.0 | 1469 | $2,600 | $1.77 | 27d | 1 | 1.13mi |
| 5020 Ashley Lake Dr Boynton Beach, FL | 2.0 | 2.0 | 1002 | $2,394 | $2.39 | 5d | 1 | 1.14mi |
| 5020 Ashley Lake Dr Boynton Beach, FL | 2.0 | 2.0 | 1002 | $2,346 | $2.34 | 16d | 1 | 1.14mi |
| 12390 Summer Springs Dr Boynton Beach, FL | 3.0 | 2.0 | 1861 | $3,300 | $1.77 | 27d | 1 | 1.18mi |
| 4944 Equestrian Cir Unit A Boynton Beach, FL | 2.0 | 2.0 | 1400 | $2,500 | $1.79 | 10d | 1 | 1.21mi |
| 10492 Boynton Place Cir Boynton Beach, FL | 1.0–3.0 | 1.0–2.0 | 1017 | $2,339 | $2.30 | 0d | 19 | 1.21mi |
| 4907 Boxwood Cir Boynton Beach, FL | 3.0 | 2.0 | 1731 | $2,900 | $1.68 | 27d | 1 | 1.24mi |
| 5335 Vernio Ln Boynton Beach, FL | 3.0 | 2.0 | 1798 | $3,700 | $2.06 | 27d | 1 | 1.33mi |
| 9926 Watermill Cir Unit F Boynton Beach, FL | 3.0 | 2.0 | 1471 | $2,400 | $1.63 | 27d | 1 | 1.34mi |
| 12547 Imperial Isle Dr Boynton Beach, FL | 2.0–3.0 | 2.0 | 1500 | $2,500 | $1.67 | 27d | 2 | 1.40mi |
HOA detail condo
- Monthly dues
- $670 · $8,040/yr
- Likely covers
- security
- Assessments
- None detected in remarks — confirm with the listing agent.
Listing history 16 events
-
2026-06-22days on market $299,000 Active 24 DOM
-
2026-06-21days on market $299,000 Active 23 DOM
-
2026-06-18days on market $299,000 Active 20 DOM
-
2026-06-17days on market $299,000 Active 19 DOM
-
2026-06-16days on market $299,000 Active 18 DOM
-
2026-06-15days on market $299,000 Active 17 DOM
-
2026-06-13days on market $299,000 Active 15 DOM
-
2026-06-09days on market $299,000 Active 11 DOM
-
2026-06-08days on market $299,000 Active 10 DOM
-
2026-06-07days on market $299,000 Active 9 DOM
-
2026-06-04days on market $299,000 Active 6 DOM
-
2026-06-03days on market $299,000 Active 5 DOM
-
2026-06-02remarks 694-char remark
-
2026-06-02days on market $299,000 Active 4 DOM
-
2026-06-01days on market $299,000 Active 3 DOM
-
2026-05-31days on market $299,000 Active 2 DOM
ⓘ Source: listings_history table (triggers on properties + properties_extension) + one-shot
backfill from property_details.listing_events for pre-trigger history.
Tax reassessment forecast FL · Resets to sale price
- Current annual tax
- $2,956 · $246/mo
- Projected year-2 tax
- $2,956 · $246/mo
- Expected delta
- $0/yr ($0/mo · 0.0%)
ⓘ Screening estimate from a state-policy table — verify with the county assessor before closing.
Climate risk First Street
- Flood 1/10 Low FEMA zone X (unshaded) · 0% chance over 30 yrs
- Wildfire 1/10 Low
- Heat 9/10 Extreme 7 d/yr ≥106°F today · 26 d/yr by 30 yrs out
- Wind 10/10 Extreme 99% chance of damaging wind over 30 yrs
- Air quality 2/10 Low 1 unhealthy d/yr today · 2 by 30 yrs out
Nearby sold comps map
Loading sold comps map…
Walkable amenities ~0.75 mi
Loading nearby amenities…
Taxation est. · year 1
- Rental income
- $35,683
- − Mortgage interest
- −$16,749
- − Property taxes
- −$2,956
- − Insurance
- −$1,495
- − Repairs & maintenance
- −$2,855
- − Management
- −$2,855
- − HOA
- −$8,040
- − Depreciation
- −$8,698
- Taxable loss
- −$7,964
- Est. tax savings @ 24.0%
- +$1,911
- After-tax cash flow
- $-1,206/yr
For passive investors: Depreciation is non-cash, so a rental often shows a tax loss while cash-flowing — sheltering income. Rental losses are passive: they offset passive income freely, and up to $25,000/yr can offset ordinary (W-2) income if you actively participate and your MAGI is under $100k (phasing out to $0 by $150k); unused losses carry forward. On sale, claimed depreciation is recaptured at up to 25%, and gains may owe capital-gains tax (a 1031 exchange can defer both). Figures are a year-1 estimate at your 24.0% rate — not tax advice; consult a CPA.
Schools (NCES district)
- District
- Palm Beach
- NCES district ID
- 1201500
- Math proficiency
- 46% ▼ -16.00%
- Reading proficiency
- 53% ▼ -4.00%
- Median HH income
- $53,943
- Composite
- 42.72/100
- National rank
- #3160
- State rank
- #34 of 73 in FL
Livability — Golf
- Score
- 63/100
- State rank
- #703
- US rank
- #14941
Category grades
Schools grade is shown separately in the Schools card above.
Census & demographics
- County
- Palm Beach County · 1,438,312 people
- Metro
- Miami-Fort Lauderdale-Pompano Beach, FL
- Population (ZIP)
- 37,229
- Household income
- $80,710
- Rent vs Own
- Severe rent burden
- 902.0
Population outlook (Palm Beach County) Hauer SSP2
- Today (2025)
- 1,637,487 people
- By 2030
- 1,743,255 · +6.5%
- By 2040
- 1,948,712 · +19.0%
- By 2050
- 2,132,979 · +30.3%
- By 2075
- 2,530,027 · +54.5%
- By 2100
- 2,706,979 · +65.3%
Race, ethnicity, and origin ACS 2023
- Neighborhood character
- Predominantly White (68%)
- Race & ethnicity
- White 68% Two or more races 13% Hispanic / Latino 12% Black 10% Asian 3%
- Hispanic origin (detail)
- Mexican 1% Puerto Rican 2% Cuban 1% Dominican 1%
- Common ancestry
- Scotch-Irish 8% Romanian 8% Hispanic 6%
- Foreign-born
- 18% · Canada, Jamaica, Vietnam
- Languages at home
- 78% English-only · Spanish 10% French/Haitian/Cajun 6% Other Indo-European 2%
Political lean MEDSL · Palm Beach
- 2024 margin
- Toss-up / Even · D 50.0% · R 49.2%
- 2008→2024 swing
- -22.1pp toward R · 2008: 22.9pp · 2024: 0.8pp
- All cycles
- 2024: D+0.8 2020: D+12.8 2016: D+15.3 2012: D+17.0 2008: D+22.9
Not yet ingested
- Civics
- —
Market trends
- HPI YoY
- ▼ -0.24%
- Current HPI
- 257.5891
- Rent YoY
- ▲ 1.28%
- Metro
- Miami-Fort Lauderdale-Pompano Beach, FL
- State GDP YoY
- ▲ 3.28%
- F500 in state
- 36
Industry mix (Fortune 500 HQ in FL)
| Industry | F500 HQs | Revenue |
|---|---|---|
| Industrial Technology | 2 | $29B |
|
||
| Insurance | 2 | $17B |
|
||
| Retail | 1 | $60B |
|
||
| Technology Distribution | 1 | $58B |
|
||
| Homebuilding | 1 | $35B |
|
||
| Technology Manufacturing | 1 | $35B |
|
||
Price history
+42.4% since first listed15 events — show timeline
- 2026-05-29 Listed $299,000 Beaches MLS
- 2026-04-30 Listing Removed — Beaches MLS
- 2026-01-06 Rental Removed $2,500 GFLMLS
- 2025-10-23 Price Changed $2,500 GFLMLS
- 2025-09-21 Listed for Rent $3,000 GFLMLS
- 2025-04-30 Listed $285,000 Beaches MLS
- 2024-10-07 Sold (Public Records) $195,000 Public Records
- 2024-10-03 Sold (MLS) $195,000 MARMLS
- 2024-09-16 Pending — MARMLS
- 2024-09-03 Contingent — MARMLS
- 2024-08-25 Price Changed $199,900 MARMLS
- 2024-08-08 Relisted — MARMLS
- 2024-08-05 Pending — MARMLS
- 2024-07-25 Contingent — MARMLS
- 2024-07-16 Listed $209,900 MARMLS
Property tax history
+12.5%/yrLatest (2025): $2,956 · +488.9% YoY. Source: county tax records.
Cash-flow waterfall
monthlySold comps — $/sqft
last 12 mo · ≤1 miLoading sold comps…