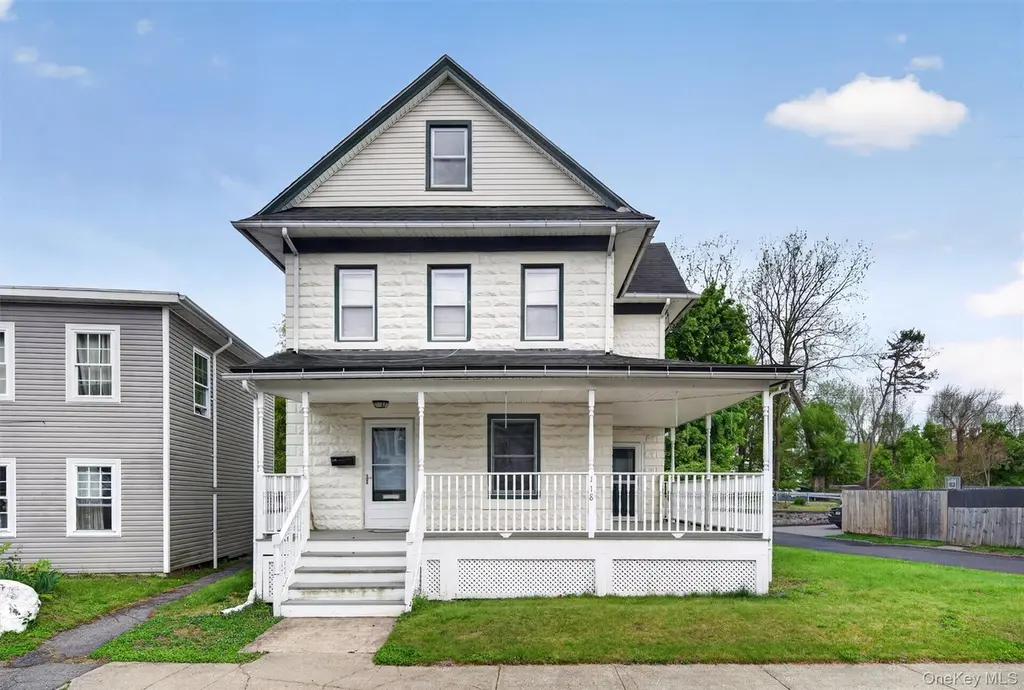
118 W Main St · Port Jervis, NY
Flood risk 9/10 · Severe
- FEMA flood zone
- X (shaded)
- Chance of flooding over 30 yrs
- 0.99%
- Est. flood insurance / yr
- $473 – $860
Fire risk 4/10 · Minor
- Est. fire insurance / yr
- $691 – $1,283
Heat risk 4/10 · Minor
- Hot days now (above 97°F)
- 8 days/yr
- Hot days in 30 yrs
- 17 days/yr
Wind risk 3/10 · Minor
- Chance of severe wind over 30 yrs
- 7.0%
Air-quality risk 2/10 · Minimal
- Unhealthy air days now
- 1 days/yr
- Unhealthy air days in 30 yrs
- 2 days/yr
Risk factors via First Street. Map © Google.
Why this score? — see what drove the D grade
The composite is a weighted blend of 9 inputs, each scored 0–100. Each bar is that input's sub-score; the figure is the points it added to the 100-point composite (weight × sub-score).
- Cash flow +14.7/30.0
- ARV discount +8.8/15.0
- DSCR +4.5/10.0
- 1% rule +4.0/10.0
- Schools +3.9/10.0
- Livability +3.5/5.0
- Rent growth +2.5/5.0
- Condition / age +2.5/5.0
- Appreciation +0.0/10.0
$250,000
🖨 Deal sheet 📄 Offer letter ✓ Due diligence
Listing remarks MLS
CHARMING 1910 TWO STORY CITY HOME WITH A WRAP AROUND ROCKING CHAIR FRONT PORCH. BACKYARD HAS AN OVER SIZED TWO CAR GARAGE WITH LOTS OF STORAGE SPACE. THE DINING ROOM AND LIVING ROOM HAVE HARDWOOD FLOORS. THERE IS A FULL BASEMENT AND A WALK UP ATTIC. Additional Information: ParkingFeatures:2 Car Detached,
Key facts
- 5,000 sq ft lot
- 2 garage spots
- Built 1910
Property features AI
Exterior
- Parking: Driveway; Off-street parking; 2-car garage; No carport
- Utilities: Public sewer; Sewer connected; Natural gas connected
- Home design: Single family residence
- Construction: Building area reported (total building area provided)
- Exterior features: Not waterfront; Other construction materials; Other foundation
Interior
- Kitchen: Range; Refrigerator
- Bedrooms: Total of 5 rooms (bedrooms/other rooms included) — attic with stairs and a full basement
- Bathrooms: 1 full bathroom; 1 half bathroom
- Heating & cooling: Hot water heating; Steam heating; No central air conditioning
- Interior features: Formal dining room; Wood burning stove / fireplace
- Laundry & utility: Natural gas connected
Neighborhood map
What this means for you Summary
Snapshot
- This is a 3-bed/2.0-bath single-family listed at $250k.
Deal economics
- At list price, monthly cash flow is $11 ($128/yr) — positive.
- The deal already cash-flows at list — no discount required.
- To meet the 1% rule (rent ≥ 1% of price), the offer needs to be $224k (10.5% below list).
- Recommended offer: $224k (10.5% below list) — sets the bar for 1% rule.
- Cap rate 6.6% vs local median 4.6% in Port Jervis — top-decile yield for the area; either an underpriced asset or a hidden risk that comps aren't pricing in. Stress-test before assuming the spread holds.
Location & tenants
- Location reads 69/100 on livability (#475 in NY) — a middle-class / working-renter tenant base. Strengths: health & safety A+, amenities B+, cost of living B+; Watch: housing C-, crime D+, employment F.
- Port Jervis City School District (rural): math 43% / reading 50% proficiency, ranked #451 of 590 in NY (top 76%) — families likely to look elsewhere, expect single-tenant / working-renter base with shorter leases.
- Zoned schools: Anna S Kuhl Elementary School (math 35% / reading 49%, grade F, #1,361 of 2,108 statewide, top 67%, 755 students, 63% FRL); Port Jervis Middle School (math 22% / reading 35%, grade F, #569 of 729 statewide, top 78%, 379 students, 59% FRL); Port Jervis Senior High School (math 87% / reading 95%, grade A+, #203 of 1,100 statewide, top 20%, 750 students, 55% FRL).
- Market conditions: 107 active listings in the ZIP; 17 comparable units currently listed for rent nearby; rentals at typical pace (median 17d on market — plan ~3-4 weeks tenant-placement turnaround); 1,746 units permitted in Orange County in 2024 (1,265 in 5+ unit buildings).
- This rent runs 39% of the median local income ($68k/yr) — at the standard rent-burdened threshold; future hikes will face affordability resistance.
Forward outlook
- Local home prices are declining (-3.0%/yr); year-one equity from $2k of loan paydown is wiped out by about $8k of value loss. Plan a longer hold.
Negotiation context
- It's been on market 34 days — a 3% lower offer ($242k) is reasonable based on typical stale-listing flexibility.
- 2 sale attempts since 6y ago with the ask held roughly flat each time — persistent listings suggest the price (not the market) is what's stuck; bring a comps-based counter.
- Current owner paid $147k; list at $250k implies a 70% gain — meaningful room to come down on a strong offer.
Risks & watch-outs
- Watch-outs: flood insurance adds $56/mo; built in 1910 — expect roof / HVAC / electrical / plumbing capex.
- Climate carrying-cost: severe flood risk — expect insurance premiums to compound above CPI over the hold.
Questions for the listing agent
- It's been on market 34 days. Have you received any prior offers? Is the seller open to a 10% concession, seller financing, or rate buy-down credit?
- Built in 1910 — when were the roof, HVAC, electrical panel, plumbing, and water heater last replaced?
- What's the actual annual flood-insurance premium (NFIP or private), and is the property in a SFHA with mandatory coverage?
- Is there a deadline driving the sale (1031 exchange, divorce, estate, relocation)? That informs how much negotiation room exists.
- Crime grade is D in this area — have there been break-ins, vandalism, or insurance claims at this property in the last 3 years? What carrier currently insures it and at what premium?
- The area grade is low — what's the realistic commute time and amenity access for the typical tenant pool here? Any planned neighborhood developments (good or bad) we should know about?
- What's the average days-on-market for RENTAL listings here right now (not sales)? A rising rental-DOM trend means longer vacancies and softer asking-rent achievability than the comps imply.
- What's the recent tenant-quality profile in this submarket — average credit score on applications, eviction rate, late-payment / NSF rate, and stable-employment percentage? A property-management company in the area should have these aggregated.
- How much new for-sale + rental construction is in the pipeline within 1–3 miles? Heavy new supply typically softens prices + rents 12–24 months out; constrained supply supports both.
Investment metrics
- 1% rule
- 0.90% ✗
- Cap rate
- 6.61%
- Cash-on-cash
- 1.14%
- DSCR
- 1.05
- GRM
- 9.3
CMA / ARV
- ARV (median comp)
- $257,364
- List price
- $250,000
- Delta
- -2.86%
- Verdict
- FAIR
- Comps
- 20 within 1.0 mi
Show comp detail 12 sales within ~0.75 mi
| Address | Dist | Beds/Ba | Sqft | Sold | Price | $/sf | Match |
|---|---|---|---|---|---|---|---|
| 31 Buckley St | 0.26mi | 3/1.0 | 1,424 (+8%) | 3mo | $168,000 | $118 | 69 |
| 900 1st St | 0.40mi | 2/2.0 (-1) | 1,298 (-2%) | 7mo | $259,000 | $200 | 67 |
| 703 3rd St | 0.52mi | 4/1.5 (+1) | 1,292 (-2%) | 4mo | $305,000 | $236 | 61 |
| 83 W Main St | 0.21mi | 3/1.0 | 1,170 (-12%) | 8mo | $194,900 | $167 | 60 |
| 607 3rd St | 0.53mi | 3/1.0 | 1,364 (+3%) | 8mo | $180,000 | $132 | 60 |
| 20 Buckley St | 0.28mi | 2/1.5 (-1) | 1,192 (-10%) | 8mo | $170,000 | $143 | 57 |
| 29 Thompson St | 0.36mi | 3/1.0 | 1,200 (-9%) | 9mo | $270,000 | $225 | 56 |
| 18 Francis St | 0.56mi | 3/1.0 | 1,232 (-7%) | 7mo | $145,000 | $118 | 52 |
| 14 Washington Ave | 0.38mi | 3/1.5 | 1,521 (+15%) | 6mo | $235,000 | $155 | 51 |
| 200 Avenue L | 0.68mi | 2/2.0 (-1) | 1,255 (-5%) | 8mo | $373,750 | $298 | 48 |
| 106 Avenue I | 0.56mi | 2/1.0 (-1) | 1,446 (+9%) | 8mo | $307,000 | $212 | 43 |
| 18 Hornbeck Ave | 0.73mi | 3/1.5 | 1,484 (+12%) | 2mo | $335,000 | $226 | 42 |
Match score weights: distance 35% · size 25% · config 20% · recency 20%. Top-matched comps best support the ARV.
Projected returns pro-forma
-3.0% appreciation · 3.0% rent growth · sell at horizon
- IRR
- -16.0%
- Equity multiple
- 0.43×
- Total profit
- $-39,779
- Equity at exit
- $37,276
- IRR
- -7.6%
- Equity multiple
- 0.52×
- Total profit
- $-33,552
- Equity at exit
- $21,615
Cash invested: $70,000 (down + closing). Projections, not guarantees.
Landlord ↔ Tenant lean methodology
- Overall (STATE)
- 15 Strongly Tenant-Friendly
- State New York
- 15 Strongly Tenant-Friendly · D+10
- County
- — inherits STATE
- City
- — inherits STATE
ZIP-level market 12771
- Home prices YoY
- -20.1%
- Active inventory
- 107
- Price-to-rent
- 9.3×
Monthly cashflow live
- Estimated rent
- $2,238 high interval (Pro) →
- Mortgage (P&I)
- −$1,311
- Tax from tax record
- −$286 /mo · $3,436/yr
- Insurance
- −$104
- Flood insurance flood zone
- −$56 /mo · $666/yr
- HOA
- −$0
- Vacancy / Maint / Mgmt
- −$470
- Net cashflow
- $11
Break-even live
UW: 25.0% down · 7.5% · 30yr · 1.5% tax · 5.0% vac · 8.0% maint · 8.0% mgmt
Financing live
Cash to close
- Down payment
- $62,500
- Closing costs
- $7,500
- Reserves months
- —
- Total cash needed
- —
Loan-product check · same deal, 3 products live
Conventional
25% down · 7.5% · 30yr
- Down + closing
- —
- Monthly P&I
- —
- Monthly cashflow
- —
- DSCR
- —
- Eligible?
- —
Personal DTI + credit; lowest rate.
DSCR
20% down · 8.5% · 30yr
- Down + closing
- —
- Monthly P&I
- —
- Monthly cashflow
- —
- DSCR
- —
- Eligible?
- —
No personal income docs; deal must DSCR.
Hard money
10% down · 12.0% · 12mo
- Down + closing
- —
- Monthly P&I
- —
- Monthly cashflow
- —
- DSCR
- —
- Eligible?
- —
Short-term bridge; refi at stabilization.
Rent comps 17 comps
| Address | Beds | Baths | Sqft | Rent | $/sqft | DOM | Units | Dist |
|---|---|---|---|---|---|---|---|---|
| 11 Grandview Ave Port Jervis, NY | 4.0 | 2.5 | 1800 | $2,850 | $1.58 | 13d | 1 | 0.09mi |
| 7 King St Port Jervis, NY | 3.0 | 1.0 | 1300 | $2,400 | $1.85 | 20d | 1 | 0.35mi |
| 7 King St Port Jervis, NY | 3.0 | 1.0 | 1300 | $2,200 | $1.69 | 13d | 1 | 0.35mi |
| 9 King St Port Jervis, NY | 2.0 | 1.0 | 1080 | $1,950 | $1.81 | 19d | 1 | 0.36mi |
| 14 Liberty St Unit B Port Jervis, NY | 2.0 | 1.0 | 1032 | $1,700 | $1.65 | 13d | 1 | 0.42mi |
| 20 Delaware St Unit A Port Jervis, NY | 2.0 | 1.0 | 1000 | $2,000 | $2.00 | 23d | 1 | 0.43mi |
| 49 Orange St Port Jervis, NY | 4.0 | 1.0 | 1688 | $2,200 | $1.30 | 43d | 1 | 0.71mi |
| 2 Dervend Cir Matamoras, PA | 2.0 | 1.0 | 960 | $1,750 | $1.82 | 1d | 1 | 0.82mi |
| 39 Church St #22 Port Jervis, NY | 2.0 | 1.0 | 879 | $1,700 | $1.93 | 21d | 1 | 0.84mi |
| 39 Church St Port Jervis, NY | 1.0–2.0 | 1.0 | 685 | $1,700 | $2.48 | 14d | 2 | 0.84mi |
| 131 Front St Port Jervis, NY | 3.0 | 1.0 | 1200 | $2,100 | $1.75 | 22d | 1 | 0.86mi |
| 104 Ball St Unit 1 Port Jervis, NY | 3.0 | 1.0 | 1700 | $1,850 | $1.09 | 10d | 1 | 0.86mi |
| 106 Ball St #1 Port Jervis, NY | 2.0 | 1.0 | 1062 | $2,000 | $1.88 | 43d | 1 | 0.87mi |
| 125 Hammond St Unit A Port Jervis, NY | 3.0 | 1.0 | 1300 | $1,750 | $1.35 | 13d | 1 | 0.92mi |
| 144 Jersey Ave Unit 2 Port Jervis, NY | 2.0 | 1.0 | 960 | $1,790 | $1.86 | 17d | 1 | 0.98mi |
| 29 Culvert St Port Jervis, NY | 1.0–2.0 | 1.0 | 775 | $1,850 | $2.39 | 1d | 1 | 1.20mi |
| 29 Culvert St Port Jervis, NY | 1.0–2.0 | 1.0 | 775 | $1,850 | $2.39 | 43d | 4 | 1.20mi |
Listing history 22 events
-
2026-06-18status $250,000 Pending 34 DOM
-
2026-06-18days on market $250,000 Active 34 DOM
-
2026-06-17days on market $250,000 Active 33 DOM
-
2026-06-16days on market $250,000 Active 32 DOM
-
2026-06-15days on market $250,000 Active 31 DOM
-
2026-06-14days on market $250,000 Active 29 DOM
-
2026-06-13days on market $250,000 Active 28 DOM
-
2026-06-10days on market $250,000 Active 26 DOM
-
2026-06-09days on market $250,000 Active 25 DOM
-
2026-06-08days on market $250,000 Active 24 DOM
-
2026-06-07days on market $250,000 Active 23 DOM
-
2026-06-03days on market $250,000 Active 19 DOM
-
2026-06-02days on market $250,000 Active 18 DOM
-
2026-06-01days on market $250,000 Active 17 DOM
-
2026-05-31days on market $250,000 Active 16 DOM
-
2026-05-30days on market $250,000 Active 15 DOM
-
2026-05-15$255,000 Active 712-char remark
-
2026-05-11historical $255,000 712-char remark
-
2020-10-29soldstatus $147,100
-
2020-07-28historical 306-char remark
Show marketing remark (306 chars)
CHARMING 1910 TWO STORY CITY HOME WITH A WRAP AROUND ROCKING CHAIR FRONT PORCH. BACKYARD HAS AN OVER SIZED TWO CAR GARAGE WITH LOTS OF STORAGE SPACE. THE DINING ROOM AND LIVING ROOM HAVE HARDWOOD FLOORS. THERE IS A FULL BASEMENT AND A WALK UP ATTIC. Additional Information: ParkingFeatures:2 Car Detached,
-
2020-07-28soldstatus $147,100 Closed 306-char remark
Show marketing remark (306 chars)
CHARMING 1910 TWO STORY CITY HOME WITH A WRAP AROUND ROCKING CHAIR FRONT PORCH. BACKYARD HAS AN OVER SIZED TWO CAR GARAGE WITH LOTS OF STORAGE SPACE. THE DINING ROOM AND LIVING ROOM HAVE HARDWOOD FLOORS. THERE IS A FULL BASEMENT AND A WALK UP ATTIC. Additional Information: ParkingFeatures:2 Car Detached,
-
2020-02-18$149,900 Active 306-char remark
Show marketing remark (306 chars)
CHARMING 1910 TWO STORY CITY HOME WITH A WRAP AROUND ROCKING CHAIR FRONT PORCH. BACKYARD HAS AN OVER SIZED TWO CAR GARAGE WITH LOTS OF STORAGE SPACE. THE DINING ROOM AND LIVING ROOM HAVE HARDWOOD FLOORS. THERE IS A FULL BASEMENT AND A WALK UP ATTIC. Additional Information: ParkingFeatures:2 Car Detached,
ⓘ Source: listings_history table (triggers on properties + properties_extension) + one-shot
backfill from property_details.listing_events for pre-trigger history.
Tax reassessment forecast NY · Partial reset (capped growth)
- Current annual tax
- $3,436 · $286/mo
- Projected year-2 tax
- $3,830 · $319/mo
- Expected delta
- +$395/yr (+$33/mo · 11.5%)
ⓘ Screening estimate from a state-policy table — verify with the county assessor before closing.
Climate risk First Street
- Flood 9/10 Extreme FEMA zone X (shaded) · 99% chance over 30 yrs
- Wildfire 4/10 Moderate
- Heat 4/10 Moderate 8 d/yr ≥97°F today · 17 d/yr by 30 yrs out
- Wind 3/10 Moderate 7% chance of damaging wind over 30 yrs
- Air quality 2/10 Low 1 unhealthy d/yr today · 2 by 30 yrs out
Nearby sold comps map
Loading sold comps map…
Walkable amenities ~0.75 mi
Loading nearby amenities…
Taxation est. · year 1
- Rental income
- $26,851
- − Mortgage interest
- −$14,004
- − Property taxes
- −$3,436
- − Insurance
- −$1,916
- − Repairs & maintenance
- −$2,148
- − Management
- −$2,148
- − Depreciation
- −$7,273
- Taxable loss
- −$4,074
- Est. tax savings @ 24.0%
- +$978
- After-tax cash flow
- $1,106/yr
For passive investors: Depreciation is non-cash, so a rental often shows a tax loss while cash-flowing — sheltering income. Rental losses are passive: they offset passive income freely, and up to $25,000/yr can offset ordinary (W-2) income if you actively participate and your MAGI is under $100k (phasing out to $0 by $150k); unused losses carry forward. On sale, claimed depreciation is recaptured at up to 25%, and gains may owe capital-gains tax (a 1031 exchange can defer both). Figures are a year-1 estimate at your 24.0% rate — not tax advice; consult a CPA.
Schools (NCES district)
- District
- Port Jervis City School District
- NCES district ID
- 3623520
- Math proficiency
- 43% ▼ -7.00%
- Reading proficiency
- 50% ▲ 5.00%
- Median HH income
- $44,506
- Composite
- 39.33/100
- National rank
- #3984
- State rank
- #451 of 590 in NY
Livability — Port Jervis
- Score
- 69/100
- State rank
- #475
- US rank
- #8376
Category grades
Schools grade is shown separately in the Schools card above.
Census & demographics
- Census place
- Port Jervis, NY
- County
- Orange County · 267,004 people
- City population
- 14,049
- Metro
- Poughkeepsie-Newburgh-Middletown, NY
- Population (ZIP)
- 14,049
- Household income
- $68,136
- Rent vs Own
- Severe rent burden
- 792.0
Population outlook (Orange County) Hauer SSP2
- Today (2025)
- 379,830 people
- By 2030
- 378,955 · -0.2%
- By 2040
- 375,444 · -1.2%
- By 2050
- 369,311 · -2.8%
- By 2075
- 354,233 · -6.7%
- By 2100
- 318,150 · -16.2%
Race, ethnicity, and origin ACS 2023
- Neighborhood character
- Predominantly White (67%)
- Race & ethnicity
- White 67% Hispanic / Latino 18% Two or more races 11% Black 6% Asian 3% Native American 3%
- Hispanic origin (detail)
- Mexican 3% Puerto Rican 8% Dominican 2%
- Common ancestry
- Romanian 5% Iranian 4% Lithuanian 3%
- Foreign-born
- 10% · Canada, China, Jamaica
- Languages at home
- 84% English-only · Spanish 10% Other Indo-European 3% Chinese 2%
Political lean MEDSL · Orange
- 2024 margin
- Lean R (+8.4) · D 45.8% · R 54.2%
- 2008→2024 swing
- -12.5pp toward R · 2008: 4.1pp · 2024: -8.4pp
- All cycles
- 2024: R+8.4 2020: R+0.2 2016: R+6.5 2012: D+5.2 2008: D+4.1
Not yet ingested
- Civics
- —
Market trends
- HPI YoY
- ▼ -75.78%
- Current HPI
- 301.5132
- Rent YoY
- —
- Metro
- Poughkeepsie-Newburgh-Middletown, NY
- State GDP YoY
- ▲ 2.60%
- F500 in state
- 92
Industry mix (Fortune 500 HQ in NY)
| Industry | F500 HQs | Revenue |
|---|---|---|
| Financial Services | 10 | $950B |
|
||
| Consumer Goods | 9 | $162B |
|
||
| Insurance | 4 | $225B |
|
||
| Telecommunications | 2 | $144B |
|
||
| Pharmaceuticals | 2 | $112B |
|
||
| Media / Entertainment | 2 | $69B |
|
||
Price history
+66.8% since first listed7 events — show timeline
- 2026-05-27 Price Changed $250,000 OneKey® MLS as Distributed by MLS Grid
- 2026-05-15 Listed $255,000 OneKey® MLS as Distributed by MLS Grid
- 2026-05-11 Coming Soon $255,000 OneKey® MLS as Distributed by MLS Grid
- 2020-10-29 Sold (Public Records) $147,100 Public Records
- 2020-07-28 Listing Removed — OneKey® MLS as Distributed by MLS Grid
- 2020-07-28 Sold (MLS) $147,100 OneKey® MLS as Distributed by MLS Grid
- 2020-02-18 Listed $149,900 OneKey® MLS as Distributed by MLS Grid
Property tax history
+9.0%/yrLatest (2025): $3,436 · +6.3% YoY. Source: county tax records.
Cash-flow waterfall
monthlySold comps — $/sqft
last 12 mo · ≤1 miLoading sold comps…