 🏷️ Likely Rental
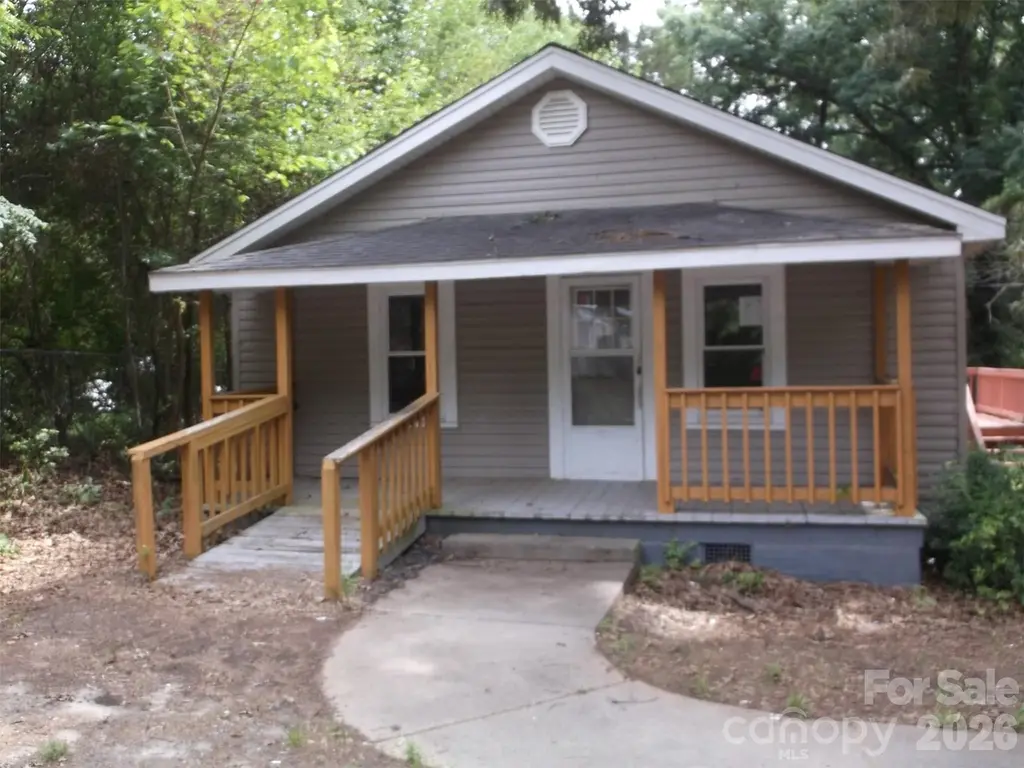
310 Arbor St · Wadesboro, NC
Flood risk 1/10 · Minimal
- FEMA flood zone
- X (unshaded)
- Chance of flooding over 30 yrs
- 0.0%
- Est. flood insurance / yr
- $507 – $1,088
Fire risk 4/10 · Minor
- Est. fire insurance / yr
- $906 – $1,684
Heat risk 6/10 · Moderate
- Hot days now (above 106°F)
- 7 days/yr
- Hot days in 30 yrs
- 16 days/yr
Wind risk 6/10 · Moderate
- Chance of severe wind over 30 yrs
- 55.0%
Air-quality risk 2/10 · Minimal
- Unhealthy air days now
- 1 days/yr
- Unhealthy air days in 30 yrs
- 2 days/yr
Risk factors via First Street. Map © Google.
Why this score? — see what drove the A- grade
The composite is a weighted blend of 9 inputs, each scored 0–100. Each bar is that input's sub-score; the figure is the points it added to the 100-point composite (weight × sub-score).
- Cash flow +30.0/30.0
- ARV discount +15.0/15.0
- 1% rule +10.0/10.0
- DSCR +10.0/10.0
- Appreciation +10.0/10.0
- Rent growth +2.5/5.0
- Condition / age +2.5/5.0
- Schools +2.1/10.0
- Livability +2.1/5.0
$92,000
🖨 Deal sheet 📄 Offer letter ✓ Due diligence
Listing remarks MLS
Remodeled 3 bedrooms with 2 full baths, family room, dining room, kitchen with appliances and dishwasher. Central heat & air and double pane vinyl windows keeps utility bills low. Covered front porch & 12 x 8.4 side deck for summer grilling! Both baths have been updated. Freshly painted, New plank floors & carpet in the bedrooms. Side streets for walks & a quick stop store just across 109 N and Airport Rd. Quick trip to shopping and schools. Recent structural changes make this house solid and up to 2021 building codes! Example: 100% Loan @ 2.37% Interest & Principle = $464.13/month. STOP RENTING & PAY LESS MONTHLY FOR YOUR OWN HOUSE!!
Key facts
- Value-add home
- Breakfast area
- 0.23 acre lot
Tags
Property features AI
Finance
- HOA & community: No HOA
Exterior
- Parking: Driveway parking
- Utilities: City/public water; Public sewer
- Home design: Single-family residence; Site-built construction; One story; R2 zoning
- Construction: Vinyl exterior; Composition roof; Crawl space foundation
- Exterior features: Lot approximately 0.23 acres; Roads are a mix of dirt and paved; Publicly maintained road access
Interior
- Kitchen: Electric range
- Bedrooms: Three bedrooms located on the main level
- Bathrooms: Two full bathrooms (main level)
- Heating & cooling: Heat pump heating; Central air conditioning
- Interior features: Seven total rooms; Room levels primarily on the main floor
- Laundry & utility: Laundry area located in the kitchen
Neighborhood map
What this means for you Summary
Snapshot
- This is a 3-bed/2.0-bath single-family listed at $92k.
Deal economics
- At list price, monthly cash flow is $735 ($9k/yr) — positive.
- The deal already cash-flows at list — no discount required.
- Meets the 1% rule at list price ($2k rent vs $92k).
- Recommended offer: $91k (1.5% below list) — sets the bar for market timing.
- Cap rate 15.9% vs local median 6.3% in Wadesboro — top-decile yield for the area; either an underpriced asset or a hidden risk that comps aren't pricing in. Stress-test before assuming the spread holds.
Location & tenants
- Location reads 41/100 on livability (#728 in NC) — a working-class tenant base; expect higher turnover. Strengths: cost of living A+; Watch: housing C-, schools F, crime F.
- Anson County Schools (rural): math 20% / reading 32% proficiency, ranked #159 of 178 in NC (top 89%) — low school quality limits family demand, transient renter base, plan for 1-2y turnover; 67% free/reduced lunch — lower-income household profile, screen leases tightly.
- Market conditions: 85 active listings in the ZIP; 55 units permitted in Anson County in 2024 (0 in 5+ unit buildings).
Forward outlook
- In year one you build about $10k of equity ($636 loan paydown + $9k appreciation (10.0% local appreciation)).
- Anson County population projected at -24% by 2050 — secular population decline; favor cash flow + early exit over multi-decade hold.
- At projected returns (10.0% appreciation + 3.0% rent growth), your $26k cash investment doubles in ~2 years — after that, you're playing with house money.
- By year 4, paydown + projected appreciation supports a ~$35k cash-out refi (75% LTV) — recoverable capital for the next deal without selling this one.
Negotiation context
- It's been on market 19 days — a 2% lower offer ($91k) is reasonable based on typical stale-listing flexibility.
- 9 sale attempts since 13y ago with the ask held roughly flat each time — persistent listings suggest the price (not the market) is what's stuck; bring a comps-based counter.
Risks & watch-outs
- Watch-outs: built in 1920 — expect roof / HVAC / electrical / plumbing capex.
- Climate carrying-cost: major wind risk, 55% chance of damaging wind over 30y; extreme-heat days projected 7→16/yr by 2055 (HVAC capex compounding) — expect insurance premiums to compound above CPI over the hold.
Questions for the listing agent
- Built in 1920 — when were the roof, HVAC, electrical panel, plumbing, and water heater last replaced?
- Is there a deadline driving the sale (1031 exchange, divorce, estate, relocation)? That informs how much negotiation room exists.
- Schools are F-rated, which usually means shorter tenancies and higher turnover. Who's the typical renter profile here, and what's been the actual vacancy rate?
- Crime grade is F in this area — have there been break-ins, vandalism, or insurance claims at this property in the last 3 years? What carrier currently insures it and at what premium?
- What's the average days-on-market for RENTAL listings here right now (not sales)? A rising rental-DOM trend means longer vacancies and softer asking-rent achievability than the comps imply.
- What's the recent tenant-quality profile in this submarket — average credit score on applications, eviction rate, late-payment / NSF rate, and stable-employment percentage? A property-management company in the area should have these aggregated.
- How much new for-sale + rental construction is in the pipeline within 1–3 miles? Heavy new supply typically softens prices + rents 12–24 months out; constrained supply supports both.
Investment metrics
- 1% rule
- 1.86% ✓
- Cap rate
- 15.87%
- Cash-on-cash
- 34.22%
- DSCR
- 2.52
- GRM
- 4.5
CMA / ARV
- ARV (on-the-fly)
- $172,224
- Comps found
- 5
Show comp detail 5 sales within ~0.75 mi
| Address | Dist | Beds/Ba | Sqft | Sold | Price | $/sf | Match |
|---|---|---|---|---|---|---|---|
| 832 Sikes Ave | 0.46mi | 3/2.0 | 1,173 (+6%) | 3mo | $165,000 | $141 | 66 |
| 203 Bennett St | 0.42mi | 3/2.0 | 1,232 (+12%) | 2mo | $214,000 | $174 | 59 |
| 203 Wheeler St | 0.64mi | 3/1.0 | 1,084 (-2%) | 7mo | $37,000 | $34 | 57 |
| 205 Bennett St | 0.43mi | 3/2.0 | 1,232 (+12%) | 5mo | $227,250 | $184 | 56 |
| 511 Lodge St | 0.74mi | 3/1.0 | 973 (-12%) | 8mo | $152,000 | $156 | 35 |
Match score weights: distance 35% · size 25% · config 20% · recency 20%. Top-matched comps best support the ARV.
Projected returns pro-forma
10.0% appreciation · 3.0% rent growth · sell at horizon
- IRR
- 50.5%
- Equity multiple
- 4.76×
- Total profit
- $96,905
- Equity at exit
- $82,881
- IRR
- 44.2%
- Equity multiple
- 10.65×
- Total profit
- $248,600
- Equity at exit
- $178,736
Cash invested: $25,760 (down + closing). Projections, not guarantees.
Landlord ↔ Tenant lean methodology
- Overall (STATE)
- 85 Strongly Landlord-Friendly
- State North Carolina
- 85 Strongly Landlord-Friendly · R+3
- County
- — inherits STATE
- City
- — inherits STATE
ZIP-level market 28170
- Home prices YoY
- 5.8%
- Active inventory
- 85
- Price-to-rent
- 4.5×
Monthly cashflow live
- Estimated rent
- $1,707 medium interval (Pro) →
- Mortgage (P&I)
- −$482
- Tax from tax record
- −$93 /mo · $1,117/yr
- Insurance
- −$38
- HOA
- −$0
- Vacancy / Maint / Mgmt
- −$358
- Net cashflow
- $735
Break-even live
UW: 25.0% down · 7.5% · 30yr · 1.5% tax · 5.0% vac · 8.0% maint · 8.0% mgmt
Financing live
Cash to close
- Down payment
- $23,000
- Closing costs
- $2,760
- Reserves months
- —
- Total cash needed
- —
Loan-product check · same deal, 3 products live
Conventional
25% down · 7.5% · 30yr
- Down + closing
- —
- Monthly P&I
- —
- Monthly cashflow
- —
- DSCR
- —
- Eligible?
- —
Personal DTI + credit; lowest rate.
DSCR
20% down · 8.5% · 30yr
- Down + closing
- —
- Monthly P&I
- —
- Monthly cashflow
- —
- DSCR
- —
- Eligible?
- —
No personal income docs; deal must DSCR.
Hard money
10% down · 12.0% · 12mo
- Down + closing
- —
- Monthly P&I
- —
- Monthly cashflow
- —
- DSCR
- —
- Eligible?
- —
Short-term bridge; refi at stabilization.
Listing history 16 events
-
2026-06-18status $92,000 Pending 19 DOM
-
2026-06-18days on market $92,000 Active 19 DOM
-
2026-06-17days on market $92,000 Active 18 DOM
-
2026-06-16days on market $92,000 Active 17 DOM
-
2026-06-15days on market $92,000 Active 16 DOM
-
2026-06-13days on market $92,000 Active 14 DOM
-
2026-06-12days on market $92,000 Active 13 DOM
-
2026-06-09days on market $92,000 Active 10 DOM
-
2026-06-08days on market $92,000 Active 9 DOM
-
2026-06-07days on market $92,000 Active 8 DOM
-
2026-06-07days on market $92,000 Active 7 DOM
-
2026-06-04days on market $92,000 Active 4 DOM
-
2026-06-02days on market $92,000 Active 3 DOM
-
2026-06-01days on market $92,000 Active 2 DOM
-
2026-05-31remarks 695-char remark
-
2026-05-31$92,000 Active 1 DOM
ⓘ Source: listings_history table (triggers on properties + properties_extension) + one-shot
backfill from property_details.listing_events for pre-trigger history.
Tax reassessment forecast NC · Resets to sale price
- Current annual tax
- $1,117 · $93/mo
- Projected year-2 tax
- $1,117 · $93/mo
- Expected delta
- $0/yr ($0/mo · 0.0%)
ⓘ Screening estimate from a state-policy table — verify with the county assessor before closing.
Climate risk First Street
- Flood 1/10 Low FEMA zone X (unshaded) · 0% chance over 30 yrs
- Wildfire 4/10 Moderate
- Heat 6/10 Major 7 d/yr ≥106°F today · 16 d/yr by 30 yrs out
- Wind 6/10 Major 55% chance of damaging wind over 30 yrs
- Air quality 2/10 Low 1 unhealthy d/yr today · 2 by 30 yrs out
Nearby sold comps map
Loading sold comps map…
Walkable amenities ~0.75 mi
Loading nearby amenities…
Taxation est. · year 1
- Rental income
- $20,483
- − Mortgage interest
- −$5,153
- − Property taxes
- −$1,117
- − Insurance
- −$460
- − Repairs & maintenance
- −$1,639
- − Management
- −$1,639
- − Depreciation
- −$2,676
- Taxable income
- $7,799
- Est. tax owed @ 24.0%
- −$1,872
- After-tax cash flow
- $6,943/yr
For passive investors: Depreciation is non-cash, so a rental often shows a tax loss while cash-flowing — sheltering income. Rental losses are passive: they offset passive income freely, and up to $25,000/yr can offset ordinary (W-2) income if you actively participate and your MAGI is under $100k (phasing out to $0 by $150k); unused losses carry forward. On sale, claimed depreciation is recaptured at up to 25%, and gains may owe capital-gains tax (a 1031 exchange can defer both). Figures are a year-1 estimate at your 24.0% rate — not tax advice; consult a CPA.
Schools (NCES district)
- District
- Anson County Schools
- NCES district ID
- 3700180
- Math proficiency
- 20% ▼ -7.00%
- Reading proficiency
- 32% ▼ -1.00%
- Median HH income
- $34,961
- Composite
- 21.41/100
- National rank
- #8348
- State rank
- #159 of 178 in NC
Livability — Wadesboro
- Score
- 41/100
- State rank
- #728
- US rank
- #27112
Category grades
Schools grade is shown separately in the Schools card above.
Census & demographics
- Census place
- Wadesboro, NC
- Population (ZIP)
- 9,595
Population outlook (Anson County) Hauer SSP2
- Today (2025)
- 23,572 people
- By 2030
- 22,384 · -5.0%
- By 2040
- 19,976 · -15.3%
- By 2050
- 17,803 · -24.5%
- By 2075
- 13,839 · -41.3%
- By 2100
- 10,890 · -53.8%
Race, ethnicity, and origin ACS 2023
- Neighborhood character
- Diverse neighborhood (Simpson 0.57)
- Race & ethnicity
- Black 53% White 38% Two or more races 4% Asian 3% Hispanic / Latino 2%
- Common ancestry
- Slovak 1% Russian 1% Serbian 1%
- Foreign-born
- 4% · Canada, South Korea
- Languages at home
- 95% English-only · Spanish 2% Other Asian/Pacific 1% Korean 1%
Political lean MEDSL · Anson
- 2024 margin
- Toss-up / Even · D 48.4% · R 50.9%
- 2008→2024 swing
- -23.5pp toward R · 2008: 20.9pp · 2024: -2.5pp
- All cycles
- 2024: R+2.5 2020: D+4.2 2016: D+12.6 2012: D+25.0 2008: D+20.9
Not yet ingested
- Civics
- —
Market trends
- HPI YoY
- ▲ 12.62%
- Current HPI
- 228.7798
- Rent YoY
- —
- Metro
- —
- State GDP YoY
- ▲ 3.28%
- F500 in state
- 26
Industry mix (Fortune 500 HQ in NC)
| Industry | F500 HQs | Revenue |
|---|---|---|
| Financial Services | 2 | $213B |
|
||
| Retail | 2 | $95B |
|
||
| Industrial Conglomerate | 1 | $38B |
|
||
| Metals / Steel | 1 | $35B |
|
||
| Utilities | 1 | $30B |
|
||
| Industrial Machinery | 1 | $19B |
|
||
Price history
+9.5% since first listed22 events — show timeline
- 2026-05-29 Listed $92,000 CANOPYMLS as Distributed by MLS Grid
- 2024-07-01 Price Changed $125,000 CANOPYMLS as Distributed by MLS Grid
- 2024-03-27 Relisted — CANOPYMLS as Distributed by MLS Grid
- 2024-02-10 Listed $129,900 CANOPYMLS as Distributed by MLS Grid
- 2022-03-02 Sold (Public Records) $111,000 Public Records
- 2022-03-02 Sold (MLS) $111,000 CANOPYMLS as Distributed by MLS Grid
- 2022-01-28 Contingent — CANOPYMLS as Distributed by MLS Grid
- 2022-01-26 Relisted — CANOPYMLS as Distributed by MLS Grid
- 2022-01-25 Relisted — CANOPYMLS as Distributed by MLS Grid
- 2021-12-14 Contingent — CANOPYMLS as Distributed by MLS Grid
- 2021-10-29 Price Changed $110,000 CANOPYMLS as Distributed by MLS Grid
- 2021-08-09 Listed $119,500 CANOPYMLS as Distributed by MLS Grid
- 2013-09-27 Sold (MLS) $20,000 CANOPYMLS as Distributed by MLS Grid
- 2013-09-18 Contingent — CANOPYMLS as Distributed by MLS Grid
- 2013-09-03 Relisted — CANOPYMLS as Distributed by MLS Grid
- 2013-08-14 Delisted — CANOPYMLS as Distributed by MLS Grid
- 2013-05-14 Price Changed $27,100 CANOPYMLS as Distributed by MLS Grid
- 2013-04-29 Relisted — CANOPYMLS as Distributed by MLS Grid
- 2013-04-29 Delisted — CANOPYMLS as Distributed by MLS Grid
- 2013-02-28 Price Changed $28,500 CANOPYMLS as Distributed by MLS Grid
- 2013-01-30 Listed $29,900 CANOPYMLS as Distributed by MLS Grid
- 2008-07-24 Sold (Public Records) $84,000 Public Records
Property tax history
+4.4%/yrLatest (2025): $1,117 · +4.5% YoY. Source: county tax records.
Cash-flow waterfall
monthlySold comps — $/sqft
last 12 mo · ≤1 miLoading sold comps…