12 Nelson Canyon Rd · Peach Springs, AZ
Flood risk No data
- FEMA flood zone
- —
- Chance of flooding over 30 yrs
- —
- Est. flood insurance / yr
- —
Fire risk No data
- Est. fire insurance / yr
- —
Heat risk No data
- Hot days now (above threshold)
- —
- Hot days in 30 yrs
- —
Wind risk No data
- Chance of severe wind over 30 yrs
- —
Air-quality risk No data
- Unhealthy air days now
- —
- Unhealthy air days in 30 yrs
- —
Risk factors via First Street. Map © Google.
Why this score? — see what drove the B grade
The composite is a weighted blend of 9 inputs, each scored 0–100. Each bar is that input's sub-score; the figure is the points it added to the 100-point composite (weight × sub-score).
- Cash flow +30.0/30.0
- 1% rule +10.0/10.0
- DSCR +10.0/10.0
- ARV discount +7.5/15.0
- Appreciation +4.0/10.0
- Livability +3.4/5.0
- Rent growth +2.5/5.0
- Schools +2.4/10.0
- Condition / age +1.0/5.0
$115,000
🖨 Deal sheet (PDF) 📄 Offer letter ✓ Due diligence
Listing remarks MLS
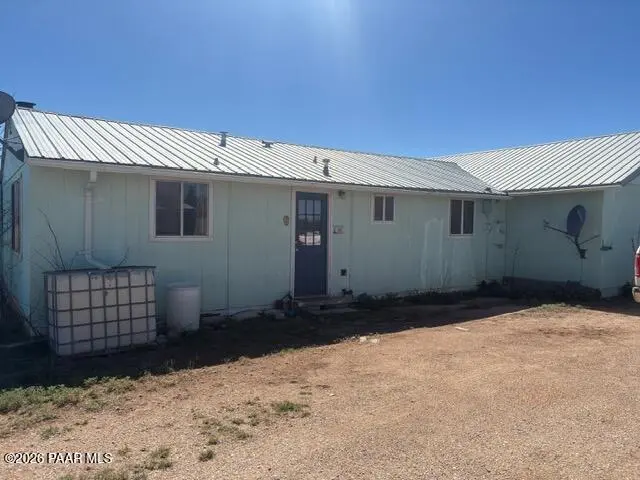
Off Grid Living on 40-acres! Looking for space to breathe? This 4bd/3ba home outside Seligman, AZ, sits on 40 fully fenced acres with some of the best panoramic views in the state. Includes a dedicated horse area and is powered by solar, offering true independence in the heart of the rural Southwest. Bring the animals, bring the toys, and enjoy the quiet life!
Key facts
- 40 acre lot
- Built 1993
- Listed 73 days
Neighborhood map
What this means for you Summary
Snapshot
- This is a 4-bed/3.0-bath single-family listed at $115k. Condition is rated poor.
Deal economics
- At list price, monthly cash flow is $669 ($8k/yr) — positive.
- The deal already cash-flows at list — no discount required.
- Meets the 1% rule at list price ($2k rent vs $115k).
- Recommended offer: $108k (6.0% below list) — sets the bar for market timing.
Location & tenants
- Location reads 67/100 on livability (#64 in AZ) — a middle-class / working-renter tenant base. Strengths: commute A+, cost of living A+, crime B+; Watch: amenities F, employment D-, health & safety F.
- Seligman Unified District (4472) (rural): math 20% / reading 30% proficiency, ranked #339 of 501 in AZ (top 68%) — low school quality limits family demand, transient renter base, plan for 1-2y turnover.
- Zoned schools: Seligman Elementary School (math 24% / reading 34%, grade F, #548 of 1,109 statewide, top 51%, 139 students, 67% FRL); Seligman High School (math 24% / reading 24%, grade F, #154 of 381 statewide, top 53%, 60 students, 72% FRL) — zoned schools average 69% FRL vs 54% district-wide (15 pts higher); higher-poverty schools than district average — tighter screening recommended.
- Market conditions: 295 active listings in the ZIP; 2,062 units permitted in Yavapai County in 2024 (98 in 5+ unit buildings).
Forward outlook
- Local home prices are declining (-2.0%/yr); year-one equity from $795 of loan paydown is wiped out by about $2k of value loss. Plan a longer hold.
- Yavapai County population projected at +10% by 2050 — modest demand growth; plan on rents tracking national, not racing it.
- At projected returns (-2.0% appreciation + 3.0% rent growth), your $32k cash investment doubles in ~5 years — after that, you're playing with house money.
Negotiation context
- It's been on market 73 days — a 6% lower offer ($108k) is reasonable based on typical stale-listing flexibility.
Questions for the listing agent
- It's been on market 73 days. Have you received any prior offers? Is the seller open to a 6% concession, seller financing, or rate buy-down credit?
- Have any recent inspections been done? Can we get a copy of the seller's disclosures and any deferred-maintenance estimates?
- Why hasn't it sold? Are there any deal-killer items the seller is aware of (foundation, flood, title, zoning, code violations)?
- Is there a deadline driving the sale (1031 exchange, divorce, estate, relocation)? That informs how much negotiation room exists.
- Schools are F-rated, which usually means shorter tenancies and higher turnover. Who's the typical renter profile here, and what's been the actual vacancy rate?
- What's the average days-on-market for RENTAL listings here right now (not sales)? A rising rental-DOM trend means longer vacancies and softer asking-rent achievability than the comps imply.
- What's the recent tenant-quality profile in this submarket — average credit score on applications, eviction rate, late-payment / NSF rate, and stable-employment percentage? A property-management company in the area should have these aggregated.
- How much new for-sale + rental construction is in the pipeline within 1–3 miles? Heavy new supply typically softens prices + rents 12–24 months out; constrained supply supports both.
Investment metrics
- 1% rule
- 1.61% ✓
- Cap rate
- 13.27%
- Cash-on-cash
- 24.92%
- DSCR
- 2.11
- GRM
- 5.2
CMA / ARV
No comps found within radius.
Projected returns pro-forma
-2.0% appreciation · 3.0% rent growth · sell at horizon
- IRR
- 20.7%
- Equity multiple
- 1.90×
- Total profit
- $28,861
- Equity at exit
- $22,331
- IRR
- 27.5%
- Equity multiple
- 3.62×
- Total profit
- $84,440
- Equity at exit
- $19,080
Cash invested: $32,200 (down + closing). Projections, not guarantees.
Landlord ↔ Tenant lean methodology
- Overall (STATE)
- 87 Strongly Landlord-Friendly
- State Arizona
- 87 Strongly Landlord-Friendly · R+3
- County
- — inherits STATE
- City
- — inherits STATE
ZIP-level market 86337
- Home prices YoY
- -1.0%
- Active inventory
- 295
- Price-to-rent
- 5.2×
Monthly cashflow live
- Estimated rent
- $1,853 medium interval (Pro) →
- Mortgage (P&I)
- −$603
- Tax est. 1.5%
- −$144 /mo · $1,725/yr
- Insurance
- −$48
- HOA
- −$0
- Lot rent
- −$0
- Vacancy / Maint / Mgmt
- −$389
- Net cashflow
- $669
Break-even live
Sensitivity live
| Price | -10% $748 | -5% $709 | +0% $669 | +5% $629 | +10% $589 |
|---|---|---|---|---|---|
| Rent | -10% $522 | -5% $596 | +0% $669 | +5% $742 | +10% $815 |
| Rate | -1.0pp $727 | -0.5pp $698 | base $669 | +0.5pp $639 | +1.0pp $609 |
UW: 25.0% down · 7.5% · 30yr · 1.5% tax · 5.0% vac · 8.0% maint · 8.0% mgmt
Financing live
Cash to close
- Down payment
- $28,750
- Closing costs
- $3,450
- Reserves months
- —
- Total cash needed
- —
Loan-product check · same deal, 3 products live
Conventional
25% down · 7.5% · 30yr
- Down + closing
- —
- Monthly P&I
- —
- Monthly cashflow
- —
- DSCR
- —
- Eligible?
- —
Personal DTI + credit; lowest rate.
DSCR
20% down · 8.5% · 30yr
- Down + closing
- —
- Monthly P&I
- —
- Monthly cashflow
- —
- DSCR
- —
- Eligible?
- —
No personal income docs; deal must DSCR.
Hard money
10% down · 12.0% · 12mo
- Down + closing
- —
- Monthly P&I
- —
- Monthly cashflow
- —
- DSCR
- —
- Eligible?
- —
Short-term bridge; refi at stabilization.
Listing history 16 events
-
2026-06-23days on market $115,000 Active 73 DOM
-
2026-06-21days on market $115,000 Active 72 DOM
-
2026-06-19days on market $115,000 Active 70 DOM
-
2026-06-18days on market $115,000 Active 69 DOM
-
2026-06-17days on market $115,000 Active 68 DOM
-
2026-06-16days on market $115,000 Active 67 DOM
-
2026-06-15days on market $115,000 Active 66 DOM
-
2026-06-14days on market $115,000 Active 64 DOM
-
2026-06-13pricestatusdays on market $115,000 Active 63 DOM
-
2026-06-03status $145,500 Pending 62 DOM
-
2026-06-02days on market $145,500 Active 62 DOM
-
2026-06-01days on market $145,500 Active 61 DOM
-
2026-05-31days on market $145,500 Active 60 DOM
-
2026-05-30days on market $145,500 Active 59 DOM
-
2026-05-14price $145,500 362-char remark
Show marketing remark (362 chars)
Off Grid Living on 40-acres! Looking for space to breathe? This 4bd/3ba home outside Seligman, AZ, sits on 40 fully fenced acres with some of the best panoramic views in the state. Includes a dedicated horse area and is powered by solar, offering true independence in the heart of the rural Southwest. Bring the animals, bring the toys, and enjoy the quiet life!
-
2026-04-01$150,000 Active 362-char remark
Show marketing remark (362 chars)
Off Grid Living on 40-acres! Looking for space to breathe? This 4bd/3ba home outside Seligman, AZ, sits on 40 fully fenced acres with some of the best panoramic views in the state. Includes a dedicated horse area and is powered by solar, offering true independence in the heart of the rural Southwest. Bring the animals, bring the toys, and enjoy the quiet life!
ⓘ Source: listings_history table (triggers on properties + properties_extension) + one-shot
backfill from property_details.listing_events for pre-trigger history.
Nearby sold comps map
Loading sold comps map…
Walkable amenities ~0.75 mi
Loading nearby amenities…
Taxation est. · year 1
- Rental income
- $22,231
- − Mortgage interest
- −$6,442
- − Property taxes
- −$1,725
- − Insurance
- −$575
- − Repairs & maintenance
- −$1,778
- − Management
- −$1,778
- − Depreciation
- −$3,345
- Taxable income
- $6,587
- Est. tax owed @ 24.0%
- −$1,581
- After-tax cash flow
- $6,445/yr
For passive investors: Depreciation is non-cash, so a rental often shows a tax loss while cash-flowing — sheltering income. Rental losses are passive: they offset passive income freely, and up to $25,000/yr can offset ordinary (W-2) income if you actively participate and your MAGI is under $100k (phasing out to $0 by $150k); unused losses carry forward. On sale, claimed depreciation is recaptured at up to 25%, and gains may owe capital-gains tax (a 1031 exchange can defer both). Figures are a year-1 estimate at your 24.0% rate — not tax advice; consult a CPA.
Condition & rehab AI · 13 photos
This property requires extensive repairs and updates to bring it up to modern standards, significantly impacting its resale and rental value.
Repairs flagged
- Major kitchen countertops — severe wear and tear
- Major bathroom tiles — severe wear and tear
- Major roof — visible rust and wear
- Major exterior siding — peeling paint and damage
- Major flooring — damaged carpet and worn wood
- Major interior walls — damaged walls and peeling paint
- Major HVAC/mechanicals — visible rust and wear
Value-add opportunities
- Both update kitchen and bathrooms — modernizing outdated spaces
- Both repair roof and exterior — improving curb appeal and functionality
- Both replace flooring — enhancing comfort and aesthetics
- Both paint interior walls — refreshing and improving living spaces
Renovation cost estimate screening
| Repair item | Severity | Est. cost |
|---|---|---|
| kitchen countertops · severe wear and tear | Major | $15,000–50,000 |
| bathroom tiles · severe wear and tear | Major | $15,000–50,000 |
| roof · visible rust and wear | Major | $15,000–50,000 |
| exterior siding · peeling paint and damage | Major | $15,000–50,000 |
| flooring · damaged carpet and worn wood | Major | $15,000–50,000 |
| interior walls · damaged walls and peeling paint | Major | $15,000–50,000 |
| HVAC/mechanicals · visible rust and wear | Major | $15,000–50,000 |
| Total estimated repair cost · 7 items | $105,000–350,000 |
Value-add ROI direction
- Both update kitchen and bathrooms — modernizing outdated spaces ↑
- Both repair roof and exterior — improving curb appeal and functionality ↑
- Both replace flooring — enhancing comfort and aesthetics ↑
- Both paint interior walls — refreshing and improving living spaces ↑
ⓘ Cost ranges are severity-bucket heuristics (US national rule-of-thumb). Get contractor quotes + a written scope before underwriting a rehab budget.
Schools (NCES district)
- District
- Seligman Unified District (4472)
- NCES district ID
- 0407630
- Math proficiency
- 20% ▬ 0.00%
- Reading proficiency
- 30% ▬ 0.00%
- Median HH income
- $35,531
- Composite
- 23.7/100
- National rank
- #13238
- State rank
- #339 of 501 in AZ
Livability — Peach Springs
- Score
- 67/100
- State rank
- #64
- US rank
- #10794
Category grades
Schools grade is shown separately in the Schools card above.
Census & demographics
- Population (ZIP)
- 1,827
Population outlook (Yavapai County) Hauer SSP2
- Today (2025)
- 241,389 people
- By 2030
- 249,523 · +3.4%
- By 2040
- 259,966 · +7.7%
- By 2050
- 264,736 · +9.7%
- By 2075
- 269,334 · +11.6%
- By 2100
- 256,505 · +6.3%
Race, ethnicity, and origin ACS 2023
- Neighborhood character
- Predominantly White (70%)
- Race & ethnicity
- White 70% Hispanic / Latino 19% Two or more races 9% Native American 4% Asian 1%
- Hispanic origin (detail)
- Mexican 18%
- Common ancestry
- Slovak 7% Lithuanian 4% Serbian 3%
- Foreign-born
- 1% · Canada
- Languages at home
- 94% English-only · Spanish 5% Other Asian/Pacific 1%
Political lean MEDSL · Yavapai
- 2024 margin
- Solid R (+33.9) · D 32.6% · R 66.5%
- 2008→2024 swing
- -9.5pp toward R · 2008: -24.4pp · 2024: -33.9pp
- All cycles
- 2024: R+33.9 2020: R+29.3 2016: R+31.4 2012: R+30.7 2008: R+24.4
Not yet ingested
- Civics
- —
Market trends
- HPI YoY
- ▼ -2.00%
- Current HPI
- 196.1506
- Rent YoY
- —
- Metro
- —
- State GDP YoY
- ▲ 4.54%
- F500 in state
- 20
Industry mix (Fortune 500 HQ in AZ)
| Industry | F500 HQs | Revenue |
|---|---|---|
| Technology | 2 | $13B |
|
||
| Mining / Metals | 1 | $23B |
|
||
| Environmental Services | 1 | $16B |
|
||
| Metals / Steel | 1 | $14B |
|
||
| Technology Distribution | 1 | $9B |
|
||
| Homebuilding | 1 | $8B |
|
||
Price history
-3.0% since first listed2 events — show timeline
- 2026-05-14 Price Changed $145,500 PAARMLS as Distributed by MLS Grid
- 2026-04-01 Listed $150,000 PAARMLS as Distributed by MLS Grid
Cash-flow waterfall
monthlySold comps — $/sqft
last 12 mo · ≤1 miLoading sold comps…