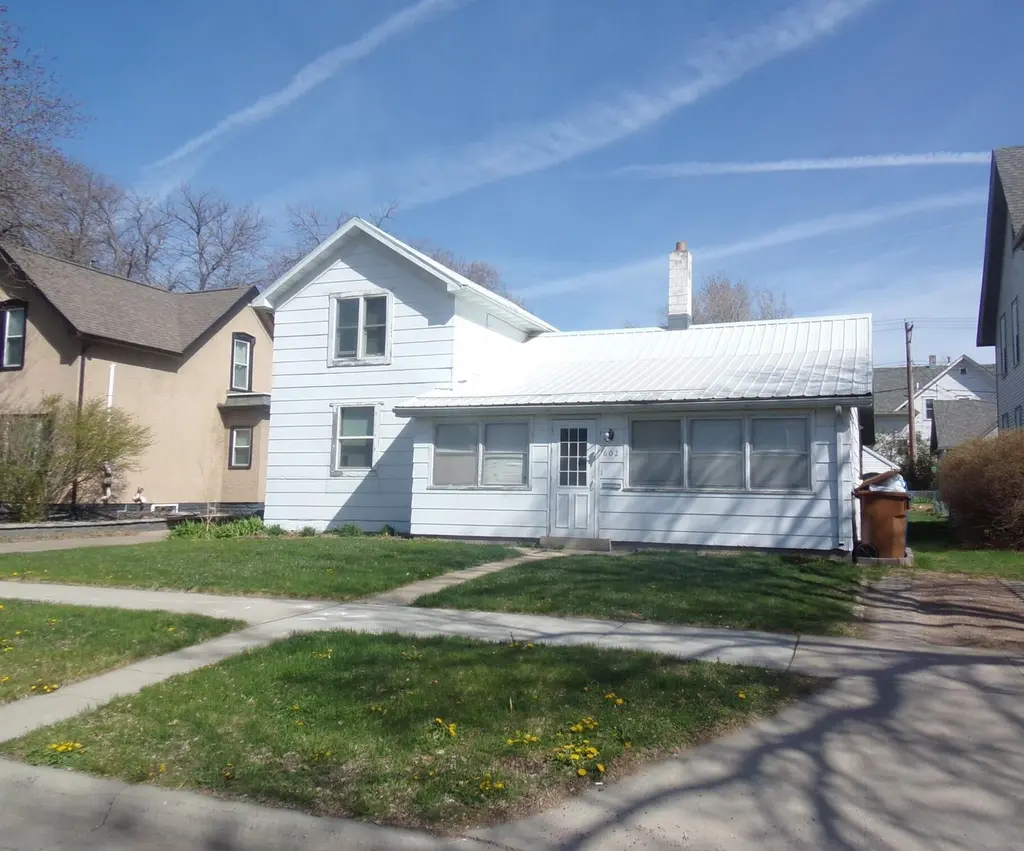
602 W 3rd Ave · Mitchell, SD
Flood risk 1/10 · Minimal
- FEMA flood zone
- X (unshaded)
- Chance of flooding over 30 yrs
- 0.0%
- Est. flood insurance / yr
- $507 – $1,088
Fire risk 5/10 · Moderate
- Est. fire insurance / yr
- $1,342 – $2,492
Heat risk 3/10 · Minor
- Hot days now (above 101°F)
- 7 days/yr
- Hot days in 30 yrs
- 14 days/yr
Wind risk 2/10 · Minimal
- Chance of severe wind over 30 yrs
- —
Air-quality risk 2/10 · Minimal
- Unhealthy air days now
- 1 days/yr
- Unhealthy air days in 30 yrs
- 1 days/yr
Risk factors via First Street. Map © Google.
Why this score? — see what drove the B- grade
The composite is a weighted blend of 9 inputs, each scored 0–100. Each bar is that input's sub-score; the figure is the points it added to the 100-point composite (weight × sub-score).
- Cash flow +24.2/30.0
- ARV discount +15.0/15.0
- DSCR +7.8/10.0
- 1% rule +6.2/10.0
- Schools +4.9/10.0
- Livability +3.9/5.0
- Rent growth +2.5/5.0
- Condition / age +2.5/5.0
- Appreciation +0.0/10.0
$109,000
🖨 Deal sheet 📄 Offer letter ✓ Due diligence
Listing remarks MLS
As neat and clean as you will find! Ready to move in. Main floor laundry.
Key facts
- Spacious kitchen
- Large back yard
- Main floor utility
Tags
Property features AI
Exterior
- Parking: Attached or detached garage (1-car garage)
- Utilities: Public water; Public sewer
- Home design: Single-family residence; One-story
- Construction: Frame construction; Metal roof; Below-grade finished area
- Exterior features: Deck
Interior
- Flooring: Laminate
- Bathrooms: 1 full bathroom
- Heating & cooling: Natural gas heating; Central air conditioning
- Interior features: Laminate flooring; Partial finished basement
Neighborhood map
What this means for you Summary
Snapshot
- This is a 3-bed/1.0-bath single-family listed at $109k.
Deal economics
- At list price, monthly cash flow is $217 ($3k/yr) — positive.
- The deal already cash-flows at list — no discount required.
- Meets the 1% rule at list price ($1k rent vs $109k).
- Recommended offer: $106k (3.0% below list) — sets the bar for market timing.
- Cap rate 8.7% vs local median 2.5% in Mitchell — top-decile yield for the area; either an underpriced asset or a hidden risk that comps aren't pricing in. Stress-test before assuming the spread holds.
Location & tenants
- Location reads 77/100 on livability (#18 in SD, #2,969 nationally) — a middle-class / working-renter tenant base. Strengths: cost of living A+, housing A+, health & safety A+; Watch: schools C-, employment C-, amenities D+.
- Mitchell School District 17-2 (town): math 55% / reading 62% proficiency, ranked #11 of 59 in SD (top 19%) — acceptable for families but not a draw, mixed tenant base, ~2y average lease.
- Market conditions: 135 active listings in the ZIP; 19 comparable units currently listed for rent nearby; rentals lingering (median 44d on market — plan ~5-8 weeks vacancy on turnover, expect pricing pressure); 100% of comp listings sitting > 30 days — soft ceiling on asking rent; 48 units permitted in Davison County in 2024 (0 in 5+ unit buildings).
Forward outlook
- Local home prices are declining (-3.0%/yr); year-one equity from $754 of loan paydown is wiped out by about $3k of value loss. Plan a longer hold.
- Davison County population projected at +7% by 2050 — modest demand growth; plan on rents tracking national, not racing it.
Negotiation context
- It's been on market 57 days — a 3% lower offer ($106k) is reasonable based on typical stale-listing flexibility.
- Current owner paid $53k; list at $109k implies a 106% gain — meaningful room to come down on a strong offer.
Risks & watch-outs
- Watch-outs: built in 1900 — expect roof / HVAC / electrical / plumbing capex.
- Climate carrying-cost: moderate wildfire risk — expect insurance premiums to compound above CPI over the hold.
Questions for the listing agent
- It's been on market 57 days. Have you received any prior offers? Is the seller open to a 3% concession, seller financing, or rate buy-down credit?
- Built in 1900 — when were the roof, HVAC, electrical panel, plumbing, and water heater last replaced?
- Is there a deadline driving the sale (1031 exchange, divorce, estate, relocation)? That informs how much negotiation room exists.
- What's the average days-on-market for RENTAL listings here right now (not sales)? A rising rental-DOM trend means longer vacancies and softer asking-rent achievability than the comps imply.
- What's the recent tenant-quality profile in this submarket — average credit score on applications, eviction rate, late-payment / NSF rate, and stable-employment percentage? A property-management company in the area should have these aggregated.
- How much new for-sale + rental construction is in the pipeline within 1–3 miles? Heavy new supply typically softens prices + rents 12–24 months out; constrained supply supports both.
Investment metrics
- 1% rule
- 1.12% ✓
- Cap rate
- 8.68%
- Cash-on-cash
- 8.52%
- DSCR
- 1.38
- GRM
- 7.4
CMA / ARV
- ARV (median comp)
- $155,294
- List price
- $109,000
- Delta
- -29.81%
- Verdict
- UNDERPRICED
- Comps
- 20 within 1.0 mi
Show comp detail 12 sales within ~0.75 mi
| Address | Dist | Beds/Ba | Sqft | Sold | Price | $/sf | Match |
|---|---|---|---|---|---|---|---|
| 705 W 5th Ave | 0.13mi | 3/2.0 | 1,330 (+3%) | 10mo | $145,000 | $109 | 77 |
| 921 W 5th Ave | 0.29mi | 3/1.0 | 1,331 (+3%) | 10mo | $175,000 | $131 | 74 |
| 504 S Edmunds St | 0.45mi | 3/2.0 | 1,200 (-7%) | 1mo | $184,500 | $154 | 62 |
| 1020 W 5th Ave | 0.36mi | 2/1.0 (-1) | 1,170 (-10%) | 2mo | $75,000 | $64 | 61 |
| 521 S Duff St | 0.52mi | 3/1.0 | 1,187 (-8%) | 2mo | $155,000 | $131 | 61 |
| 516 S Montana St | 0.48mi | 2/1.0 (-1) | 1,235 (-5%) | 7mo | $150,000 | $121 | 59 |
| 1016 W 3rd Ave | 0.33mi | 3/1.0 | 1,101 (-15%) | 1mo | $90,000 | $82 | 59 |
| 1105 W 3rd Ave | 0.37mi | 3/1.0 | 1,106 (-14%) | 1mo | $200,000 | $181 | 58 |
| 316 E 3rd Ave | 0.56mi | 3/1.0 | 1,203 (-7%) | 7mo | $157,000 | $131 | 56 |
| 1012 W 3rd Ave | 0.32mi | 2/1.0 (-1) | 1,100 (-15%) | 1mo | $150,000 | $136 | 54 |
| 315 E 9th Ave | 0.68mi | 2/2.0 (-1) | 1,199 (-7%) | 0mo | $115,000 | $96 | 47 |
| 1326 W 4th Ave | 0.59mi | 3/2.0 | 1,442 (+11%) | 10mo | $223,000 | $155 | 41 |
Match score weights: distance 35% · size 25% · config 20% · recency 20%. Top-matched comps best support the ARV.
Projected returns pro-forma
-3.0% appreciation · 3.0% rent growth · sell at horizon
- IRR
- -3.4%
- Equity multiple
- 0.87×
- Total profit
- $-3,845
- Equity at exit
- $16,252
- IRR
- 6.4%
- Equity multiple
- 1.47×
- Total profit
- $14,487
- Equity at exit
- $9,424
Cash invested: $30,520 (down + closing). Projections, not guarantees.
Landlord ↔ Tenant lean methodology
- Overall (STATE)
- 83 Strongly Landlord-Friendly
- State South Dakota
- 83 Strongly Landlord-Friendly · R+16
- County
- — inherits STATE
- City
- — inherits STATE
ZIP-level market 57301
- Active inventory
- 135
- Price-to-rent
- 7.4×
Monthly cashflow live
- Estimated rent
- $1,222 high interval (Pro) →
- Mortgage (P&I)
- −$572
- Tax from tax record
- −$131 /mo · $1,576/yr
- Insurance
- −$45
- HOA
- −$0
- Vacancy / Maint / Mgmt
- −$257
- Net cashflow
- $217
Break-even live
UW: 25.0% down · 7.5% · 30yr · 1.5% tax · 5.0% vac · 8.0% maint · 8.0% mgmt
Financing live
Cash to close
- Down payment
- $27,250
- Closing costs
- $3,270
- Reserves months
- —
- Total cash needed
- —
Loan-product check · same deal, 3 products live
Conventional
25% down · 7.5% · 30yr
- Down + closing
- —
- Monthly P&I
- —
- Monthly cashflow
- —
- DSCR
- —
- Eligible?
- —
Personal DTI + credit; lowest rate.
DSCR
20% down · 8.5% · 30yr
- Down + closing
- —
- Monthly P&I
- —
- Monthly cashflow
- —
- DSCR
- —
- Eligible?
- —
No personal income docs; deal must DSCR.
Hard money
10% down · 12.0% · 12mo
- Down + closing
- —
- Monthly P&I
- —
- Monthly cashflow
- —
- DSCR
- —
- Eligible?
- —
Short-term bridge; refi at stabilization.
Rent comps 19 comps
| Address | Beds | Baths | Sqft | Rent | $/sqft | DOM | Units | Dist |
|---|---|---|---|---|---|---|---|---|
| 316 W 2nd Ave Mitchell, SD | 4.0 | 2.0 | 1726 | $1,450 | $0.84 | 43d | 1 | 0.21mi |
| 200 W 4th Ave Unit 3 Mitchell, SD | 2.0 | 1.0 | 1085 | $725 | $0.67 | 43d | 1 | 0.30mi |
| 310 S Edmunds St Mitchell, SD | 4.0 | 1.0 | 1399 | $1,450 | $1.04 | 43d | 1 | 0.34mi |
| 605 W 10th Ave Mitchell, SD | 4.0 | 1.0 | 1200 | $1,450 | $1.21 | 43d | 1 | 0.45mi |
| 408 S Duff St Unit B Mitchell, SD | 2.0 | 1.0 | 1200 | $800 | $0.67 | 43d | 1 | 0.47mi |
| 122 W 9th Ave Unit 122 1/2 Mitchell, SD | 3.0 | 1.0 | 965 | $1,000 | $1.04 | 43d | 1 | 0.51mi |
| 401 W 11th Ave Mitchell, SD | 3.0 | 1.0 | 1196 | $1,400 | $1.17 | 43d | 1 | 0.54mi |
| 420 E 6th Ave Unit 2 (back) Mitchell, SD | 3.0 | 1.0 | 1542 | $1,200 | $0.78 | 43d | 1 | 0.66mi |
| 509 E 1st Ave Mitchell, SD | 3.0 | 1.0 | 1425 | $1,350 | $0.95 | 43d | 1 | 0.71mi |
| 623 E Hanson Ave Mitchell, SD | 3.0 | 1.0 | 1023 | $1,200 | $1.17 | 43d | 1 | 0.83mi |
| 1523 W Elm St Unit 1415 Mitchell, SD | 2.0 | 1.0 | 1000 | $1,250 | $1.25 | 43d | 1 | 0.85mi |
| 400 E 12th Ave Unit 1 Mitchell, SD | 2.0 | 1.0 | 900 | $1,000 | $1.11 | 43d | 1 | 0.85mi |
| 821 E 7th Ave Unit 2 (up) Mitchell, SD | 2.0 | 1.0 | 925 | $750 | $0.81 | 43d | 1 | 0.95mi |
| 910 N Winsor St Mitchell, SD | 3.0 | 1.0 | 996 | $1,300 | $1.31 | 43d | 1 | 0.98mi |
| 111 E Juniper Ave Unit 9 Mitchell, SD | 3.0 | 2.5 | 1737 | $1,950 | $1.12 | 43d | 1 | 1.02mi |
| 933 E 5th Ave Mitchell, SD | 3.0 | 1.0 | 1138 | $1,450 | $1.27 | 43d | 1 | 1.02mi |
| 1820 N Wisconsin St Unit F7 Mitchell, SD | 2.0 | 1.0 | 1000 | $1,300 | $1.30 | 43d | 1 | 1.03mi |
| 1820 N Wisconsin St Unit B2 Mitchell, SD | 2.0 | 1.0 | 1000 | $915 | $0.92 | 43d | 1 | 1.03mi |
| 2050 Quail St Mitchell, SD | 2.0 | 2.0 | 1335 | $1,900 | $1.42 | 43d | 1 | 1.08mi |
Listing history 21 events
-
2026-06-19days on market $109,000 Active 57 DOM
-
2026-06-18days on market $109,000 Active 56 DOM
-
2026-06-17days on market $109,000 Active 55 DOM
-
2026-06-16days on market $109,000 Active 54 DOM
-
2026-06-15days on market $109,000 Active 53 DOM
-
2026-06-14days on market $109,000 Active 51 DOM
-
2026-06-12days on market $109,000 Active 50 DOM
-
2026-06-09pricedays on market $109,000 Active 47 DOM
-
2026-06-08days on market $119,000 Active 46 DOM
-
2026-06-07days on market $119,000 Active 45 DOM
-
2026-06-05days on market $119,000 Active 43 DOM
-
2026-06-04days on market $119,000 Active 41 DOM
-
2026-06-02days on market $119,000 Active 40 DOM
-
2026-06-01days on market $119,000 Active 39 DOM
-
2026-05-31days on market $119,000 Active 38 DOM
-
2026-05-31days on market $119,000 Active 37 DOM
-
2026-05-12price $119,000 412-char remark
-
2026-04-23$134,000 Active 412-char remark
-
2012-09-07soldstatus $53,000
-
2001-09-26soldstatus $36,000
-
2001-09-25soldstatus $36,000 73-char remark
Show marketing remark (73 chars)
As neat and clean as you will find! Ready to move in. Main floor laundry.
ⓘ Source: listings_history table (triggers on properties + properties_extension) + one-shot
backfill from property_details.listing_events for pre-trigger history.
Tax reassessment forecast SD · Resets to sale price
- Current annual tax
- $1,576 · $131/mo
- Projected year-2 tax
- $1,576 · $131/mo
- Expected delta
- $0/yr ($0/mo · 0.0%)
ⓘ Screening estimate from a state-policy table — verify with the county assessor before closing.
Climate risk First Street
- Flood 1/10 Low FEMA zone X (unshaded) · 0% chance over 30 yrs
- Wildfire 5/10 Major
- Heat 3/10 Moderate 7 d/yr ≥101°F today · 14 d/yr by 30 yrs out
- Wind 2/10 Low
- Air quality 2/10 Low 1 unhealthy d/yr today · 1 by 30 yrs out
Nearby sold comps map
Loading sold comps map…
Walkable amenities ~0.75 mi
Loading nearby amenities…
Taxation est. · year 1
- Rental income
- $14,659
- − Mortgage interest
- −$6,106
- − Property taxes
- −$1,576
- − Insurance
- −$545
- − Repairs & maintenance
- −$1,173
- − Management
- −$1,173
- − Depreciation
- −$3,171
- Taxable income
- $916
- Est. tax owed @ 24.0%
- −$220
- After-tax cash flow
- $2,381/yr
For passive investors: Depreciation is non-cash, so a rental often shows a tax loss while cash-flowing — sheltering income. Rental losses are passive: they offset passive income freely, and up to $25,000/yr can offset ordinary (W-2) income if you actively participate and your MAGI is under $100k (phasing out to $0 by $150k); unused losses carry forward. On sale, claimed depreciation is recaptured at up to 25%, and gains may owe capital-gains tax (a 1031 exchange can defer both). Figures are a year-1 estimate at your 24.0% rate — not tax advice; consult a CPA.
Schools (NCES district)
- District
- Mitchell School District 17-2
- NCES district ID
- 4648390
- Math proficiency
- 55% ▬ 0.00%
- Reading proficiency
- 62% ▲ 5.00%
- Median HH income
- $45,912
- Composite
- 49.42/100
- National rank
- #2008
- State rank
- #11 of 59 in SD
Livability — Mitchell
- Score
- 77/100
- State rank
- #18
- US rank
- #2969
Category grades
Schools grade is shown separately in the Schools card above.
Census & demographics
- Census place
- Mitchell, SD
- County
- Davison County · 19,104 people
- City population
- 19,104
- Metro
- Mitchell, SD
- Population (ZIP)
- 19,104
- Household income
- $65,620
- Rent vs Own
- Severe rent burden
- 537.0
Population outlook (Davison County) Hauer SSP2
- Today (2025)
- 20,529 people
- By 2030
- 20,856 · +1.6%
- By 2040
- 21,415 · +4.3%
- By 2050
- 21,925 · +6.8%
- By 2075
- 24,245 · +18.1%
- By 2100
- 29,222 · +42.3%
Race, ethnicity, and origin ACS 2023
- Neighborhood character
- Predominantly White (89%)
- Race & ethnicity
- White 89% Hispanic / Latino 5% Native American 4% Two or more races 3%
- Common ancestry
- Portuguese 10% Iranian 7% Lithuanian 3%
- Foreign-born
- 2% · Canada
- Languages at home
- 96% English-only · Spanish 2%
Political lean MEDSL · Davison
- 2024 margin
- Solid R (+37.8) · D 29.9% · R 67.7% · Other 2.5%
- 2008→2024 swing
- -23.8pp toward R · 2008: -13.9pp · 2024: -37.8pp
- All cycles
- 2024: R+37.8 2020: R+35.1 2016: R+35.2 2012: R+21.5 2008: R+13.9
Not yet ingested
- Civics
- —
Market trends
- HPI YoY
- ▼ -136.01%
- Current HPI
- 179.7909
- Rent YoY
- —
- Metro
- Mitchell, SD
- State GDP YoY
- ▲ 0.70%
- F500 in state
- 2
Industry mix (Fortune 500 HQ in SD)
| Industry | F500 HQs | Revenue |
|---|---|---|
| Utilities | 1 | $1B |
|
||
Price history
+202.8% since first listed6 events — show timeline
- 2026-06-09 Price Changed $109,000 MBOR
- 2026-05-12 Price Changed $119,000 MBOR
- 2026-04-23 Listed $134,000 MBOR
- 2012-09-07 Sold (Public Records) $53,000 Public Records
- 2001-09-26 Sold (Public Records) $36,000 Public Records
- 2001-09-25 Sold (MLS) $36,000 MBOR
Property tax history
+2.6%/yrLatest (2025): $1,576 · +3.0% YoY. Source: county tax records.
Cash-flow waterfall
monthlySold comps — $/sqft
last 12 mo · ≤1 miLoading sold comps…