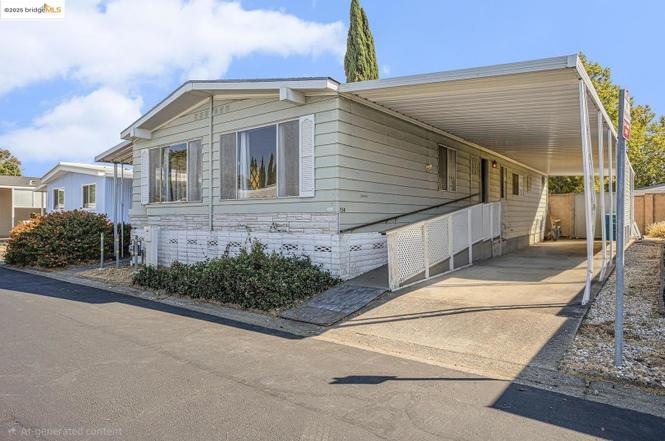
1597 Alamo Dr #150 · Vacaville, CA
Flood risk 1/10 · Minimal
- FEMA flood zone
- X (unshaded)
- Chance of flooding over 30 yrs
- 0.0%
- Est. flood insurance / yr
- $507 – $1,088
Fire risk 7/10 · Major
- Est. fire insurance / yr
- $659 – $1,223
Heat risk 6/10 · Moderate
- Hot days now (above 101°F)
- 7 days/yr
- Hot days in 30 yrs
- 14 days/yr
Wind risk 1/10 · Minimal
- Chance of severe wind over 30 yrs
- —
Air-quality risk 10/10 · Severe
- Unhealthy air days now
- 21 days/yr
- Unhealthy air days in 30 yrs
- 22 days/yr
Risk factors via First Street. Map © Google.
Why this score? — see what drove the B+ grade
The composite is a weighted blend of 9 inputs, each scored 0–100. Each bar is that input's sub-score; the figure is the points it added to the 100-point composite (weight × sub-score).
- Cash flow +30.0/30.0
- ARV discount +15.0/15.0
- 1% rule +10.0/10.0
- DSCR +10.0/10.0
- Schools +4.2/10.0
- Livability +3.9/5.0
- Condition / age +2.5/5.0
- Rent growth +2.4/5.0
- Appreciation +0.0/10.0
$135,000
🖨 Deal sheet (PDF) 📄 Offer letter ✓ Due diligence
Listing remarks
REDUCED TO SELL! NEW ROOF!! FRESH INTERIOR PAINT!! NEW CARPET PRIOR TO CLOSE!! Cute spacious 2-bedroom 2 bath mobile home in Skylark Senior Mobile Home Park. Spacious floor plan, light and bright! Large soaker tub and separate shower in master. Large kitchen with breakfast bar and eating area. Separate Living and Dining Rooms. Laminate and carpet flooring. Covered Carport and Covered front porch. A must see!!
Key facts
- Eating area
- Large kitchen
- Large soaker tub
Tags
Property features AI
Finance
- HOA & community: Pets allowed; Clubhouse; Community pool; Senior community
Exterior
- Parking: Carport (covered)
- Utilities: Public water; Public sewer
- Home design: Manufactured in park (mobile home); Double wide
- Construction: Siding (other)
- Exterior features: Front porch; Rear porch; Shed(s); Close to clubhouse; In-ground pool
Interior
- Kitchen: Breakfast bar; Dishwasher; Gas range / cooktop; Built-in oven; Refrigerator; Dining area adjacent to kitchen
- Bedrooms: 2 bedrooms; Primary bedroom suite
- Flooring: Laminate; Carpet
- Bathrooms: 2 full bathrooms; Primary bathroom with tub, stall shower, and window; Other bathroom includes stall shower
- Heating & cooling: Forced air heating; Central air conditioning
- Interior features: Breakfast bar; Dining area; Family room; Main entry; Laundry facility
- Laundry & utility: Laundry room with hookups
Neighborhood map
What this means for you Summary
Snapshot
- This is a 2-bed/2.0-bath manufactured listed at $135k.
Deal economics
- At list price, monthly cash flow is $1k ($14k/yr) — positive.
- The deal already cash-flows at list — no discount required.
- Meets the 1% rule at list price ($3k rent vs $135k).
- Recommended offer: $119k (12.0% below list) — sets the bar for market timing.
- Cap rate 16.3% vs local median 3.0% in Vacaville — top-decile yield for the area; either an underpriced asset or a hidden risk that comps aren't pricing in. Stress-test before assuming the spread holds.
Location & tenants
- Location reads 77/100 on livability (#88 in CA, #3,156 nationally) — a middle-class / working-renter tenant base. Strengths: amenities A+, employment A+, housing A+; Watch: cost of living F.
- Vacaville Unified (suburban): math 37% / reading 52% proficiency, ranked #522 of 1,400 in CA (top 37%) — families likely to look elsewhere, expect single-tenant / working-renter base with shorter leases.
- Zoned schools: Eugene Padan Elementary (720 students, 59% FRL); Vaca Pena Middle (689 students, 53% FRL); Will C. Wood High (1,670 students, 42% FRL) — zoned schools average 51% FRL vs 34% district-wide (17 pts higher); higher-poverty schools than district average — tighter screening recommended.
- Market conditions: Rents soft (-0.6%/yr); 265 active listings in the ZIP; 20 comparable units currently listed for rent nearby; rentals at typical pace (median 26d on market — plan ~3-4 weeks tenant-placement turnaround); solid renter incomes; 1,472 units permitted in Solano County in 2024 (131 in 5+ unit buildings).
Forward outlook
- Local home prices are declining (-3.0%/yr); year-one equity from $933 of loan paydown is wiped out by about $4k of value loss. Plan a longer hold.
- Solano County population projected at +15% by 2050 — modest demand growth; plan on rents tracking national, not racing it.
- At projected returns (-3.0% appreciation + 0.0% rent growth), your $38k cash investment doubles in ~4 years — after that, you're playing with house money.
Negotiation context
- It's been on market 279 days — a 12% lower offer ($119k) is reasonable based on typical stale-listing flexibility.
Risks & watch-outs
- Climate carrying-cost: major wildfire risk; extreme-heat days projected 7→14/yr by 2055 (HVAC capex compounding) — expect insurance premiums to compound above CPI over the hold.
Questions for the listing agent
- It's been on market 279 days. Have you received any prior offers? Is the seller open to a 12% concession, seller financing, or rate buy-down credit?
- Built in 1977 — when were the roof, HVAC, electrical panel, plumbing, and water heater last replaced?
- Why hasn't it sold? Are there any deal-killer items the seller is aware of (foundation, flood, title, zoning, code violations)?
- Is there a deadline driving the sale (1031 exchange, divorce, estate, relocation)? That informs how much negotiation room exists.
- What's the average days-on-market for RENTAL listings here right now (not sales)? A rising rental-DOM trend means longer vacancies and softer asking-rent achievability than the comps imply.
- What's the recent tenant-quality profile in this submarket — average credit score on applications, eviction rate, late-payment / NSF rate, and stable-employment percentage? A property-management company in the area should have these aggregated.
- How much new for-sale + rental construction is in the pipeline within 1–3 miles? Heavy new supply typically softens prices + rents 12–24 months out; constrained supply supports both.
Investment metrics
- 1% rule
- 1.93% ✓
- Cap rate
- 16.33%
- Cash-on-cash
- 35.86%
- DSCR
- 2.60
- GRM
- 4.3
CMA / ARV
- ARV (on-the-fly)
- $207,360
- Comps found
- 12
Show comp detail 12 sales within ~0.75 mi
| Address | Dist | Beds/Ba | Sqft | Sold | Price | $/sf | Match |
|---|---|---|---|---|---|---|---|
| 1597 Alamo Dr #154 | 0.03mi | 2/— | 1,440 (0%) | 11mo | $125,000 | $87 | 89 |
| 1597 Alamo Dr #141 Dr | 0.02mi | 2/2.0 | 1,344 (-7%) | 5mo | $175,000 | $130 | 84 |
| 1597 Alamo Dr #141 | 0.03mi | 2/2.0 | 1,344 (-7%) | 9mo | $73,000 | $54 | 80 |
| 1597 Alamo Dr #182 | 0.14mi | 3/2.0 (+1) | 1,440 (0%) | 11mo | $100,000 | $69 | 79 |
| 1597 Alamo Dr #175 | 0.03mi | 3/2.0 (+1) | 1,552 (+8%) | 4mo | $165,500 | $107 | 77 |
| 1597 Alamo Dr #194 | 0.14mi | 3/2.0 (+1) | 1,500 (+4%) | 12mo | $166,000 | $111 | 71 |
| 150 Calle Tepic | 0.38mi | 3/2.0 (+1) | 1,456 (+1%) | 6mo | $222,000 | $152 | 71 |
| 56 Calle Chapala | 0.47mi | 3/2.0 (+1) | 1,344 (-7%) | 4mo | $207,500 | $154 | 59 |
| 71 Avenida Hidalgo | 0.45mi | 3/2.0 (+1) | 1,344 (-7%) | 11mo | $194,000 | $144 | 53 |
| 91 Calle Jalisco | 0.43mi | 3/2.0 (+1) | 1,248 (-13%) | 2mo | $229,000 | $183 | 52 |
| 118 Calle Chapultepec | 0.42mi | 3/2.0 (+1) | 1,248 (-13%) | 3mo | $186,000 | $149 | 50 |
| 121 Calle Chapultepec | 0.40mi | 3/2.0 (+1) | 1,248 (-13%) | 10mo | $234,000 | $188 | 46 |
Match score weights: distance 35% · size 25% · config 20% · recency 20%. Top-matched comps best support the ARV.
Projected returns pro-forma
-3.0% appreciation · 0.0% rent growth · sell at horizon
- IRR
- 28.1%
- Equity multiple
- 2.12×
- Total profit
- $42,465
- Equity at exit
- $20,129
- IRR
- 33.8%
- Equity multiple
- 3.65×
- Total profit
- $100,217
- Equity at exit
- $11,672
Cash invested: $37,800 (down + closing). Projections, not guarantees.
Landlord ↔ Tenant lean methodology
- Overall (STATE)
- 18 Strongly Tenant-Friendly
- State California
- 18 Strongly Tenant-Friendly · D+13
- County
- — inherits STATE
- City
- — inherits STATE
ZIP-level market 95687
- Rents YoY
- -0.6%
- Active inventory
- 265
- Price-to-rent
- 4.3×
Monthly cashflow live
- Estimated rent
- $2,611 high interval (Pro) →
- Mortgage (P&I)
- −$708
- Tax est. 1.5%
- −$169 /mo · $2,025/yr
- Insurance
- −$56
- HOA
- −$0
- Vacancy / Maint / Mgmt
- −$548
- Net cashflow
- $1,130
Break-even live
Sensitivity live
| Price | -10% $1,223 | -5% $1,176 | +0% $1,130 | +5% $1,083 | +10% $1,036 |
|---|---|---|---|---|---|
| Rent | -10% $923 | -5% $1,027 | +0% $1,130 | +5% $1,233 | +10% $1,336 |
| Rate | -1.0pp $1,198 | -0.5pp $1,164 | base $1,130 | +0.5pp $1,095 | +1.0pp $1,059 |
UW: 25.0% down · 7.5% · 30yr · 1.5% tax · 5.0% vac · 8.0% maint · 8.0% mgmt
Financing live
Cash to close
- Down payment
- $33,750
- Closing costs
- $4,050
- Reserves months
- —
- Total cash needed
- —
Loan-product check · same deal, 3 products live
Conventional
25% down · 7.5% · 30yr
- Down + closing
- —
- Monthly P&I
- —
- Monthly cashflow
- —
- DSCR
- —
- Eligible?
- —
Personal DTI + credit; lowest rate.
DSCR
20% down · 8.5% · 30yr
- Down + closing
- —
- Monthly P&I
- —
- Monthly cashflow
- —
- DSCR
- —
- Eligible?
- —
No personal income docs; deal must DSCR.
Hard money
10% down · 12.0% · 12mo
- Down + closing
- —
- Monthly P&I
- —
- Monthly cashflow
- —
- DSCR
- —
- Eligible?
- —
Short-term bridge; refi at stabilization.
Rent comps 20 comps
| Address | Beds | Baths | Sqft | Rent | $/sqft | DOM | Units | Dist |
|---|---|---|---|---|---|---|---|---|
| 1510 Alamo Dr Vacaville, CA | 2.0 | 1.5 | 1047 | $2,425 | $2.32 | 16d | 2 | 0.19mi |
| 1797 Brookwood Dr Vacaville, CA | 3.0 | 2.0 | 1258 | $2,800 | $2.23 | 16d | 1 | 0.23mi |
| 2001 Eastwood Dr Vacaville, CA | 2.0 | 1.0 | 896 | $1,950 | $2.18 | 25d | 2 | 0.54mi |
| 343 Moon River Pl Vacaville, CA | 1.0–3.0 | 1.0–2.5 | 893 | $2,720 | $3.05 | 16d | 22 | 0.60mi |
| 999 Marshall Rd Vacaville, CA | 1.0–2.0 | 1.0–2.0 | 847 | $2,482 | $2.93 | 16d | 8 | 0.64mi |
| 945 Davis St Vacaville, CA | 3.0 | 2.0 | 1248 | $2,800 | $2.24 | 16d | 1 | 0.67mi |
| 600 Rialto Dr Vacaville, CA | 3.0 | 2.0 | 1600 | $2,750 | $1.72 | 46d | 1 | 0.89mi |
| 361 Gabiano Ct Vacaville, CA | 3.0 | 2.5 | 1229 | $3,000 | $2.44 | 46d | 1 | 0.93mi |
| 148 Peabody Rd Vacaville, CA | 1.0–3.0 | 1.0–3.0 | 1046 | $2,978 | $2.85 | 0d | 16 | 1.03mi |
| 212 Stonyford Dr Vacaville, CA | 3.0 | 2.0 | 1296 | $3,000 | $2.31 | 46d | 1 | 1.04mi |
| 520 McKnight Ln Vacaville, CA | 3.0 | 2.0 | 1129 | $2,895 | $2.56 | 46d | 1 | 1.14mi |
| 398 Aaron Cir Vacaville, CA | 3.0 | 3.0 | 1700 | $3,295 | $1.94 | 25d | 1 | 1.17mi |
| 642 Silvertop Way Vacaville, CA | 3.0 | 2.0 | 1692 | $2,995 | $1.77 | 25d | 1 | 1.22mi |
| 116 Elm St Vacaville, CA | 2.0 | 1.0 | 948 | $2,100 | $2.22 | 46d | 1 | 1.23mi |
| 1101 Farmington Dr Vacaville, CA | 2.0 | 1.0 | 900 | $2,213 | $2.46 | 16d | 1 | 1.33mi |
| 800 El Camino Ave Vacaville, CA | 2.0–3.0 | 1.0–2.0 | 899 | $1,795 | $2.00 | 14d | 2 | 1.35mi |
| 432 Zachary Dr Vacaville, CA | 3.0 | 2.0 | 1100 | $2,850 | $2.59 | 46d | 1 | 1.38mi |
| 1701 Marshall Rd Vacaville, CA | 1.0–2.0 | 1.0–2.0 | 836 | $2,496 | $2.99 | 16d | 10 | 1.39mi |
| 1000 Allison Dr Vacaville, CA | 1.0–2.0 | 1.0–2.0 | 990 | $3,100 | $3.13 | 16d | 15 | 1.43mi |
| 111 Woodbury Cir Unit 113 Vacaville, CA | 2.0 | 1.0 | 1000 | $2,400 | $2.40 | 46d | 1 | 1.45mi |
Listing history 21 events
-
2026-06-21days on market $135,000 Active 279 DOM
-
2026-06-18days on market $135,000 Active 276 DOM
-
2026-06-17days on market $135,000 Active 275 DOM
-
2026-06-16days on market $135,000 Active 274 DOM
-
2026-06-15days on market $135,000 Active 273 DOM
-
2026-06-14days on market $135,000 Active 271 DOM
-
2026-06-13days on market $135,000 Active 270 DOM
-
2026-06-10days on market $135,000 Active 268 DOM
-
2026-06-09days on market $135,000 Active 267 DOM
-
2026-06-08pricedays on market $135,000 Active 266 DOM
-
2026-06-07days on market $145,000 Active 265 DOM
-
2026-06-05statusdays on market $145,000 Active 262 DOM
-
2026-06-03days on market $145,000 Active Under Contract 261 DOM
-
2026-06-02days on market $145,000 Active Under Contract 260 DOM
-
2026-06-01days on market $145,000 Active Under Contract 259 DOM
-
2026-05-31days on market $145,000 Active Under Contract 258 DOM
-
2026-05-30days on market $145,000 Active Under Contract 257 DOM
-
2026-05-01historical Active Under Contract
-
2026-02-09price $145,000
-
2025-11-21price $155,500
-
2025-09-15$169,500 Active
ⓘ Source: listings_history table (triggers on properties + properties_extension) + one-shot
backfill from property_details.listing_events for pre-trigger history.
Climate risk First Street
- Flood 1/10 Low FEMA zone X (unshaded) · 0% chance over 30 yrs
- Wildfire 7/10 Severe
- Heat 6/10 Major 7 d/yr ≥101°F today · 14 d/yr by 30 yrs out
- Wind 1/10 Low
- Air quality 10/10 Extreme 21 unhealthy d/yr today · 22 by 30 yrs out
Nearby sold comps map
Loading sold comps map…
Walkable amenities ~0.75 mi
Loading nearby amenities…
Taxation est. · year 1
- Rental income
- $31,332
- − Mortgage interest
- −$7,562
- − Property taxes
- −$2,025
- − Insurance
- −$675
- − Repairs & maintenance
- −$2,507
- − Management
- −$2,507
- − Depreciation
- −$3,927
- Taxable income
- $12,129
- Est. tax owed @ 24.0%
- −$2,911
- After-tax cash flow
- $10,646/yr
For passive investors: Depreciation is non-cash, so a rental often shows a tax loss while cash-flowing — sheltering income. Rental losses are passive: they offset passive income freely, and up to $25,000/yr can offset ordinary (W-2) income if you actively participate and your MAGI is under $100k (phasing out to $0 by $150k); unused losses carry forward. On sale, claimed depreciation is recaptured at up to 25%, and gains may owe capital-gains tax (a 1031 exchange can defer both). Figures are a year-1 estimate at your 24.0% rate — not tax advice; consult a CPA.
Schools (NCES district)
- District
- Vacaville Unified
- NCES district ID
- 0640590
- Math proficiency
- 37% ▼ -1.00%
- Reading proficiency
- 52% ▲ 2.00%
- Median HH income
- $71,383
- Composite
- 42.48/100
- National rank
- #6877
- State rank
- #522 of 1400 in CA
Livability — Vacaville
- Score
- 77/100
- State rank
- #88
- US rank
- #3156
Category grades
Schools grade is shown separately in the Schools card above.
Census & demographics
- Census place
- Vacaville, CA
- County
- Solano County · 433,239 people
- City population
- 109,591
- Metro
- Vallejo, CA
- Population (ZIP)
- 69,390
- Household income
- $109,566
- Rent vs Own
- Severe rent burden
- 1761.0
Population outlook (Solano County) Hauer SSP2
- Today (2025)
- 478,685 people
- By 2030
- 497,974 · +4.0%
- By 2040
- 528,515 · +10.4%
- By 2050
- 549,115 · +14.7%
- By 2075
- 587,229 · +22.7%
- By 2100
- 571,378 · +19.4%
Race, ethnicity, and origin ACS 2023
- Neighborhood character
- Highly diverse neighborhood (Simpson 0.71)
- Race & ethnicity
- White 44% Hispanic / Latino 26% Two or more races 13% Black 10% Asian 10% Native American 1%
- Hispanic origin (detail)
- Mexican 18% Puerto Rican 2%
- Common ancestry
- Italian 13% Lithuanian 2% Portuguese 1%
- Foreign-born
- 12% · Canada, China
- Languages at home
- 80% English-only · Spanish 12% Tagalog/Filipino 3% Other Indo-European 2%
Political lean MEDSL · Solano
- 2024 margin
- Strong D (+23.0) · D 60.0% · R 37.1% · Other 2.9%
- 2008→2024 swing
- -5.6pp toward R · 2008: 28.6pp · 2024: 23.0pp
- All cycles
- 2024: D+23.0 2020: D+30.3 2016: D+30.5 2012: D+28.1 2008: D+28.6
Not yet ingested
- Civics
- —
Market trends
- HPI YoY
- ▼ -299.59%
- Current HPI
- 268.0777
- Rent YoY
- ▼ -0.55%
- Metro
- Vallejo, CA
- State GDP YoY
- ▲ 3.21%
- F500 in state
- 116
Industry mix (Fortune 500 HQ in CA)
| Industry | F500 HQs | Revenue |
|---|---|---|
| Technology | 27 | $1,492B |
|
||
| Financial Services | 3 | $174B |
|
||
| Retail | 3 | $44B |
|
||
| Insurance | 3 | $26B |
|
||
| Media / Entertainment | 2 | $115B |
|
||
| Pharmaceuticals / Biotech | 2 | $62B |
|
||
Price history
-14.5% since first listed4 events — show timeline
- 2026-05-01 Contingent — bridgeMLS, Bay East AOR, or Contra Costa AOR
- 2026-02-09 Price Changed $145,000 bridgeMLS, Bay East AOR, or Contra Costa AOR
- 2025-11-21 Price Changed $155,500 bridgeMLS, Bay East AOR, or Contra Costa AOR
- 2025-09-15 Listed $169,500 bridgeMLS, Bay East AOR, or Contra Costa AOR
Cash-flow waterfall
monthlySold comps — $/sqft
last 12 mo · ≤1 miLoading sold comps…