142 Whitner Dr · Hazel Green, AL
Flood risk 1/10 · Minimal
- FEMA flood zone
- X (unshaded)
- Chance of flooding over 30 yrs
- 0.0%
- Est. flood insurance / yr
- $507 – $1,088
Fire risk 1/10 · Minimal
- Est. fire insurance / yr
- $916 – $1,700
Heat risk 5/10 · Moderate
- Hot days now (above 104°F)
- 7 days/yr
- Hot days in 30 yrs
- 19 days/yr
Wind risk 5/10 · Moderate
- Chance of severe wind over 30 yrs
- 26.0%
Air-quality risk 2/10 · Minimal
- Unhealthy air days now
- 0 days/yr
- Unhealthy air days in 30 yrs
- 1 days/yr
Risk factors via First Street. Map © Google.
Why this score? — see what drove the D- grade
The composite is a weighted blend of 9 inputs, each scored 0–100. Each bar is that input's sub-score; the figure is the points it added to the 100-point composite (weight × sub-score).
- ARV discount +11.0/15.0
- Appreciation +10.0/10.0
- Cash flow +4.9/30.0
- Schools +3.7/10.0
- Livability +3.5/5.0
- Rent growth +2.5/5.0
- Condition / age +2.5/5.0
- 1% rule +0.7/10.0
- DSCR +0.0/10.0
$311,150
🖨 Deal sheet 📄 Offer letter ✓ Due diligence
Listing remarks MLS
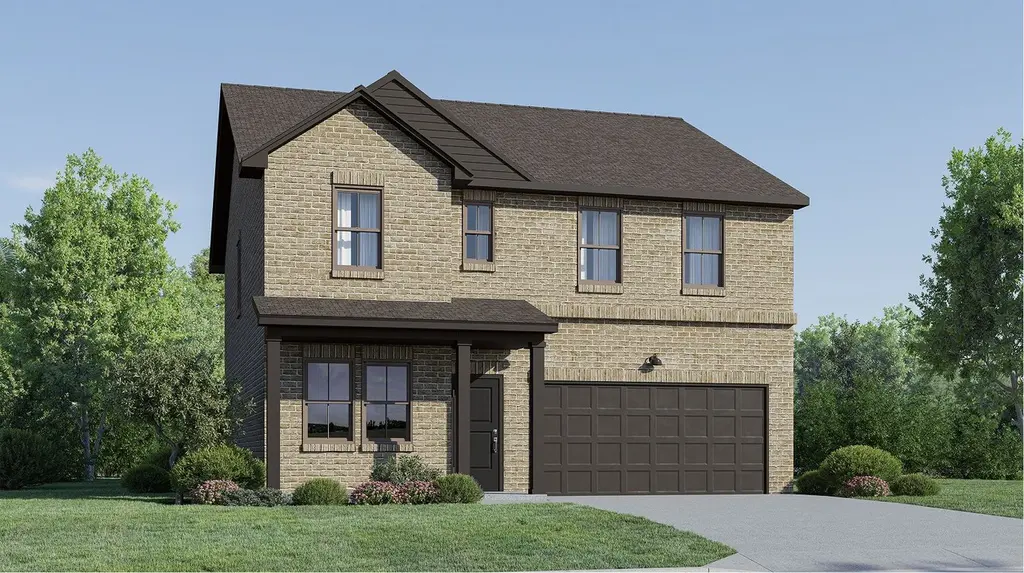
This new two-story home features a secluded study off the foyer, perfect for concentrating on important tasks throughout the week, near an open-concept floorplan that blends the kitchen, living and dining areas to maximize interior space. On the second floor, a versatile and inviting loft is surrounded by four bedrooms, including a luxurious owner's suite with a full bathroom and walk-in closet.
Key facts
- Secluded study
- Full bathroom
- Walk-in closet
Tags
Neighborhood map
What this means for you Summary
Snapshot
- This is a 4-bed/2.5-bath single-family listed at $311k.
Deal economics
- At list price, monthly cash flow is $-748 ($-9k/yr) — negative.
- To cash-flow at today's rent, offer at most $203k (34.8% below list).
- To meet the 1% rule (rent ≥ 1% of price), the offer needs to be $178k (42.9% below list).
- Recommended offer: $178k (42.9% below list) — sets the bar for 1% rule.
Location & tenants
- Location reads 69/100 on livability (#54 in AL) — a middle-class / working-renter tenant base. Strengths: cost of living A+, housing A+, crime A; Watch: schools C-, amenities F, commute F.
- Madison County (rural): math 27% / reading 56% proficiency, ranked #19 of 129 in AL (top 15%) — families likely to look elsewhere, expect single-tenant / working-renter base with shorter leases.
- Market conditions: 256 active listings in the ZIP; 16 comparable units currently listed for rent nearby; rentals at typical pace (median 24d on market — plan ~3-4 weeks tenant-placement turnaround); 4,709 units permitted in Madison County in 2024 (1,186 in 5+ unit buildings).
- This rent runs 31% of the median local income ($68k/yr) — at the standard rent-burdened threshold; future hikes will face affordability resistance.
Forward outlook
- In year one you build about $33k of equity ($2k loan paydown + $31k appreciation (10.0% local appreciation)).
- Madison County population projected at +18% by 2050 — long-run rental-demand tailwind backs the buy-and-hold thesis.
- By year 2, paydown + projected appreciation supports a ~$53k cash-out refi (75% LTV) — recoverable capital for the next deal without selling this one.
Negotiation context
- It's been on market 72 days — a 6% lower offer ($292k) is reasonable based on typical stale-listing flexibility.
Risks & watch-outs
- Climate carrying-cost: moderate wind risk, 26% chance of damaging wind over 30y; extreme-heat days projected 7→19/yr by 2055 (HVAC capex compounding) — expect insurance premiums to compound above CPI over the hold.
Questions for the listing agent
- What do current leases actually rent for vs. the listed asking? Can we see a recent rent roll and the last 12 months of T-12 income?
- It's been on market 72 days. Have you received any prior offers? Is the seller open to a 43% concession, seller financing, or rate buy-down credit?
- Why hasn't it sold? Are there any deal-killer items the seller is aware of (foundation, flood, title, zoning, code violations)?
- Is there a deadline driving the sale (1031 exchange, divorce, estate, relocation)? That informs how much negotiation room exists.
- The area grade is low — what's the realistic commute time and amenity access for the typical tenant pool here? Any planned neighborhood developments (good or bad) we should know about?
- What's the average days-on-market for RENTAL listings here right now (not sales)? A rising rental-DOM trend means longer vacancies and softer asking-rent achievability than the comps imply.
- What's the recent tenant-quality profile in this submarket — average credit score on applications, eviction rate, late-payment / NSF rate, and stable-employment percentage? A property-management company in the area should have these aggregated.
- How much new for-sale + rental construction is in the pipeline within 1–3 miles? Heavy new supply typically softens prices + rents 12–24 months out; constrained supply supports both.
Investment metrics
- 1% rule
- 0.57% ✗
- Cap rate
- 3.41%
- Cash-on-cash
- -10.30%
- DSCR
- 0.54
- GRM
- 14.6
CMA / ARV
- ARV (median comp)
- $337,413
- List price
- $311,150
- Delta
- -7.78%
- Verdict
- FAIR
- Comps
- 20 within 1.0 mi
Show comp detail 12 sales within ~0.75 mi
| Address | Dist | Beds/Ba | Sqft | Sold | Price | $/sf | Match |
|---|---|---|---|---|---|---|---|
| 109 Huffman St | 0.27mi | 3/2.5 (-1) | 2,209 (-5%) | 3mo | $324,900 | $147 | 72 |
| 137 Sublett Dr | 0.19mi | 4/2.5 | 2,572 (+11%) | 2mo | $309,000 | $120 | 72 |
| 112 Huffman St | 0.28mi | 3/2.5 (-1) | 2,209 (-5%) | 8mo | $339,900 | $154 | 67 |
| 113 Huffman St | 0.26mi | 4/3.0 | 2,583 (+11%) | 2mo | $359,900 | $139 | 66 |
| 101 Oliver Ct | 0.21mi | 4/2.5 | 2,050 (-12%) | 6mo | $254,900 | $124 | 66 |
| 176 Keller Dr | 0.24mi | 5/3.0 (+1) | 2,092 (-10%) | 1mo | $309,310 | $148 | 64 |
| 173 Keller Dr | 0.21mi | 5/3.0 (+1) | 2,092 (-10%) | 4mo | $301,900 | $144 | 63 |
| 122 Hazel Pine Trl | 0.45mi | 4/3.0 | 2,136 (-8%) | 1mo | $302,890 | $142 | 63 |
| 170 Keller Dr | 0.22mi | 5/3.0 (+1) | 2,092 (-10%) | 6mo | $309,310 | $148 | 62 |
| 162 Keller Dr | 0.19mi | 5/3.0 (+1) | 2,092 (-10%) | 9mo | $300,900 | $144 | 60 |
| 148 Hazel Pine Trl | 0.59mi | 4/3.0 | 2,136 (-8%) | 2mo | $330,000 | $154 | 55 |
| 134 Twin Rivers Dr | 0.75mi | 3/2.0 (-1) | 2,106 (-9%) | 8mo | $399,900 | $190 | 36 |
Match score weights: distance 35% · size 25% · config 20% · recency 20%. Top-matched comps best support the ARV.
Projected returns pro-forma
10.0% appreciation · 3.0% rent growth · sell at horizon
- IRR
- 17.1%
- Equity multiple
- 2.40×
- Total profit
- $121,860
- Equity at exit
- $280,309
- IRR
- 16.2%
- Equity multiple
- 5.55×
- Total profit
- $396,366
- Equity at exit
- $604,496
Cash invested: $87,122 (down + closing). Projections, not guarantees.
Landlord ↔ Tenant lean methodology
- Overall (STATE)
- 90 Strongly Landlord-Friendly
- State Alabama
- 90 Strongly Landlord-Friendly · R+15
- County
- — inherits STATE
- City
- — inherits STATE
ZIP-level market 35750
- Home prices YoY
- 8.2%
- Active inventory
- 256
- Price-to-rent
- 14.6×
Monthly cashflow live
- Estimated rent
- $1,775 high interval (Pro) →
- Mortgage (P&I)
- −$1,632
- Tax est. 1.5%
- −$389 /mo · $4,667/yr
- Insurance
- −$130
- HOA
- −$0
- Vacancy / Maint / Mgmt
- −$373
- Net cashflow
- $-748
Break-even live
UW: 25.0% down · 7.5% · 30yr · 1.5% tax · 5.0% vac · 8.0% maint · 8.0% mgmt
Financing live
Cash to close
- Down payment
- $77,788
- Closing costs
- $9,334
- Reserves months
- —
- Total cash needed
- —
Loan-product check · same deal, 3 products live
Conventional
25% down · 7.5% · 30yr
- Down + closing
- —
- Monthly P&I
- —
- Monthly cashflow
- —
- DSCR
- —
- Eligible?
- —
Personal DTI + credit; lowest rate.
DSCR
20% down · 8.5% · 30yr
- Down + closing
- —
- Monthly P&I
- —
- Monthly cashflow
- —
- DSCR
- —
- Eligible?
- —
No personal income docs; deal must DSCR.
Hard money
10% down · 12.0% · 12mo
- Down + closing
- —
- Monthly P&I
- —
- Monthly cashflow
- —
- DSCR
- —
- Eligible?
- —
Short-term bridge; refi at stabilization.
Rent comps 16 comps
| Address | Beds | Baths | Sqft | Rent | $/sqft | DOM | Units | Dist |
|---|---|---|---|---|---|---|---|---|
| 108 Karenlee Cir Hazel Green, AL | 4.0 | 2.0 | 1666 | $1,685 | $1.01 | 23d | 1 | 0.14mi |
| 143 Havner Dr Hazel Green, AL | 4.0 | 2.0 | 1667 | $1,775 | $1.06 | 13d | 1 | 0.16mi |
| 147 Tobin Ln Hazel Green, AL | 4.0 | 2.0 | 1884 | $1,700 | $0.90 | 43d | 1 | 0.16mi |
| 189 Tobin Ln Hazel Green, AL | 3.0 | 2.0 | 1685 | $1,775 | $1.05 | 13d | 1 | 0.17mi |
| 171 Keller Dr Hazel Green, AL | 3.0 | 2.0 | 1683 | $1,616 | $0.96 | 43d | 1 | 0.22mi |
| 236 Cherry Laurel Dr Hazel Green, AL | 4.0 | 3.0 | 1964 | $1,750 | $0.89 | 23d | 1 | 0.27mi |
| 206 Hailey May Ct Hazel Green, AL | 4.0 | 2.5 | 1924 | $1,745 | $0.91 | 13d | 1 | 1.14mi |
| 202 Hailey May Ct Hazel Green, AL | 4.0 | 2.5 | 1727 | $1,645 | $0.95 | 23d | 1 | 1.17mi |
| 203 Hailey May Ct Hazel Green, AL | 4.0 | 2.0 | 1797 | $1,695 | $0.94 | 23d | 1 | 1.18mi |
| 127 London Calvin Way Hazel Green, AL | 4.0 | 2.5 | 1727 | $1,645 | $0.95 | 13d | 1 | 1.19mi |
| 119 London Calvin Way Hazel Green, AL | 4.0 | 2.5 | 1924 | $1,745 | $0.91 | 13d | 1 | 1.21mi |
| 106 London Calvin Way Hazel Green, AL | 4.0 | 2.0 | 1797 | $1,684 | $0.94 | 43d | 1 | 1.22mi |
| 115 London Calvin Way Hazel Green, AL | 4.0 | 2.5 | 1971 | $1,734 | $0.88 | 43d | 1 | 1.22mi |
| 104 London Calvin Way Hazel Green, AL | 4.0 | 2.5 | 1971 | $1,745 | $0.89 | 23d | 1 | 1.22mi |
| 102 London Calvin Way Hazel Green, AL | 4.0 | 2.5 | 1924 | $1,745 | $0.91 | 23d | 1 | 1.23mi |
| 149 Hazel Trce Hazel Green, AL | 3.0 | 2.0 | 1628 | $1,695 | $1.04 | 13d | 1 | 1.24mi |
Listing history 15 events
-
2026-06-18days on market $311,150 Active 72 DOM
-
2026-06-17days on market $311,150 Active 71 DOM
-
2026-06-16days on market $311,150 Active 70 DOM
-
2026-06-15days on market $311,150 Active 69 DOM
-
2026-06-14days on market $311,150 Active 67 DOM
-
2026-06-10days on market $311,150 Active 64 DOM
-
2026-06-09days on market $311,150 Active 63 DOM
-
2026-06-08days on market $311,150 Active 62 DOM
-
2026-06-07days on market $311,150 Active 61 DOM
-
2026-06-02days on market $311,150 Active 56 DOM
-
2026-06-01days on market $311,150 Active 55 DOM
-
2026-05-31days on market $311,150 Active 54 DOM
-
2026-05-30days on market $311,150 Active 53 DOM
-
2026-04-23price $304,900 398-char remark
Show marketing remark (398 chars)
This new two-story home features a secluded study off the foyer, perfect for concentrating on important tasks throughout the week, near an open-concept floorplan that blends the kitchen, living and dining areas to maximize interior space. On the second floor, a versatile and inviting loft is surrounded by four bedrooms, including a luxurious owner's suite with a full bathroom and walk-in closet.
-
2026-04-07$302,900 Active 398-char remark
Show marketing remark (398 chars)
This new two-story home features a secluded study off the foyer, perfect for concentrating on important tasks throughout the week, near an open-concept floorplan that blends the kitchen, living and dining areas to maximize interior space. On the second floor, a versatile and inviting loft is surrounded by four bedrooms, including a luxurious owner's suite with a full bathroom and walk-in closet.
ⓘ Source: listings_history table (triggers on properties + properties_extension) + one-shot
backfill from property_details.listing_events for pre-trigger history.
Climate risk First Street
- Flood 1/10 Low FEMA zone X (unshaded) · 0% chance over 30 yrs
- Wildfire 1/10 Low
- Heat 5/10 Major 7 d/yr ≥104°F today · 19 d/yr by 30 yrs out
- Wind 5/10 Major 26% chance of damaging wind over 30 yrs
- Air quality 2/10 Low 0 unhealthy d/yr today · 1 by 30 yrs out
Nearby sold comps map
Loading sold comps map…
Walkable amenities ~0.75 mi
Loading nearby amenities…
Taxation est. · year 1
- Rental income
- $21,304
- − Mortgage interest
- −$17,429
- − Property taxes
- −$4,667
- − Insurance
- −$1,556
- − Repairs & maintenance
- −$1,704
- − Management
- −$1,704
- − Depreciation
- −$9,052
- Taxable loss
- −$14,809
- Est. tax savings @ 24.0%
- +$3,554
- After-tax cash flow
- $-5,419/yr
For passive investors: Depreciation is non-cash, so a rental often shows a tax loss while cash-flowing — sheltering income. Rental losses are passive: they offset passive income freely, and up to $25,000/yr can offset ordinary (W-2) income if you actively participate and your MAGI is under $100k (phasing out to $0 by $150k); unused losses carry forward. On sale, claimed depreciation is recaptured at up to 25%, and gains may owe capital-gains tax (a 1031 exchange can defer both). Figures are a year-1 estimate at your 24.0% rate — not tax advice; consult a CPA.
Schools (NCES district)
- District
- Madison County
- NCES district ID
- 0102220
- Math proficiency
- 27% ▼ -32.00%
- Reading proficiency
- 56% ▼ -1.00%
- Median HH income
- $66,058
- Composite
- 37.15/100
- National rank
- #4483
- State rank
- #19 of 129 in AL
Livability — Hazel Green
- Score
- 69/100
- State rank
- #54
- US rank
- #8575
Category grades
Schools grade is shown separately in the Schools card above.
Census & demographics
- Census place
- Hazel Green, AL
- County
- Madison County · 380,832 people
- City population
- 13,413
- Metro
- Huntsville, AL
- Population (ZIP)
- 13,413
- Household income
- $68,389
- Rent vs Own
- Severe rent burden
- 162.0
Population outlook (Madison County) Hauer SSP2
- Today (2025)
- 392,086 people
- By 2030
- 409,788 · +4.5%
- By 2040
- 440,557 · +12.4%
- By 2050
- 460,990 · +17.6%
- By 2075
- 502,872 · +28.3%
- By 2100
- 513,623 · +31.0%
Race, ethnicity, and origin ACS 2023
- Neighborhood character
- Predominantly White (71%)
- Race & ethnicity
- White 71% Black 19% Asian 5% Two or more races 3% Hispanic / Latino 2%
- Common ancestry
- Slovak 1% Serbian 1% Romanian 1%
- Foreign-born
- 3% · Canada
- Languages at home
- 95% English-only · Spanish 2% Chinese 1% Korean 1%
Political lean MEDSL · Madison
- 2024 margin
- Lean R (+9.0) · D 44.7% · R 53.7% · Other 1.6%
- 2008→2024 swing
- +6.0pp toward D · 2008: -14.9pp · 2024: -9.0pp
- All cycles
- 2024: R+9.0 2020: R+8.0 2016: R+16.8 2012: R+18.7 2008: R+14.9
Not yet ingested
- Civics
- —
Market trends
- HPI YoY
- ▲ 33.59%
- Current HPI
- 444.7418
- Rent YoY
- —
- Metro
- Huntsville, AL
- State GDP YoY
- ▲ 2.94%
- F500 in state
- 4
Industry mix (Fortune 500 HQ in AL)
| Industry | F500 HQs | Revenue |
|---|---|---|
| Financial Services | 1 | $8B |
|
||
| Healthcare | 1 | $5B |
|
||
Price history
+0.7% since first listed2 events — show timeline
- 2026-04-23 Price Changed $304,900 Zillow
- 2026-04-07 Listed $302,900 Zillow
Cash-flow waterfall
monthlySold comps — $/sqft
last 12 mo · ≤1 miLoading sold comps…