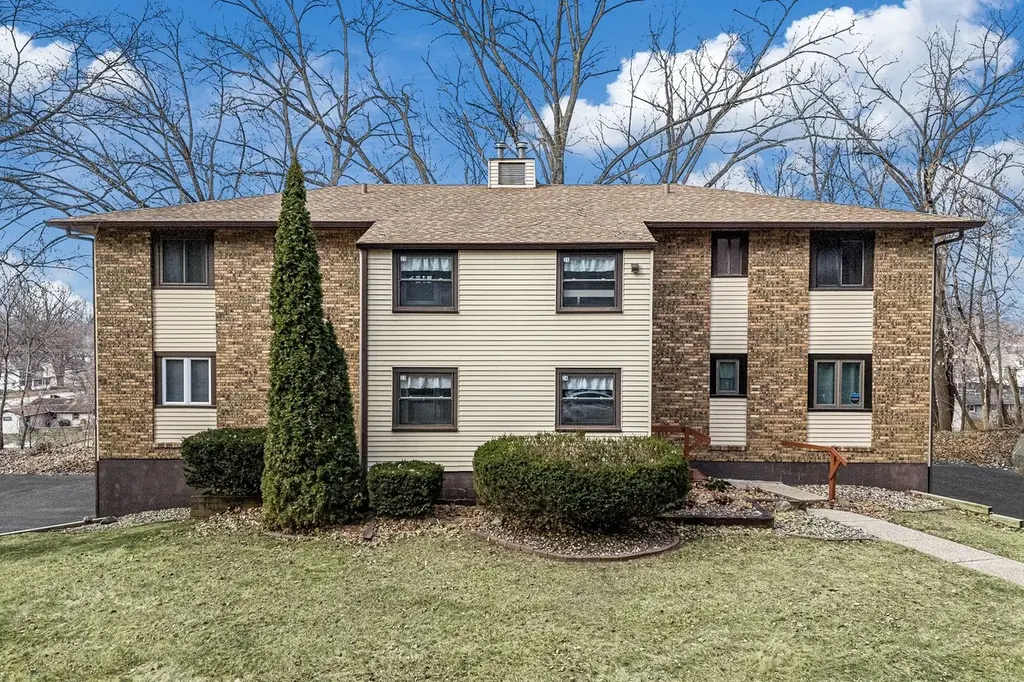
25 Cherry Hill Ct · Hampton, IL
Flood risk 1/10 · Minimal
- FEMA flood zone
- X (unshaded)
- Chance of flooding over 30 yrs
- 0.0%
- Est. flood insurance / yr
- $507 – $1,088
Fire risk 1/10 · Minimal
- Est. fire insurance / yr
- $804 – $1,492
Heat risk 3/10 · Minor
- Hot days now (above 103°F)
- 7 days/yr
- Hot days in 30 yrs
- 15 days/yr
Wind risk 2/10 · Minimal
- Chance of severe wind over 30 yrs
- —
Air-quality risk 2/10 · Minimal
- Unhealthy air days now
- 1 days/yr
- Unhealthy air days in 30 yrs
- 2 days/yr
Risk factors via First Street. Map © Google.
Why this score? — see what drove the B grade
The composite is a weighted blend of 9 inputs, each scored 0–100. Each bar is that input's sub-score; the figure is the points it added to the 100-point composite (weight × sub-score).
- Cash flow +30.0/30.0
- 1% rule +10.0/10.0
- DSCR +10.0/10.0
- ARV discount +6.6/15.0
- Appreciation +6.3/10.0
- Livability +3.4/5.0
- Rent growth +2.5/5.0
- Condition / age +2.5/5.0
- Schools +1.2/10.0
$112,000
🖨 Deal sheet 📄 Offer letter ✓ Due diligence
Listing remarks
* 55+ Community * This charming end unit is located on a quiet street, close to River Dr and a restaurant, retail shops and convenient stores. I-80 Interstate is conventionally located just 4 miles away. The main level has carpet and vinyl/linoleum floors. Also on the main level are 2 bedrooms, a full bath, a half bath and laundry. The kitchen features vinyl/linoleum floors, laminate counters, tiled backsplash and stainless steel appliances. Appliances stay with the home. The primary bedroom is located on the main level and features carpet floors and conventional ceiling. The primary bedroom's attached bath includes vinyl/linoleum floors and laminate counters. Outside you'll find a treated
Key facts
- Quiet street
- Overlooking the yard
- Treated wood deck
Tags
Property features AI
Finance
- HOA & community: Monthly association fee of $180 covering water, insurance, and lawn care
Exterior
- Parking: Attached garage with garage door opener (1 garage space, 1 total parking)
- Utilities: Public water; Public sewer
- Home design: Attached single-family townhouse — 2 stories; Fee simple ownership; Interstate access; Adult community
- Construction: Built approximately 41–50 years ago; Steel siding, brick and frame construction; Block foundation; Asphalt roof
- Exterior features: Wooded lot
Interior
- Kitchen: Range; Microwave; Dishwasher; Refrigerator; Garbage disposal; Stainless steel appliances
- Bedrooms: Two bedrooms (including a main-level master bedroom)
- Flooring: Laminate flooring
- Bathrooms: One full bath and one half bath
- Heating & cooling: Natural gas heating; Central air conditioning
- Interior features: Four total rooms; Ceiling fans; CO detectors; Cable TV hookup
- Laundry & utility: Main-level laundry; Washer and dryer included
Neighborhood map
What this means for you Summary
Snapshot
- This is a 2-bed/1.5-bath townhouse listed at $112k.
Deal economics
- At list price, monthly cash flow is $504 ($6k/yr) — positive.
- The deal already cash-flows at list — no discount required.
- Meets the 1% rule at list price ($2k rent vs $112k).
Location & tenants
- Location reads 67/100 on livability (#508 in IL) — a middle-class / working-renter tenant base. Strengths: crime A+, cost of living A+, housing A+; Watch: amenities F, commute F, health & safety F.
- United Twp Hsd 30 (suburban): math 12% / reading 15% proficiency, ranked #536 of 620 in IL (top 86%) — low school quality limits family demand, transient renter base, plan for 1-2y turnover.
- Zoned schools: United Twp High School (math 12% / reading 15%, grade F, #498 of 693 statewide, top 72%, 1,789 students, 0% FRL).
- Market conditions: 16 active listings in the ZIP; 116 units permitted in Rock Island County in 2024 (50 in 5+ unit buildings).
Forward outlook
- In year one you build about $4k of equity ($774 loan paydown + $3k appreciation (2.7% local appreciation)).
- Rock Island County population projected at -12% by 2050 — secular population decline; favor cash flow + early exit over multi-decade hold.
- At projected returns (2.7% appreciation + 3.0% rent growth), your $31k cash investment doubles in ~4 years — after that, you're playing with house money.
- By year 9, paydown + projected appreciation supports a ~$32k cash-out refi (75% LTV) — recoverable capital for the next deal without selling this one.
Negotiation context
- Only 13 days on market — expect competitive offers; lowballing is unlikely to land.
Questions for the listing agent
- What does the HOA fee cover, when was the last increase, and are there any pending special assessments or reserve-fund shortfalls?
- Is there a deadline driving the sale (1031 exchange, divorce, estate, relocation)? That informs how much negotiation room exists.
- What's the average days-on-market for RENTAL listings here right now (not sales)? A rising rental-DOM trend means longer vacancies and softer asking-rent achievability than the comps imply.
- What's the recent tenant-quality profile in this submarket — average credit score on applications, eviction rate, late-payment / NSF rate, and stable-employment percentage? A property-management company in the area should have these aggregated.
- How much new for-sale + rental construction is in the pipeline within 1–3 miles? Heavy new supply typically softens prices + rents 12–24 months out; constrained supply supports both.
Investment metrics
- 1% rule
- 1.57% ✓
- Cap rate
- 11.70%
- Cash-on-cash
- 19.30%
- DSCR
- 1.86
- GRM
- 5.3
CMA / ARV
- ARV (on-the-fly)
- $109,800
- Comps found
- 1
Show comp detail 1 sale within ~0.75 mi
| Address | Dist | Beds/Ba | Sqft | Sold | Price | $/sf | Match |
|---|---|---|---|---|---|---|---|
| 23 Cherry Hill Ct #124 | 0.01mi | 2/1.5 | 900 (0%) | 0mo | $110,000 | $122 | 99 |
Match score weights: distance 35% · size 25% · config 20% · recency 20%. Top-matched comps best support the ARV.
Projected returns pro-forma
2.69% appreciation · 3.0% rent growth · sell at horizon
- IRR
- 25.0%
- Equity multiple
- 2.40×
- Total profit
- $43,850
- Equity at exit
- $48,387
- IRR
- 26.1%
- Equity multiple
- 4.62×
- Total profit
- $113,578
- Equity at exit
- $73,070
Cash invested: $31,360 (down + closing). Projections, not guarantees.
Landlord ↔ Tenant lean methodology
- Overall (STATE)
- 43 Moderately Tenant-Leaning
- State Illinois
- 43 Moderately Tenant-Leaning · D+7
- County
- — inherits STATE
- City
- — inherits STATE
ZIP-level market 61256
- Home prices YoY
- 1.6%
- Active inventory
- 16
- Price-to-rent
- 5.3×
Monthly cashflow live
- Estimated rent
- $1,762 medium interval (Pro) →
- Mortgage (P&I)
- −$587
- Tax from tax record
- −$74 /mo · $886/yr
- Insurance
- −$47
- HOA
- −$180
- Vacancy / Maint / Mgmt
- −$370
- Net cashflow
- $504
Break-even live
UW: 25.0% down · 7.5% · 30yr · 1.5% tax · 5.0% vac · 8.0% maint · 8.0% mgmt
Financing live
Cash to close
- Down payment
- $28,000
- Closing costs
- $3,360
- Reserves months
- —
- Total cash needed
- —
Loan-product check · same deal, 3 products live
Conventional
25% down · 7.5% · 30yr
- Down + closing
- —
- Monthly P&I
- —
- Monthly cashflow
- —
- DSCR
- —
- Eligible?
- —
Personal DTI + credit; lowest rate.
DSCR
20% down · 8.5% · 30yr
- Down + closing
- —
- Monthly P&I
- —
- Monthly cashflow
- —
- DSCR
- —
- Eligible?
- —
No personal income docs; deal must DSCR.
Hard money
10% down · 12.0% · 12mo
- Down + closing
- —
- Monthly P&I
- —
- Monthly cashflow
- —
- DSCR
- —
- Eligible?
- —
Short-term bridge; refi at stabilization.
HOA detail
- Monthly dues
- $180 · $2,160/yr
Listing history 11 events
-
2026-06-18days on market $112,000 Active 13 DOM
-
2026-06-17days on market $112,000 Active 12 DOM
-
2026-06-16days on market $112,000 Active 11 DOM
-
2026-06-15days on market $112,000 Active 10 DOM
-
2026-06-14days on market $112,000 Active 8 DOM
-
2026-06-13days on market $112,000 Active 7 DOM
-
2026-06-10days on market $112,000 Active 5 DOM
-
2026-06-09days on market $112,000 Active 4 DOM
-
2026-06-08days on market $112,000 Active 3 DOM
-
2026-06-07remarks 699-char remark
-
2026-06-07$112,000 Active 2 DOM
ⓘ Source: listings_history table (triggers on properties + properties_extension) + one-shot
backfill from property_details.listing_events for pre-trigger history.
Tax reassessment forecast IL · Partial reset (capped growth)
- Current annual tax
- $886 · $74/mo
- Projected year-2 tax
- $1,714 · $143/mo
- Expected delta
- +$828/yr (+$69/mo · 93.4%)
ⓘ Screening estimate from a state-policy table — verify with the county assessor before closing.
Climate risk First Street
- Flood 1/10 Low FEMA zone X (unshaded) · 0% chance over 30 yrs
- Wildfire 1/10 Low
- Heat 3/10 Moderate 7 d/yr ≥103°F today · 15 d/yr by 30 yrs out
- Wind 2/10 Low
- Air quality 2/10 Low 1 unhealthy d/yr today · 2 by 30 yrs out
Nearby sold comps map
Loading sold comps map…
Walkable amenities ~0.75 mi
Loading nearby amenities…
Taxation est. · year 1
- Rental income
- $21,146
- − Mortgage interest
- −$6,274
- − Property taxes
- −$886
- − Insurance
- −$560
- − Repairs & maintenance
- −$1,692
- − Management
- −$1,692
- − HOA
- −$2,160
- − Depreciation
- −$3,258
- Taxable income
- $4,625
- Est. tax owed @ 24.0%
- −$1,110
- After-tax cash flow
- $4,941/yr
For passive investors: Depreciation is non-cash, so a rental often shows a tax loss while cash-flowing — sheltering income. Rental losses are passive: they offset passive income freely, and up to $25,000/yr can offset ordinary (W-2) income if you actively participate and your MAGI is under $100k (phasing out to $0 by $150k); unused losses carry forward. On sale, claimed depreciation is recaptured at up to 25%, and gains may owe capital-gains tax (a 1031 exchange can defer both). Figures are a year-1 estimate at your 24.0% rate — not tax advice; consult a CPA.
Schools (NCES district)
- District
- United Twp Hsd 30
- NCES district ID
- 1739870
- Math proficiency
- 12% ▼ -5.00%
- Reading proficiency
- 15% ▼ -6.00%
- Median HH income
- $43,647
- Composite
- 11.91/100
- National rank
- #9670
- State rank
- #536 of 620 in IL
Livability — Hampton
- Score
- 67/100
- State rank
- #508
- US rank
- #10505
Category grades
Schools grade is shown separately in the Schools card above.
Census & demographics
- Census place
- Hampton, IL
- City population
- 1,946
- Population (ZIP)
- 1,946
Population outlook (Rock Island County) Hauer SSP2
- Today (2025)
- 140,982 people
- By 2030
- 137,705 · -2.3%
- By 2040
- 130,512 · -7.4%
- By 2050
- 123,841 · -12.2%
- By 2075
- 109,851 · -22.1%
- By 2100
- 90,922 · -35.5%
Race, ethnicity, and origin ACS 2023
- Neighborhood character
- Predominantly White (76%)
- Race & ethnicity
- White 76% Hispanic / Latino 16% Two or more races 9% Black 2% Native American 1%
- Hispanic origin (detail)
- Mexican 16%
- Common ancestry
- Slovak 3% English 3% Italian 1%
- Foreign-born
- 2% · Canada
- Languages at home
- 93% English-only · Spanish 6% German/W. Germanic 1%
Political lean MEDSL · Rock Island
- 2024 margin
- Lean D (+9.6) · D 53.9% · R 44.4% · Other 1.7%
- 2008→2024 swing
- -15.0pp toward R · 2008: 24.6pp · 2024: 9.6pp
- All cycles
- 2024: D+9.6 2020: D+12.1 2016: D+8.4 2012: D+21.9 2008: D+24.6
Not yet ingested
- Civics
- —
Market trends
- HPI YoY
- ▲ 2.69%
- Current HPI
- 165.0514
- Rent YoY
- —
- Metro
- —
- State GDP YoY
- ▲ 1.59%
- F500 in state
- 60
Industry mix (Fortune 500 HQ in IL)
| Industry | F500 HQs | Revenue |
|---|---|---|
| Insurance | 4 | $201B |
|
||
| Consumer Goods | 4 | $87B |
|
||
| Industrial Machinery | 3 | $64B |
|
||
| Healthcare | 2 | $55B |
|
||
| Retail / Pharmacy | 1 | $148B |
|
||
| Agriculture / Food | 1 | $86B |
|
||
Price history
1 event — show timeline
- 2026-06-04 Listed $112,000 MRED as Distributed by MLS Grid
Property tax history
-0.3%/yrLatest (2024): $886 · -5.7% YoY. Source: county tax records.
Cash-flow waterfall
monthlySold comps — $/sqft
last 12 mo · ≤1 miLoading sold comps…