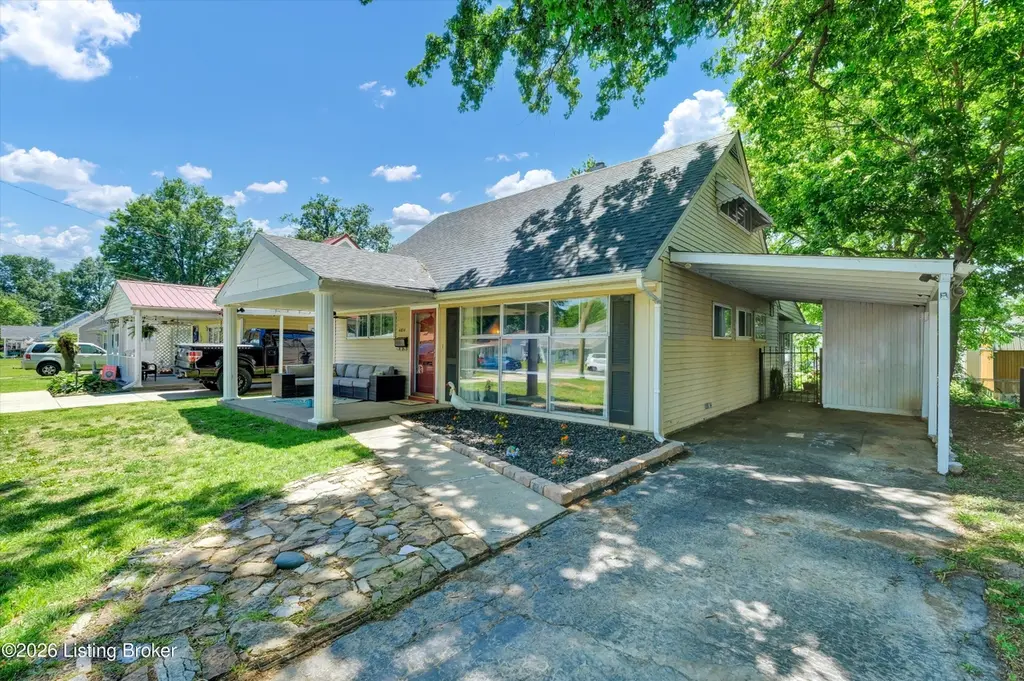
4814 Partridge Run · Lynnview, KY
Flood risk 1/10 · Minimal
- FEMA flood zone
- X (unshaded)
- Chance of flooding over 30 yrs
- 0.0%
- Est. flood insurance / yr
- $507 – $1,088
Fire risk 1/10 · Minimal
- Est. fire insurance / yr
- $839 – $1,559
Heat risk 5/10 · Moderate
- Hot days now (above 105°F)
- 7 days/yr
- Hot days in 30 yrs
- 20 days/yr
Wind risk 2/10 · Minimal
- Chance of severe wind over 30 yrs
- 2.0%
Air-quality risk 3/10 · Minor
- Unhealthy air days now
- 3 days/yr
- Unhealthy air days in 30 yrs
- 5 days/yr
Risk factors via First Street. Map © Google.
Why this score? — see what drove the D grade
The composite is a weighted blend of 9 inputs, each scored 0–100. Each bar is that input's sub-score; the figure is the points it added to the 100-point composite (weight × sub-score).
- Cash flow +16.1/30.0
- ARV discount +5.1/15.0
- DSCR +5.0/10.0
- Livability +4.1/5.0
- 1% rule +3.9/10.0
- Rent growth +2.5/5.0
- Condition / age +2.5/5.0
- Schools +2.3/10.0
- Appreciation +0.0/10.0
$215,000
🖨 Deal sheet (PDF) 📄 Offer letter ✓ Due diligence
Listing remarks MLS
WOW !! 4 BEDROOMS ! 2 up and 2 down ! Great Location ! Great condition ! Remodeled bath ! HVAC-2022. Water Heater-2021. Updated Electrical. Roof -2019 .Living room, Kitchen and Laundry on 1st floor. Family Room on rear of house. . Hardwood in Living Room. 1 car attached carport with attached storage. Storage Shed and Potting Shed in rear yard ! Move in Condition ! Don't Miss this one !
Key facts
- Inviting kitchen
- Front porch
- Bright living room
Tags
Property features AI
Finance
- Other: Located in the LYNNVIEW subdivision
- HOA & community: No association fee
Exterior
- Parking: Driveway
- Utilities: Electricity connected; Natural gas available
- Home design: Single-family residence in a Cape Cod style; 2 stories; Above-grade finished area 1,524
- Construction: Built in 1954; Vinyl siding; Shingle roof; Slab foundation
- Exterior features: Partial fencing; Lot approximately 0.14 acres
Interior
- Kitchen: Kitchen located on the first floor
- Bedrooms: 4 bedrooms total (2 on the first floor, 2 on the second floor)
- Bathrooms: 1 full bathroom on the first floor
- Heating & cooling: Natural gas heating; Central air and wall/window AC units
- Interior features: 7 total rooms; 6 closets; First-floor primary bedroom; No basement
- Laundry & utility: First-floor laundry
Neighborhood map
What this means for you Summary
Snapshot
- This is a 4-bed/1.0-bath single-family listed at $215k.
Deal economics
- At list price, monthly cash flow is $112 ($1k/yr) — positive.
- The deal already cash-flows at list — no discount required.
- To meet the 1% rule (rent ≥ 1% of price), the offer needs to be $191k (11.1% below list).
- Recommended offer: $191k (11.1% below list) — sets the bar for 1% rule.
Location & tenants
- Location reads 82/100 on livability (#62 in KY, #1,197 nationally) — a professional / high-income tenant draw. Strengths: commute A+, cost of living A+, housing A+; Watch: amenities F.
- Jefferson County (urban): math 19% / reading 35% proficiency, ranked #121 of 165 in KY (top 73%) — low school quality limits family demand, transient renter base, plan for 1-2y turnover.
- Zoned schools: Thomas Jefferson Middle (math 5% / reading 21%, grade F, #214 of 217 statewide, top 99%, 892 students, 72% FRL); Seneca High (math 8% / reading 17%, grade F, #228 of 254 statewide, top 91%, 1,309 students, 64% FRL).
- Zoned-school proficiency averages 13% at this address vs 27% district-wide (-14 pts) — the specific schools serving this property underperform the Jefferson County average; the district grade overstates school quality for this exact location.
- Market conditions: 45 active listings in the ZIP; 2 comparable units currently listed for rent nearby; 2,836 units permitted in Jefferson County in 2024 (1,558 in 5+ unit buildings).
- This rent runs 41% of the median local income ($56k/yr) — at the standard rent-burdened threshold; future hikes will face affordability resistance.
Forward outlook
- Local home prices are declining (-3.0%/yr); year-one equity from $1k of loan paydown is wiped out by about $6k of value loss. Plan a longer hold.
- Jefferson County population projected at +13% by 2050 — modest demand growth; plan on rents tracking national, not racing it.
Negotiation context
- Only 3 days on market — expect competitive offers; lowballing is unlikely to land.
- 2 sale attempts since 3y ago with the ask held roughly flat each time — persistent listings suggest the price (not the market) is what's stuck; bring a comps-based counter.
Risks & watch-outs
- Watch-outs: built in 1954 — expect roof / HVAC / electrical / plumbing capex.
- Climate carrying-cost: extreme-heat days projected 7→20/yr by 2055 (HVAC capex compounding) — expect insurance premiums to compound above CPI over the hold.
Questions for the listing agent
- Built in 1954 — when were the roof, HVAC, electrical panel, plumbing, and water heater last replaced?
- Is there a deadline driving the sale (1031 exchange, divorce, estate, relocation)? That informs how much negotiation room exists.
- The area grade is low — what's the realistic commute time and amenity access for the typical tenant pool here? Any planned neighborhood developments (good or bad) we should know about?
- What's the average days-on-market for RENTAL listings here right now (not sales)? A rising rental-DOM trend means longer vacancies and softer asking-rent achievability than the comps imply.
- What's the recent tenant-quality profile in this submarket — average credit score on applications, eviction rate, late-payment / NSF rate, and stable-employment percentage? A property-management company in the area should have these aggregated.
- How much new for-sale + rental construction is in the pipeline within 1–3 miles? Heavy new supply typically softens prices + rents 12–24 months out; constrained supply supports both.
Investment metrics
- 1% rule
- 0.89% ✗
- Cap rate
- 6.92%
- Cash-on-cash
- 2.23%
- DSCR
- 1.10
- GRM
- 9.4
CMA / ARV
- ARV (on-the-fly)
- $204,216
- Comps found
- 11
Show comp detail 11 sales within ~0.75 mi
| Address | Dist | Beds/Ba | Sqft | Sold | Price | $/sf | Match |
|---|---|---|---|---|---|---|---|
| 4800 Bluebird Ave | 0.17mi | 5/3.0 (+1) | 1,623 (+6%) | 2mo | $245,000 | $151 | 67 |
| 4803 Bluebird Ave | 0.19mi | 3/1.0 (-1) | 1,441 (-5%) | 19mo | $185,000 | $128 | 61 |
| 4832 Partridge Run | 0.09mi | 4/1.0 | 1,334 (-12%) | 20mo | $147,000 | $110 | 58 |
| 1215 Vim Dr | 0.51mi | 4/2.0 | 1,443 (-5%) | 8mo | $230,000 | $159 | 57 |
| 1250 Vim Dr | 0.63mi | 4/1.5 | 1,484 (-3%) | 13mo | $175,000 | $118 | 53 |
| 1218 Durrett Ln | 0.71mi | 3/1.0 (-1) | 1,490 (-2%) | 8mo | $200,000 | $134 | 51 |
| 1168 Norton Ave | 0.51mi | 3/1.0 (-1) | 1,352 (-11%) | 9mo | $195,000 | $144 | 44 |
| 4914 Warbler Way | 0.41mi | 3/1.5 (-1) | 1,400 (-8%) | 20mo | $197,500 | $141 | 43 |
| 4306 Hannah Ave | 0.65mi | 3/1.5 (-1) | 1,382 (-9%) | 7mo | $235,000 | $170 | 41 |
| 1213 Vim Dr | 0.51mi | 4/2.0 | 1,326 (-13%) | 12mo | $100,000 | $75 | 40 |
| 1230 Vim Dr | 0.56mi | 5/2.0 (+1) | 1,300 (-15%) | 8mo | $149,000 | $115 | 34 |
Match score weights: distance 35% · size 25% · config 20% · recency 20%. Top-matched comps best support the ARV.
Projected returns pro-forma
-3.0% appreciation · 3.0% rent growth · sell at horizon
- IRR
- -12.8%
- Equity multiple
- 0.54×
- Total profit
- $-27,743
- Equity at exit
- $32,057
- IRR
- -3.8%
- Equity multiple
- 0.75×
- Total profit
- $-15,092
- Equity at exit
- $18,589
Cash invested: $60,200 (down + closing). Projections, not guarantees.
Landlord ↔ Tenant lean methodology
- Overall (STATE)
- 83 Strongly Landlord-Friendly
- State Kentucky
- 83 Strongly Landlord-Friendly · R+16
- County
- — inherits STATE
- City
- — inherits STATE
ZIP-level market 40213
- Active inventory
- 45
- Price-to-rent
- 9.4×
Monthly cashflow live
- Estimated rent
- $1,911 medium interval (Pro) →
- Mortgage (P&I)
- −$1,127
- Tax from tax record
- −$181 /mo · $2,166/yr
- Insurance
- −$90
- HOA
- −$0
- Vacancy / Maint / Mgmt
- −$401
- Net cashflow
- $112
Break-even live
Sensitivity live
| Price | -10% $234 | -5% $173 | +0% $112 | +5% $51 | +10% $-10 |
|---|---|---|---|---|---|
| Rent | -10% $-39 | -5% $36 | +0% $112 | +5% $187 | +10% $263 |
| Rate | -1.0pp $220 | -0.5pp $166 | base $112 | +0.5pp $56 | +1.0pp $-1 |
UW: 25.0% down · 7.5% · 30yr · 1.5% tax · 5.0% vac · 8.0% maint · 8.0% mgmt
Financing live
Cash to close
- Down payment
- $53,750
- Closing costs
- $6,450
- Reserves months
- —
- Total cash needed
- —
Loan-product check · same deal, 3 products live
Conventional
25% down · 7.5% · 30yr
- Down + closing
- —
- Monthly P&I
- —
- Monthly cashflow
- —
- DSCR
- —
- Eligible?
- —
Personal DTI + credit; lowest rate.
DSCR
20% down · 8.5% · 30yr
- Down + closing
- —
- Monthly P&I
- —
- Monthly cashflow
- —
- DSCR
- —
- Eligible?
- —
No personal income docs; deal must DSCR.
Hard money
10% down · 12.0% · 12mo
- Down + closing
- —
- Monthly P&I
- —
- Monthly cashflow
- —
- DSCR
- —
- Eligible?
- —
Short-term bridge; refi at stabilization.
Rent comps 2 comps
| Address | Beds | Baths | Sqft | Rent | $/sqft | DOM | Units | Dist |
|---|---|---|---|---|---|---|---|---|
| 4034 Franklin Ave Louisville, KY | 3.0 | 1.0 | 1347 | $1,645 | $1.22 | 22d | 1 | 1.25mi |
| 3620 E Indian Trl Louisville, KY | 3.0 | 1.0 | 1134 | $1,495 | $1.32 | 5d | 1 | 1.39mi |
Listing history 6 events
-
2026-05-15status Pending
-
2026-05-11$215,000 Active
-
2024-01-12status Pending 391-char remark
Show marketing remark (391 chars)
WOW !! 4 BEDROOMS ! 2 up and 2 down ! Great Location ! Great condition ! Remodeled bath ! HVAC-2022. Water Heater-2021. Updated Electrical. Roof -2019 .Living room, Kitchen and Laundry on 1st floor. Family Room on rear of house. . Hardwood in Living Room. 1 car attached carport with attached storage. Storage Shed and Potting Shed in rear yard ! Move in Condition ! Don't Miss this one !
-
2024-01-12soldstatus $195,000 Closed 391-char remark
Show marketing remark (391 chars)
WOW !! 4 BEDROOMS ! 2 up and 2 down ! Great Location ! Great condition ! Remodeled bath ! HVAC-2022. Water Heater-2021. Updated Electrical. Roof -2019 .Living room, Kitchen and Laundry on 1st floor. Family Room on rear of house. . Hardwood in Living Room. 1 car attached carport with attached storage. Storage Shed and Potting Shed in rear yard ! Move in Condition ! Don't Miss this one !
-
2023-12-16historical Active Under Contract 391-char remark
Show marketing remark (391 chars)
WOW !! 4 BEDROOMS ! 2 up and 2 down ! Great Location ! Great condition ! Remodeled bath ! HVAC-2022. Water Heater-2021. Updated Electrical. Roof -2019 .Living room, Kitchen and Laundry on 1st floor. Family Room on rear of house. . Hardwood in Living Room. 1 car attached carport with attached storage. Storage Shed and Potting Shed in rear yard ! Move in Condition ! Don't Miss this one !
-
2023-12-05$195,000 Active 391-char remark
Show marketing remark (391 chars)
WOW !! 4 BEDROOMS ! 2 up and 2 down ! Great Location ! Great condition ! Remodeled bath ! HVAC-2022. Water Heater-2021. Updated Electrical. Roof -2019 .Living room, Kitchen and Laundry on 1st floor. Family Room on rear of house. . Hardwood in Living Room. 1 car attached carport with attached storage. Storage Shed and Potting Shed in rear yard ! Move in Condition ! Don't Miss this one !
ⓘ Source: listings_history table (triggers on properties + properties_extension) + one-shot
backfill from property_details.listing_events for pre-trigger history.
Tax reassessment forecast KY · Resets to sale price
- Current annual tax
- $2,166 · $181/mo
- Projected year-2 tax
- $2,166 · $181/mo
- Expected delta
- $0/yr ($0/mo · 0.0%)
ⓘ Screening estimate from a state-policy table — verify with the county assessor before closing.
Climate risk First Street
- Flood 1/10 Low FEMA zone X (unshaded) · 0% chance over 30 yrs
- Wildfire 1/10 Low
- Heat 5/10 Major 7 d/yr ≥105°F today · 20 d/yr by 30 yrs out
- Wind 2/10 Low 2% chance of damaging wind over 30 yrs
- Air quality 3/10 Moderate 3 unhealthy d/yr today · 5 by 30 yrs out
Nearby sold comps map
Loading sold comps map…
Walkable amenities ~0.75 mi
Loading nearby amenities…
Taxation est. · year 1
- Rental income
- $22,928
- − Mortgage interest
- −$12,043
- − Property taxes
- −$2,166
- − Insurance
- −$1,075
- − Repairs & maintenance
- −$1,834
- − Management
- −$1,834
- − Depreciation
- −$6,255
- Taxable loss
- −$2,280
- Est. tax savings @ 24.0%
- +$547
- After-tax cash flow
- $1,889/yr
For passive investors: Depreciation is non-cash, so a rental often shows a tax loss while cash-flowing — sheltering income. Rental losses are passive: they offset passive income freely, and up to $25,000/yr can offset ordinary (W-2) income if you actively participate and your MAGI is under $100k (phasing out to $0 by $150k); unused losses carry forward. On sale, claimed depreciation is recaptured at up to 25%, and gains may owe capital-gains tax (a 1031 exchange can defer both). Figures are a year-1 estimate at your 24.0% rate — not tax advice; consult a CPA.
Schools (NCES district)
- District
- Jefferson County
- NCES district ID
- 2102990
- Math proficiency
- 19% ▼ -17.00%
- Reading proficiency
- 35% ▼ -11.00%
- Median HH income
- $47,885
- Composite
- 23.45/100
- National rank
- #7884
- State rank
- #121 of 165 in KY
Livability — Lynnview
- Score
- 82/100
- State rank
- #62
- US rank
- #1197
Category grades
Schools grade is shown separately in the Schools card above.
Census & demographics
- Census place
- Lynnview, KY
- County
- Jefferson County · 790,184 people
- Metro
- Louisville/Jefferson County, KY-IN
- Population (ZIP)
- 16,054
- Household income
- $55,897
- Rent vs Own
- Severe rent burden
- 706.0
Population outlook (Jefferson County) Hauer SSP2
- Today (2025)
- 823,112 people
- By 2030
- 849,343 · +3.2%
- By 2040
- 895,696 · +8.8%
- By 2050
- 933,630 · +13.4%
- By 2075
- 1,028,262 · +24.9%
- By 2100
- 1,072,675 · +30.3%
Race, ethnicity, and origin ACS 2023
- Neighborhood character
- Diverse neighborhood (Simpson 0.57)
- Race & ethnicity
- White 60% Black 19% Hispanic / Latino 19% Two or more races 12%
- Hispanic origin (detail)
- Mexican 6% Cuban 11%
- Common ancestry
- Slovak 2% Lithuanian 2% Italian 1%
- Foreign-born
- 12% · Canada
- Languages at home
- 82% English-only · Spanish 16% French/Haitian/Cajun 1%
Political lean MEDSL · Jefferson
- 2024 margin
- D (+16.6) · D 57.4% · R 40.9% · Other 1.7%
- 2008→2024 swing
- +4.5pp toward D · 2008: 12.0pp · 2024: 16.6pp
- All cycles
- 2024: D+16.6 2020: D+20.1 2016: D+13.3 2012: D+11.1 2008: D+12.0
Not yet ingested
- Civics
- —
Market trends
- HPI YoY
- ▼ -153.39%
- Current HPI
- 244.8465
- Rent YoY
- —
- Metro
- Louisville/Jefferson County, KY-IN
- State GDP YoY
- ▲ 1.81%
- F500 in state
- 4
Industry mix (Fortune 500 HQ in KY)
| Industry | F500 HQs | Revenue |
|---|---|---|
| Healthcare | 1 | $118B |
|
||
| Food / Beverage | 1 | $7B |
|
||
Price history
+10.3% since first listed6 events — show timeline
- 2026-05-15 Pending — Metro Search MLS
- 2026-05-11 Listed $215,000 Metro Search MLS
- 2024-01-12 Pending — Metro Search MLS
- 2024-01-12 Sold (MLS) $195,000 Metro Search MLS
- 2023-12-16 Contingent — Metro Search MLS
- 2023-12-05 Listed $195,000 Metro Search MLS
Property tax history
+14.9%/yrLatest (2025): $2,166 · +96.2% YoY. Source: county tax records.
Cash-flow waterfall
monthlySold comps — $/sqft
last 12 mo · ≤1 miLoading sold comps…