10444 NW 30th Ct #202 · Sunrise, FL
Flood risk No data
- FEMA flood zone
- —
- Chance of flooding over 30 yrs
- —
- Est. flood insurance / yr
- —
Fire risk No data
- Est. fire insurance / yr
- —
Heat risk No data
- Hot days now (above threshold)
- —
- Hot days in 30 yrs
- —
Wind risk No data
- Chance of severe wind over 30 yrs
- —
Air-quality risk No data
- Unhealthy air days now
- —
- Unhealthy air days in 30 yrs
- —
Risk factors via First Street. Map © Google.
Why this score? — see what drove the D grade
The composite is a weighted blend of 9 inputs, each scored 0–100. Each bar is that input's sub-score; the figure is the points it added to the 100-point composite (weight × sub-score).
- Cash flow +10.1/30.0
- ARV discount +7.5/15.0
- 1% rule +6.6/10.0
- Livability +4.2/5.0
- Schools +4.1/10.0
- DSCR +2.9/10.0
- Rent growth +2.7/5.0
- Condition / age +2.5/5.0
- Appreciation +0.0/10.0
$193,000
🖨 Deal sheet 📄 Offer letter ✓ Due diligence
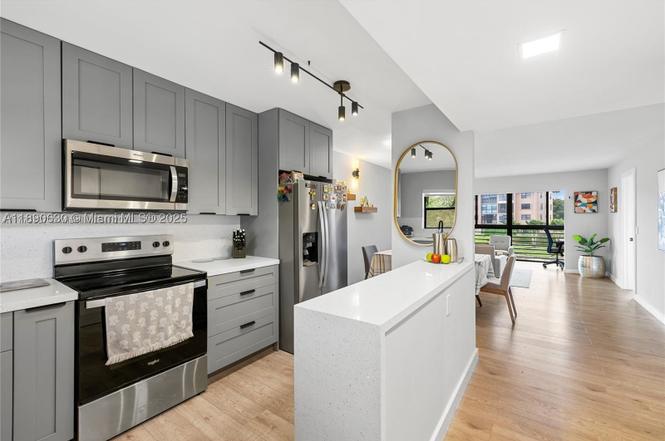
Listing remarks
Welcome to your dream remodeled home! This delightful condo offers a tranquil pool view. The community is designed for a luxurious lifestyle, featuring amenities such as a courtesy bus for non-drivers, ample parking for residents, and a vibrant clubhouse filled w/ ongoing activities. Enjoy a large swimming pool, fitness center, golf course, tennis courts, card games, a grand ballroom, and a theater. This unit is equipped with a washer/dryer. This is a 55+ community, ensuring a peaceful and engaging environment where at least one buyer must be 55 or older. Please note, rentals are not permitted. The association requires a credit score of 700 or above and an income of at least $35,000. For pr
Key facts
- Tranquil pool view
- Fitness center
- Ample parking
Tags
Property features AI
Finance
- Other: Annual tax information available; Virtual tour available
- Financial info: Pets not allowed
- HOA & community: Monthly association fee; Association amenities include clubhouse, fitness center, barbecue, picnic area, transportation service, elevator(s); Association covers management, amenities, hot water, grounds maintenance, structure maintenance, parking, pools; Senior community
Exterior
- Parking: Assigned parking; Guest parking; One covered space (garage)
- Security: Smoke detector(s)
- Utilities: Water: available; Sewer: available; Power: available
- Home design: Attached property; 4 stories; Entry on level 2; Updated/remodeled; Has a view; Lakefront waterfront
- Construction: Block construction; Resale property
- Exterior features: Balcony; Open balcony/patio
Interior
- Kitchen: Electric range; Microwave; Icemaker; Refrigerator; Dishwasher
- Bedrooms: Bedroom on main level
- Flooring: Ceramic tile; Laminate
- Bathrooms: 2 full bathrooms
- Heating & cooling: Central heating; Central air conditioning
- Interior features: Entrance foyer; First-floor entry; Bedroom on main level
- Laundry & utility: Washer; Dryer
Neighborhood map
What this means for you Summary
Snapshot
- This is a 2-bed/1.0-bath condo listed at $193k.
Deal economics
- At list price, monthly cash flow is $-114 ($-1k/yr) — negative.
- To cash-flow at today's rent, offer at most $173k (10.4% below list).
- Meets the 1% rule at list price ($2k rent vs $193k).
- Recommended offer: $170k (12.0% below list) — sets the bar for market timing.
Location & tenants
- Location reads 83/100 on livability (#56 in FL, #986 nationally) — a professional / high-income tenant draw. Strengths: commute A+, housing A+, health & safety A+; Watch: employment C-, amenities F.
- Broward (suburban): math 42% / reading 53% proficiency, ranked #46 of 73 in FL (top 63%) — families likely to look elsewhere, expect single-tenant / working-renter base with shorter leases.
- Market conditions: Rents flat; 559 active listings in the ZIP; 40 comparable units currently listed for rent nearby; rentals at typical pace (median 21d on market — plan ~3-4 weeks tenant-placement turnaround); 2,111 units permitted in Broward County in 2024 (1,265 in 5+ unit buildings).
- This rent runs 37% of the median local income ($72k/yr) — at the standard rent-burdened threshold; future hikes will face affordability resistance.
Forward outlook
- Local home prices are declining (-3.0%/yr); year-one equity from $1k of loan paydown is wiped out by about $6k of value loss. Plan a longer hold.
- Broward County population projected at +34% by 2050 — long-run rental-demand tailwind backs the buy-and-hold thesis.
Negotiation context
- It's been on market 255 days — a 12% lower offer ($170k) is reasonable based on typical stale-listing flexibility.
- 5 sale attempts since 3y ago with the ask held roughly flat each time — persistent listings suggest the price (not the market) is what's stuck; bring a comps-based counter.
- Current owner paid $129k; 50% above their basis — modest negotiation headroom, anchor on the comps not their cost.
Risks & watch-outs
- Watch-outs: HOA is 30% of rent.
Questions for the listing agent
- What do current leases actually rent for vs. the listed asking? Can we see a recent rent roll and the last 12 months of T-12 income?
- It's been on market 255 days. Have you received any prior offers? Is the seller open to a 12% concession, seller financing, or rate buy-down credit?
- What does the HOA fee cover, when was the last increase, and are there any pending special assessments or reserve-fund shortfalls?
- Any open or pending special assessments — roof, HVAC, plumbing, elevator, façade? What's the per-unit balance and payoff schedule, and is the seller paying it off at close or rolling it to the buyer?
- Why hasn't it sold? Are there any deal-killer items the seller is aware of (foundation, flood, title, zoning, code violations)?
- Is there a deadline driving the sale (1031 exchange, divorce, estate, relocation)? That informs how much negotiation room exists.
- The area grade is low — what's the realistic commute time and amenity access for the typical tenant pool here? Any planned neighborhood developments (good or bad) we should know about?
- What's the average days-on-market for RENTAL listings here right now (not sales)? A rising rental-DOM trend means longer vacancies and softer asking-rent achievability than the comps imply.
- What's the recent tenant-quality profile in this submarket — average credit score on applications, eviction rate, late-payment / NSF rate, and stable-employment percentage? A property-management company in the area should have these aggregated.
- How much new apartment / multifamily construction is in the pipeline within 1–3 miles? Heavy new supply (>2% of stock underway) typically softens rents 12–24 months out; light construction supports rent growth.
Investment metrics
- 1% rule
- 1.16% ✓
- Cap rate
- 5.58%
- Cash-on-cash
- -2.53%
- DSCR
- 0.89
- GRM
- 7.2
CMA / ARV
No comps found within radius.
Projected returns pro-forma
-3.0% appreciation · 0.6% rent growth · sell at horizon
- IRR
- -24.2%
- Equity multiple
- 0.20×
- Total profit
- $-43,435
- Equity at exit
- $28,777
- IRR
- -33.6%
- Equity multiple
- -0.23×
- Total profit
- $-66,301
- Equity at exit
- $16,687
Cash invested: $54,040 (down + closing). Projections, not guarantees.
Landlord ↔ Tenant lean methodology
- Overall (STATE)
- 87 Strongly Landlord-Friendly
- State Florida
- 87 Strongly Landlord-Friendly · R+3
- County
- — inherits STATE
- City
- — inherits STATE
ZIP-level market 33322
- Home prices YoY
- -33.3%
- Rents YoY
- 0.6%
- Active inventory
- 559
- Price-to-rent
- 7.2×
Monthly cashflow live
- Estimated rent
- $2,239 high interval (Pro) →
- Mortgage (P&I)
- −$1,012
- Tax from tax record
- −$125 /mo · $1,498/yr
- Insurance
- −$80
- HOA
- −$665
- Vacancy / Maint / Mgmt
- −$470
- Net cashflow
- $-114
Break-even live
UW: 25.0% down · 7.5% · 30yr · 1.5% tax · 5.0% vac · 8.0% maint · 8.0% mgmt
Financing live
Cash to close
- Down payment
- $48,250
- Closing costs
- $5,790
- Reserves months
- —
- Total cash needed
- —
Loan-product check · same deal, 3 products live
Conventional
25% down · 7.5% · 30yr
- Down + closing
- —
- Monthly P&I
- —
- Monthly cashflow
- —
- DSCR
- —
- Eligible?
- —
Personal DTI + credit; lowest rate.
DSCR
20% down · 8.5% · 30yr
- Down + closing
- —
- Monthly P&I
- —
- Monthly cashflow
- —
- DSCR
- —
- Eligible?
- —
No personal income docs; deal must DSCR.
Hard money
10% down · 12.0% · 12mo
- Down + closing
- —
- Monthly P&I
- —
- Monthly cashflow
- —
- DSCR
- —
- Eligible?
- —
Short-term bridge; refi at stabilization.
Rent comps 40 comps
| Address | Beds | Baths | Sqft | Rent | $/sqft | DOM | Units | Dist |
|---|---|---|---|---|---|---|---|---|
| 10758 NW 30th Pl Sunrise, FL | 2.0 | 2.0 | 1074 | $2,200 | $2.05 | 17d | 1 | 0.22mi |
| 2734 N Nob Hill Rd Sunrise, FL | 2.0 | 2.0 | 954 | $2,400 | $2.52 | 24d | 1 | 0.49mi |
| 9999 Summerbreeze Dr Sunrise, FL | 1.0–2.0 | 1.0–2.0 | 889 | $2,200 | $2.47 | 18d | 6 | 0.51mi |
| 9999 Summerbreeze Dr Sunrise, FL | 1.0–2.0 | 1.0–2.0 | 889 | $2,200 | $2.47 | 1d | 9 | 0.51mi |
| 9999 Summerbreeze Dr Sunrise, FL | 1.0–2.0 | 1.0–2.0 | 889 | $2,200 | $2.47 | 1d | 8 | 0.51mi |
| 9999 Summerbreeze Dr Sunrise, FL | 1.0–2.0 | 1.0–2.0 | 889 | $2,200 | $2.47 | 4d | 9 | 0.51mi |
| 2698 N Nob Hill Rd Sunrise, FL | 2.0 | 2.0 | 1008 | $2,275 | $2.26 | 24d | 1 | 0.53mi |
| 10053 Winding Lake Rd #101 Sunrise, FL | 2.0 | 2.0 | 760 | $2,000 | $2.63 | 7d | 1 | 0.56mi |
| 10050 Winding Lake Rd #103 Sunrise, FL | 2.0 | 2.0 | 760 | $1,750 | $2.30 | 24d | 1 | 0.58mi |
| 10046 Winding Lake Rd #204 Sunrise, FL | 2.0 | 1.0 | 760 | $1,800 | $2.37 | 24d | 1 | 0.58mi |
| 10054 Winding Lake Rd #201 Sunrise, FL | 2.0 | 2.0 | 760 | $2,200 | $2.89 | 20d | 1 | 0.59mi |
| 10054 Winding Lake Rd #201 Sunrise, FL | 2.0 | 2.0 | 760 | $2,200 | $2.89 | 3d | 1 | 0.59mi |
| 10039 Winding Lake Rd #202 Sunrise, FL | 2.0 | 2.0 | 760 | $2,000 | $2.63 | 22d | 1 | 0.59mi |
| 10039 Winding Lake Rd #202 Sunrise, FL | 2.0 | 2.0 | 760 | $2,000 | $2.63 | 24d | 1 | 0.59mi |
| 10002 Winding Lake Rd #101 Sunrise, FL | 2.0 | 2.0 | 760 | $1,900 | $2.50 | 24d | 1 | 0.61mi |
| 10005 Winding Lake Rd #204 Sunrise, FL | 2.0 | 2.0 | 772 | $1,800 | $2.33 | 24d | 1 | 0.61mi |
| 10003 Winding Lake Rd #103 Sunrise, FL | 2.0 | 2.0 | 772 | $1,850 | $2.40 | 7d | 1 | 0.63mi |
| 10003 Winding Lake Rd #103 Sunrise, FL | 2.0 | 2.0 | 772 | $1,900 | $2.46 | 24d | 1 | 0.63mi |
| 10016 Winding Lake Rd #202 Sunrise, FL | 2.0 | 2.0 | 760 | $2,100 | $2.76 | 24d | 1 | 0.64mi |
| 10025 Winding Lake Rd #202 Sunrise, FL | 2.0 | 2.0 | 760 | $1,700 | $2.24 | 24d | 1 | 0.67mi |
| 9994 Nob Hill Ct #9994 Sunrise, FL | 2.0 | 2.0 | 840 | $1,975 | $2.35 | 24d | 1 | 0.74mi |
| 3548 NW 111th Ter Sunrise, FL | 3.0 | 2.0 | 1024 | $2,675 | $2.61 | 20d | 1 | 0.74mi |
| 9982 Nob Hill Ct #9982 Sunrise, FL | 2.0 | 2.0 | 900 | $2,200 | $2.44 | 12d | 1 | 0.75mi |
| 9954 Nob Hill Ct #9954 Sunrise, FL | 2.0 | 2.0 | 900 | $1,900 | $2.11 | 24d | 1 | 0.77mi |
| 10931 NW 39th St Sunrise, FL | 1.0 | 1.0 | 902 | $2,001 | $2.22 | 16d | 1 | 0.77mi |
| 10931 NW 39th St Sunrise, FL | 1.0 | 1.0 | 902 | $2,099 | $2.33 | 20d | 1 | 0.77mi |
| 10931 NW 39th St Sunrise, FL | 1.0 | 1.0 | 902 | $2,054 | $2.28 | 2d | 1 | 0.77mi |
| 9926 Nob Hill Ct #9926 Sunrise, FL | 2.0 | 2.0 | 915 | $2,400 | $2.62 | 24d | 1 | 0.78mi |
| 10901 NW 40th St Sunrise, FL | 1.0–2.0 | 1.0–2.0 | 900 | $2,400 | $2.67 | 2d | 8 | 0.79mi |
| 9878 Nob Hill Ct #9878 Sunrise, FL | 2.0 | 2.0 | 900 | $2,100 | $2.33 | 12d | 1 | 0.81mi |
| 9878 Nob Hill Ct #9878 Sunrise, FL | 2.0 | 2.0 | 900 | $2,200 | $2.44 | 24d | 1 | 0.81mi |
| 9838 Nob Hill Ct #9838 Sunrise, FL | 2.0 | 2.0 | 840 | $1,950 | $2.32 | 14d | 1 | 0.83mi |
| 3621 NW 95th Ter #523 Sunrise, FL | 2.0 | 2.0 | 970 | $2,150 | $2.22 | 24d | 1 | 0.84mi |
| 9979 Nob Hill Ln Sunrise, FL | 2.0 | 2.0 | 986 | $2,100 | $2.13 | 18d | 1 | 0.84mi |
| 11197 NW 37th St Sunrise, FL | 2.0 | 2.0 | 936 | $2,650 | $2.83 | 24d | 1 | 0.84mi |
| 10000 Reflections Blvd Sunrise, FL | 1.0–2.0 | 1.0–2.5 | 964 | $2,695 | $2.80 | 2d | 31 | 0.86mi |
| 9943 Nob Hill Pl #9943 Sunrise, FL | 1.0 | 1.0 | 744 | $1,875 | $2.52 | 10d | 1 | 0.87mi |
| 9964 Nob Hill Pl #9964 Sunrise, FL | 2.0 | 2.0 | 986 | $2,100 | $2.13 | 24d | 1 | 0.87mi |
| 9823 Nob Hill Ct #9823 Sunrise, FL | 1.0 | 1.0 | 744 | $1,850 | $2.49 | 12d | 1 | 0.87mi |
| 9964 Nob Hill Pl #9964 Sunrise, FL | 2.0 | 2.0 | 986 | $2,000 | $2.03 | 7d | 1 | 0.87mi |
HOA detail condo
- Monthly dues
- $665 · $7,980/yr
- Likely covers
- poolgym
- Assessments
- None detected in remarks — confirm with the listing agent.
Listing history 28 events
-
2026-06-18days on market $193,000 Active 255 DOM
-
2026-06-17days on market $193,000 Active 254 DOM
-
2026-06-16days on market $193,000 Active 253 DOM
-
2026-06-15days on market $193,000 Active 252 DOM
-
2026-06-13days on market $193,000 Active 250 DOM
-
2026-06-09days on market $193,000 Active 246 DOM
-
2026-06-07days on market $193,000 Active 244 DOM
-
2026-06-04days on market $193,000 Active 241 DOM
-
2026-06-03days on market $193,000 Active 240 DOM
-
2026-06-02days on market $193,000 Active 239 DOM
-
2026-06-01days on market $193,000 Active 238 DOM
-
2026-05-31days on market $193,000 Active 237 DOM
-
2025-10-06$193,000 Active
-
2025-09-29historical
-
2025-05-30status Active
-
2025-05-02historical Active Under Contract
-
2025-03-31$193,000 Active
-
2024-12-31historical
-
2024-08-22price $205,000
-
2024-07-25price $214,000
-
2024-06-25$225,000 Active
-
2023-11-09soldstatus $129,000 Closed
-
2023-11-07soldstatus $129,000
-
2023-08-23status Pending
-
2023-08-22price $134,900
-
2023-08-02price $139,900
-
2023-06-21$155,000 Active
-
1982-09-01soldstatus $55,500
ⓘ Source: listings_history table (triggers on properties + properties_extension) + one-shot
backfill from property_details.listing_events for pre-trigger history.
Tax reassessment forecast FL · Resets to sale price
- Current annual tax
- $1,498 · $125/mo
- Projected year-2 tax
- $1,602 · $133/mo
- Expected delta
- +$103/yr (+$9/mo · 6.9%)
ⓘ Screening estimate from a state-policy table — verify with the county assessor before closing.
Nearby sold comps map
Loading sold comps map…
Walkable amenities ~0.75 mi
Loading nearby amenities…
Taxation est. · year 1
- Rental income
- $26,864
- − Mortgage interest
- −$10,811
- − Property taxes
- −$1,498
- − Insurance
- −$965
- − Repairs & maintenance
- −$2,149
- − Management
- −$2,149
- − HOA
- −$7,980
- − Depreciation
- −$5,615
- Taxable loss
- −$4,303
- Est. tax savings @ 24.0%
- +$1,033
- After-tax cash flow
- $-334/yr
For passive investors: Depreciation is non-cash, so a rental often shows a tax loss while cash-flowing — sheltering income. Rental losses are passive: they offset passive income freely, and up to $25,000/yr can offset ordinary (W-2) income if you actively participate and your MAGI is under $100k (phasing out to $0 by $150k); unused losses carry forward. On sale, claimed depreciation is recaptured at up to 25%, and gains may owe capital-gains tax (a 1031 exchange can defer both). Figures are a year-1 estimate at your 24.0% rate — not tax advice; consult a CPA.
Schools (NCES district)
- District
- Broward
- NCES district ID
- 1200180
- Math proficiency
- 42% ▼ -18.00%
- Reading proficiency
- 53% ▼ -5.00%
- Median HH income
- $52,139
- Composite
- 40.88/100
- National rank
- #3621
- State rank
- #46 of 73 in FL
Livability — Sunrise
- Score
- 83/100
- State rank
- #56
- US rank
- #986
Category grades
Schools grade is shown separately in the Schools card above.
Census & demographics
- Census place
- Sunrise, FL
- County
- Broward County · 1,963,430 people
- City population
- 77,492
- Metro
- Miami-Fort Lauderdale-Pompano Beach, FL
- Population (ZIP)
- 41,128
- Household income
- $71,755
- Rent vs Own
- Severe rent burden
- 931.0
Population outlook (Broward County) Hauer SSP2
- Today (2025)
- 2,207,033 people
- By 2030
- 2,360,704 · +7.0%
- By 2040
- 2,661,208 · +20.6%
- By 2050
- 2,946,698 · +33.5%
- By 2075
- 3,602,273 · +63.2%
- By 2100
- 3,970,984 · +79.9%
Race, ethnicity, and origin ACS 2023
- Neighborhood character
- Highly diverse neighborhood (Simpson 0.72)
- Race & ethnicity
- Hispanic / Latino 35% White 32% Black 24% Two or more races 22% Asian 4%
- Hispanic origin (detail)
- Puerto Rican 5% Cuban 6% Dominican 2% Salvadoran 1%
- Common ancestry
- Hispanic 5% Romanian 2% Scotch-Irish 2%
- Foreign-born
- 41% · Canada, Jamaica, South Korea
- Languages at home
- 58% English-only · Spanish 30% French/Haitian/Cajun 6% Other Indo-European 1%
Political lean MEDSL · Broward
- 2024 margin
- D (+17.0) · D 58.0% · R 41.0%
- 2008→2024 swing
- -17.8pp toward R · 2008: 34.7pp · 2024: 17.0pp
- All cycles
- 2024: D+17.0 2020: D+29.8 2016: D+35.0 2012: D+34.9 2008: D+34.7
Not yet ingested
- Civics
- —
Market trends
- HPI YoY
- ▼ -203.34%
- Current HPI
- 407.5452
- Rent YoY
- ▲ 0.60%
- Metro
- Miami-Fort Lauderdale-Pompano Beach, FL
- State GDP YoY
- ▲ 3.28%
- F500 in state
- 36
Industry mix (Fortune 500 HQ in FL)
| Industry | F500 HQs | Revenue |
|---|---|---|
| Industrial Technology | 2 | $29B |
|
||
| Insurance | 2 | $17B |
|
||
| Retail | 1 | $60B |
|
||
| Technology Distribution | 1 | $58B |
|
||
| Homebuilding | 1 | $35B |
|
||
| Technology Manufacturing | 1 | $35B |
|
||
Price history
+247.7% since first listed16 events — show timeline
- 2025-10-06 Listed $193,000 MARMLS
- 2025-09-29 Listing Removed — MARMLS
- 2025-05-30 Relisted — MARMLS
- 2025-05-02 Contingent — MARMLS
- 2025-03-31 Listed $193,000 MARMLS
- 2024-12-31 Listing Removed — MARMLS
- 2024-08-22 Price Changed $205,000 MARMLS
- 2024-07-25 Price Changed $214,000 MARMLS
- 2024-06-25 Listed $225,000 MARMLS
- 2023-11-09 Sold (MLS) $129,000 MARMLS
- 2023-11-07 Sold (Public Records) $129,000 Public Records
- 2023-08-23 Pending — MARMLS
- 2023-08-22 Price Changed $134,900 MARMLS
- 2023-08-02 Price Changed $139,900 MARMLS
- 2023-06-21 Listed $155,000 MARMLS
- 1982-09-01 Sold (Public Records) $55,500 Public Records
Property tax history
+16.5%/yrLatest (2025): $1,498 · -45.0% YoY. Source: county tax records.
Cash-flow waterfall
monthlySold comps — $/sqft
last 12 mo · ≤1 miLoading sold comps…