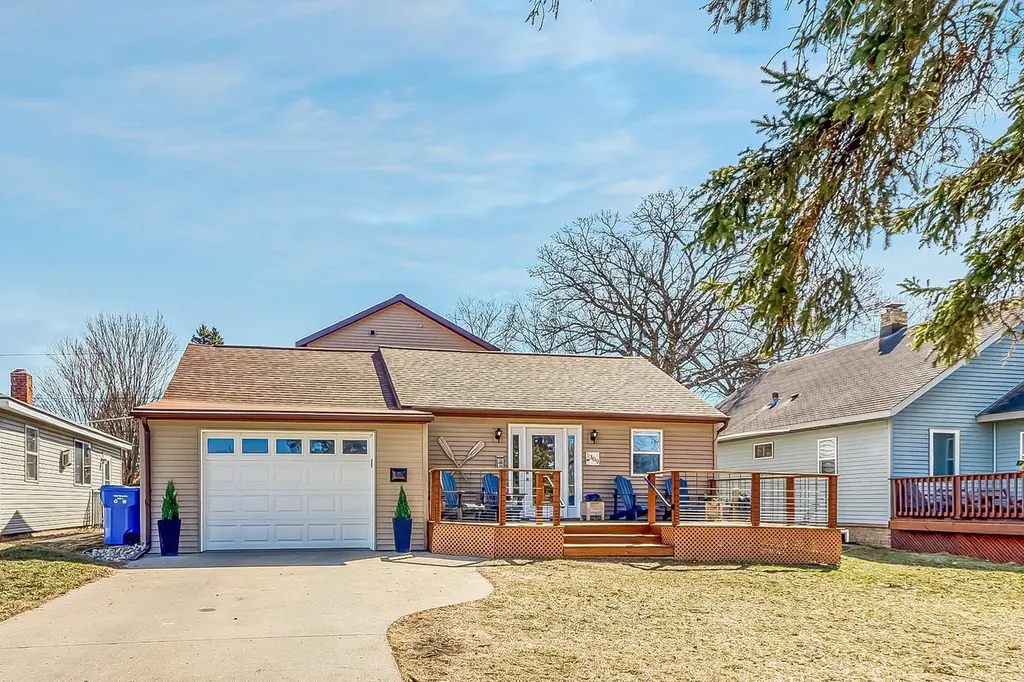
1309 Lincoln Ave · Detroit Lakes, MN
Flood risk 1/10 · Minimal
- FEMA flood zone
- X
- Chance of flooding over 30 yrs
- 0.0%
- Est. flood insurance / yr
- $473 – $860
Fire risk 5/10 · Moderate
- Est. fire insurance / yr
- $888 – $1,650
Heat risk 1/10 · Minimal
- Hot days now (above 96°F)
- 7 days/yr
- Hot days in 30 yrs
- 12 days/yr
Wind risk 1/10 · Minimal
- Chance of severe wind over 30 yrs
- —
Air-quality risk 2/10 · Minimal
- Unhealthy air days now
- 2 days/yr
- Unhealthy air days in 30 yrs
- 2 days/yr
Risk factors via First Street. Map © Google.
Why this score? — see what drove the D+ grade
The composite is a weighted blend of 9 inputs, each scored 0–100. Each bar is that input's sub-score; the figure is the points it added to the 100-point composite (weight × sub-score).
- Cash flow +18.7/30.0
- ARV discount +7.5/15.0
- DSCR +5.9/10.0
- 1% rule +4.2/10.0
- Schools +4.0/10.0
- Livability +4.0/5.0
- Rent growth +2.5/5.0
- Condition / age +2.5/5.0
- Appreciation +0.0/10.0
$289,000
🖨 Deal sheet (PDF) 📄 Offer letter ✓ Due diligence
Listing remarks
This completely updated 3-bedroom 2 bath home is ideally located within walking distance of everything Detroit Lakes has to offer - parks, the beach, shopping, and dining. No detail has been overlooked in this fully renovated property. A few to mention, include new flooring, lighting, appliances, cabinets, countertops, water heater, AC, furnace, and windows. A major highlight is the spacious living room and primary suite addition completed in 2020, providing comfort and extra living space. On the main floor you'll find beautifully updated kitchen, two bedrooms, bathroom and laundry with the expansive family room addition and gas burning fireplace - perfect for relaxing on those cold Minneso
Key facts
- Updated home
- 6,098 sq ft lot
- Garage
Tags
Neighborhood map
What this means for you Summary
Snapshot
- This is a 2-bed/2.0-bath single-family listed at $289k.
Deal economics
- At list price, monthly cash flow is $285 ($3k/yr) — positive.
- The deal already cash-flows at list — no discount required.
- To meet the 1% rule (rent ≥ 1% of price), the offer needs to be $265k (8.3% below list).
- Recommended offer: $265k (8.3% below list) — sets the bar for 1% rule.
- Cap rate 7.5% vs local median 5.3% in Detroit Lakes — top-decile yield for the area; either an underpriced asset or a hidden risk that comps aren't pricing in. Stress-test before assuming the spread holds.
Location & tenants
- Location reads 80/100 on livability (#78 in MN, #1,847 nationally) — a professional / high-income tenant draw. Strengths: housing A+, health & safety A+, cost of living A; Watch: amenities F, commute F.
- Detroit Lakes Public School District (town): math 44% / reading 50% proficiency, ranked #155 of 301 in MN (top 52%) — families likely to look elsewhere, expect single-tenant / working-renter base with shorter leases.
- Zoned schools: Rossman Elementary (math 64% / reading 55%, grade B-, #216 of 857 statewide, top 29%, 573 students, 40% FRL); Detroit Lakes Middle (math 29% / reading 42%, grade F, #172 of 258 statewide, top 68%, 596 students, 46% FRL); Detroit Lakes Senior High (math 52% / reading 57%, grade C-, #87 of 471 statewide, top 22%, 865 students, 37% FRL).
- Market conditions: 307 active listings in the ZIP; 156 units permitted in Becker County in 2024 (0 in 5+ unit buildings).
Forward outlook
- Local home prices are declining (-3.0%/yr); year-one equity from $2k of loan paydown is wiped out by about $9k of value loss. Plan a longer hold.
- Becker County population projected at +4% by 2050 — modest demand growth; plan on rents tracking national, not racing it.
Negotiation context
- Only 11 days on market — expect competitive offers; lowballing is unlikely to land.
- Current owner paid $96k; list at $289k implies a 203% gain — meaningful room to come down on a strong offer.
Risks & watch-outs
- Watch-outs: built in 1940 — expect roof / HVAC / electrical / plumbing capex.
- Climate carrying-cost: moderate wildfire risk — expect insurance premiums to compound above CPI over the hold.
Questions for the listing agent
- Built in 1940 — when were the roof, HVAC, electrical panel, plumbing, and water heater last replaced?
- Is there a deadline driving the sale (1031 exchange, divorce, estate, relocation)? That informs how much negotiation room exists.
- Schools are B-rated — typically a magnet for longer-tenancy family renters. What's the average tenant stay here, and is there a school-zone premium baked into asking?
- The area grade is low — what's the realistic commute time and amenity access for the typical tenant pool here? Any planned neighborhood developments (good or bad) we should know about?
- What's the average days-on-market for RENTAL listings here right now (not sales)? A rising rental-DOM trend means longer vacancies and softer asking-rent achievability than the comps imply.
- What's the recent tenant-quality profile in this submarket — average credit score on applications, eviction rate, late-payment / NSF rate, and stable-employment percentage? A property-management company in the area should have these aggregated.
- How much new for-sale + rental construction is in the pipeline within 1–3 miles? Heavy new supply typically softens prices + rents 12–24 months out; constrained supply supports both.
Investment metrics
- 1% rule
- 0.92% ✗
- Cap rate
- 7.48%
- Cash-on-cash
- 4.23%
- DSCR
- 1.19
- GRM
- 9.1
CMA / ARV
No comps found within radius.
Projected returns pro-forma
-3.0% appreciation · 3.0% rent growth · sell at horizon
- IRR
- -9.7%
- Equity multiple
- 0.64×
- Total profit
- $-28,740
- Equity at exit
- $43,091
- IRR
- -0.3%
- Equity multiple
- 0.98×
- Total profit
- $-1,944
- Equity at exit
- $24,987
Cash invested: $80,920 (down + closing). Projections, not guarantees.
Landlord ↔ Tenant lean methodology
- Overall (STATE)
- 46 Balanced
- State Minnesota
- 46 Balanced · D+2
- County
- — inherits STATE
- City
- — inherits STATE
ZIP-level market 56501
- Active inventory
- 307
- Price-to-rent
- 9.1×
Monthly cashflow live
- Estimated rent
- $2,649 medium interval (Pro) →
- Mortgage (P&I)
- −$1,516
- Tax from tax record
- −$172 /mo · $2,060/yr
- Insurance
- −$120
- HOA
- −$0
- Lot rent
- −$0
- Vacancy / Maint / Mgmt
- −$556
- Net cashflow
- $285
Break-even live
Sensitivity live
| Price | -10% $449 | -5% $367 | +0% $285 | +5% $203 | +10% $122 |
|---|---|---|---|---|---|
| Rent | -10% $76 | -5% $181 | +0% $285 | +5% $390 | +10% $495 |
| Rate | -1.0pp $431 | -0.5pp $359 | base $285 | +0.5pp $210 | +1.0pp $134 |
UW: 25.0% down · 7.5% · 30yr · 1.5% tax · 5.0% vac · 8.0% maint · 8.0% mgmt
Financing live
Cash to close
- Down payment
- $72,250
- Closing costs
- $8,670
- Reserves months
- —
- Total cash needed
- —
Loan-product check · same deal, 3 products live
Conventional
25% down · 7.5% · 30yr
- Down + closing
- —
- Monthly P&I
- —
- Monthly cashflow
- —
- DSCR
- —
- Eligible?
- —
Personal DTI + credit; lowest rate.
DSCR
20% down · 8.5% · 30yr
- Down + closing
- —
- Monthly P&I
- —
- Monthly cashflow
- —
- DSCR
- —
- Eligible?
- —
No personal income docs; deal must DSCR.
Hard money
10% down · 12.0% · 12mo
- Down + closing
- —
- Monthly P&I
- —
- Monthly cashflow
- —
- DSCR
- —
- Eligible?
- —
Short-term bridge; refi at stabilization.
Listing history 5 events
-
2026-04-27status Pending
-
2026-04-20historical Contingent - Subject to Financing
-
2026-04-16$289,000 Active
-
2016-03-17soldstatus $95,500
-
2005-11-17soldstatus $40,000
ⓘ Source: listings_history table (triggers on properties + properties_extension) + one-shot
backfill from property_details.listing_events for pre-trigger history.
Tax reassessment forecast MN · Partial reset (capped growth)
- Current annual tax
- $2,060 · $172/mo
- Projected year-2 tax
- $2,648 · $221/mo
- Expected delta
- +$588/yr (+$49/mo · 28.6%)
ⓘ Screening estimate from a state-policy table — verify with the county assessor before closing.
Climate risk First Street
- Flood 1/10 Low FEMA zone X · 0% chance over 30 yrs
- Wildfire 5/10 Major
- Heat 1/10 Low 7 d/yr ≥96°F today · 12 d/yr by 30 yrs out
- Wind 1/10 Low
- Air quality 2/10 Low 2 unhealthy d/yr today · 2 by 30 yrs out
Nearby sold comps map
Loading sold comps map…
Walkable amenities ~0.75 mi
Loading nearby amenities…
Taxation est. · year 1
- Rental income
- $31,790
- − Mortgage interest
- −$16,188
- − Property taxes
- −$2,060
- − Insurance
- −$1,445
- − Repairs & maintenance
- −$2,543
- − Management
- −$2,543
- − Depreciation
- −$8,407
- Taxable loss
- −$1,397
- Est. tax savings @ 24.0%
- +$335
- After-tax cash flow
- $3,758/yr
For passive investors: Depreciation is non-cash, so a rental often shows a tax loss while cash-flowing — sheltering income. Rental losses are passive: they offset passive income freely, and up to $25,000/yr can offset ordinary (W-2) income if you actively participate and your MAGI is under $100k (phasing out to $0 by $150k); unused losses carry forward. On sale, claimed depreciation is recaptured at up to 25%, and gains may owe capital-gains tax (a 1031 exchange can defer both). Figures are a year-1 estimate at your 24.0% rate — not tax advice; consult a CPA.
Schools (NCES district)
- District
- Detroit Lakes Public School District
- NCES district ID
- 2710230
- Math proficiency
- 44% ▼ -11.00%
- Reading proficiency
- 50% ▼ -11.00%
- Median HH income
- $50,571
- Composite
- 40.33/100
- National rank
- #3746
- State rank
- #155 of 301 in MN
Livability — Detroit Lakes
- Score
- 80/100
- State rank
- #78
- US rank
- #1847
Category grades
Schools grade is shown separately in the Schools card above.
Census & demographics
- Census place
- Detroit Lakes, MN
- City population
- 18,239
- Population (ZIP)
- 18,239
Population outlook (Becker County) Hauer SSP2
- Today (2025)
- 34,604 people
- By 2030
- 35,095 · +1.4%
- By 2040
- 35,691 · +3.1%
- By 2050
- 35,869 · +3.7%
- By 2075
- 36,103 · +4.3%
- By 2100
- 32,798 · -5.2%
Race, ethnicity, and origin ACS 2023
- Neighborhood character
- Predominantly White (91%)
- Race & ethnicity
- White 91% Two or more races 5% Native American 2%
- Common ancestry
- Portuguese 25% Scottish 4% Lithuanian 3%
- Foreign-born
- 1% · Canada
- Languages at home
- 98% English-only · Spanish 1%
Political lean MEDSL · Becker
- 2024 margin
- Solid R (+33.1) · D 32.7% · R 65.8% · Other 1.5%
- 2008→2024 swing
- -26.3pp toward R · 2008: -6.9pp · 2024: -33.1pp
- All cycles
- 2024: R+33.1 2020: R+30.1 2016: R+33.2 2012: R+14.6 2008: R+6.9
Not yet ingested
- Civics
- —
Market trends
- HPI YoY
- ▼ -222.40%
- Current HPI
- 217.4973
- Rent YoY
- —
- Metro
- —
- State GDP YoY
- ▲ 2.41%
- F500 in state
- 34
Industry mix (Fortune 500 HQ in MN)
| Industry | F500 HQs | Revenue |
|---|---|---|
| Healthcare | 2 | $407B |
|
||
| Retail | 2 | $150B |
|
||
| Consumer Goods | 2 | $32B |
|
||
| Industrial Machinery | 2 | $6B |
|
||
| Agriculture | 1 | $40B |
|
||
| Healthcare / Medical Devices | 1 | $32B |
|
||
Price history
+622.5% since first listed5 events — show timeline
- 2026-04-27 Pending — NORTHSTARMLS as Distributed by MLS Grid
- 2026-04-20 Contingent — NORTHSTARMLS as Distributed by MLS Grid
- 2026-04-16 Listed $289,000 NORTHSTARMLS as Distributed by MLS Grid
- 2016-03-17 Sold (Public Records) $95,500 Public Records
- 2005-11-17 Sold (Public Records) $40,000 Public Records
Property tax history
+3.4%/yrLatest (2025): $2,060 · -8.7% YoY. Source: county tax records.
Cash-flow waterfall
monthlySold comps — $/sqft
last 12 mo · ≤1 miLoading sold comps…