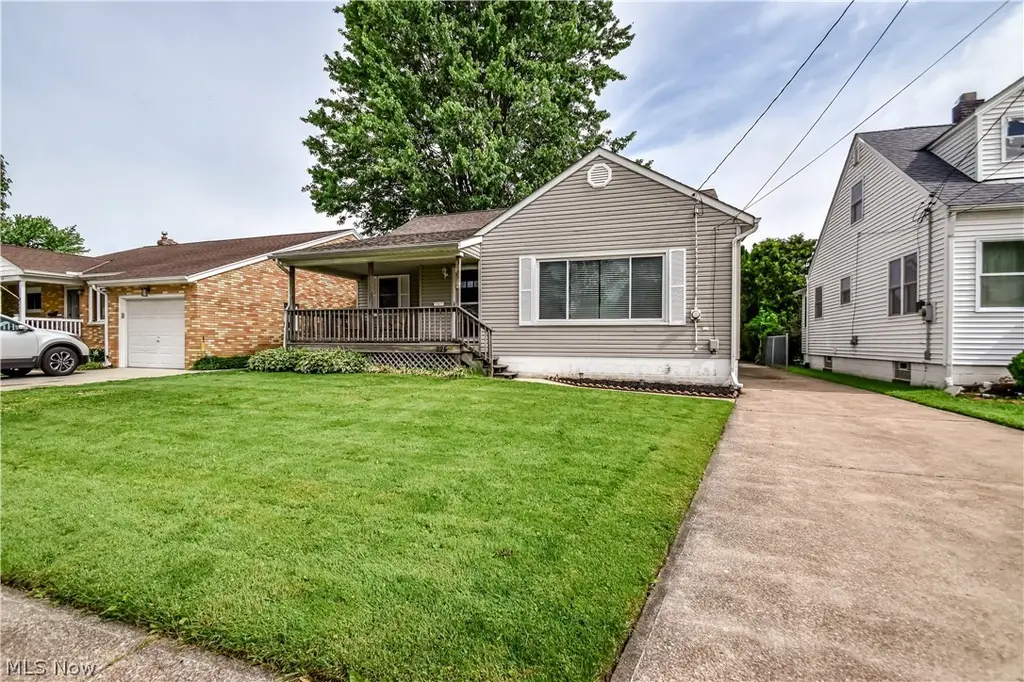
225 Burton St · Fairport Harbor, OH
Flood risk 1/10 · Minimal
- FEMA flood zone
- X (unshaded)
- Chance of flooding over 30 yrs
- 0.0%
- Est. flood insurance / yr
- $473 – $860
Fire risk 1/10 · Minimal
- Est. fire insurance / yr
- $713 – $1,323
Heat risk 3/10 · Minor
- Hot days now (above 94°F)
- 7 days/yr
- Hot days in 30 yrs
- 18 days/yr
Wind risk 1/10 · Minimal
- Chance of severe wind over 30 yrs
- —
Air-quality risk 4/10 · Minor
- Unhealthy air days now
- 4 days/yr
- Unhealthy air days in 30 yrs
- 5 days/yr
Risk factors via First Street. Map © Google.
Why this score? — see what drove the D grade
The composite is a weighted blend of 9 inputs, each scored 0–100. Each bar is that input's sub-score; the figure is the points it added to the 100-point composite (weight × sub-score).
- Cash flow +14.1/30.0
- ARV discount +7.9/15.0
- DSCR +4.3/10.0
- 1% rule +4.1/10.0
- Livability +3.6/5.0
- Rent growth +3.4/5.0
- Schools +3.0/10.0
- Condition / age +2.5/5.0
- Appreciation +0.0/10.0
$194,900
🖨 Deal sheet (PDF) 📄 Offer letter ✓ Due diligence
Listing remarks MLS
Immaculate Condition In Area Of Nice Homes. Extra Room Is Bedroom In Basement.
Key facts
- Vinyl flooring
- Gas fireplace
- Wooden crown molding
Tags
Property features AI
Finance
- Other: Home warranty included
Exterior
- Parking: Detached garage with 1 garage space; Driveway; Garage door opener; Paved parking
- Security: Smoke detectors
- Utilities: Public water; Public sewer
- Home design: Two-story home; Vinyl siding; Entry level includes primary bedroom; Shingle (asphalt/fiberglass) roof
- Construction: Built per public records; Concrete perimeter and block foundation; Vinyl siding construction
- Exterior features: Front porch; Basement (full, unfinished) with storage space; Lot dimensions approximately 50 x 120
Interior
- Kitchen: Range; Refrigerator
- Bedrooms: 2 main level bedrooms
- Bathrooms: 2 full bathrooms; 1 main level bathroom
- Heating & cooling: Gas heating; Hot water / steam heating; Ceiling fans; Window air conditioning units
- Interior features: Built-in bookcases; Ceiling fans; Crown molding; Laminate countertops; Natural woodwork; Primary bedroom on main level
- Laundry & utility: Washer hookup; Electric dryer hookup; Laundry room located in basement / lower level
Neighborhood map
What this means for you Summary
Snapshot
- This is a 4-bed/2.0-bath single-family listed at $195k.
Deal economics
- At list price, monthly cash flow is $29 ($345/yr) — positive.
- The deal already cash-flows at list — no discount required.
- To meet the 1% rule (rent ≥ 1% of price), the offer needs to be $178k (8.7% below list).
- Recommended offer: $178k (8.7% below list) — sets the bar for 1% rule.
Location & tenants
- Location reads 71/100 on livability (#446 in OH) — a middle-class / working-renter tenant base. Strengths: crime A+, cost of living A+, housing A+; Watch: employment C-, health & safety D, amenities F.
- Fairport Harbor Exempted Village (suburban): math 26% / reading 45% proficiency, ranked #558 of 656 in OH (top 85%) — families likely to look elsewhere, expect single-tenant / working-renter base with shorter leases.
- Zoned schools: Mckinley Elementary School (math 27% / reading 52%, grade F, #1,055 of 1,584 statewide, top 68%, 269 students, 57% FRL); Fairport Harding High School (math 22% / reading 42%, grade F, #607 of 781 statewide, top 78%, 349 students, 39% FRL).
- Market conditions: Rents rising (+3.7%/yr); 275 active listings in the ZIP; solid renter incomes; 448 units permitted in Lake County in 2024 (0 in 5+ unit buildings).
Forward outlook
- Local home prices are declining (-3.0%/yr); year-one equity from $1k of loan paydown is wiped out by about $6k of value loss. Plan a longer hold.
- Lake County population projected to shrink 8% by 2050 — rents likely to lag national; underwrite the cash flow, not the appreciation.
Negotiation context
- It's been on market 23 days — a 2% lower offer ($192k) is reasonable based on typical stale-listing flexibility.
- 2 sale attempts since 34y ago with the ask held roughly flat each time — persistent listings suggest the price (not the market) is what's stuck; bring a comps-based counter.
- Current owner paid $110k; list at $195k implies a 77% gain — meaningful room to come down on a strong offer.
Questions for the listing agent
- Built in 1967 — when were the roof, HVAC, electrical panel, plumbing, and water heater last replaced?
- Is there a deadline driving the sale (1031 exchange, divorce, estate, relocation)? That informs how much negotiation room exists.
- Schools are B-rated — typically a magnet for longer-tenancy family renters. What's the average tenant stay here, and is there a school-zone premium baked into asking?
- The area grade is low — what's the realistic commute time and amenity access for the typical tenant pool here? Any planned neighborhood developments (good or bad) we should know about?
- What's the average days-on-market for RENTAL listings here right now (not sales)? A rising rental-DOM trend means longer vacancies and softer asking-rent achievability than the comps imply.
- What's the recent tenant-quality profile in this submarket — average credit score on applications, eviction rate, late-payment / NSF rate, and stable-employment percentage? A property-management company in the area should have these aggregated.
- How much new for-sale + rental construction is in the pipeline within 1–3 miles? Heavy new supply typically softens prices + rents 12–24 months out; constrained supply supports both.
Investment metrics
- 1% rule
- 0.91% ✗
- Cap rate
- 6.47%
- Cash-on-cash
- 0.63%
- DSCR
- 1.03
- GRM
- 9.1
CMA / ARV
- ARV (on-the-fly)
- $196,560
- Comps found
- 10
Show comp detail 10 sales within ~0.75 mi
| Address | Dist | Beds/Ba | Sqft | Sold | Price | $/sf | Match |
|---|---|---|---|---|---|---|---|
| 410 Courtland St | 0.16mi | 3/1.5 (-1) | 1,388 (-1%) | 9mo | $179,500 | $129 | 76 |
| 223 King St | 0.10mi | 3/2.0 (-1) | 1,362 (-3%) | 15mo | $191,050 | $140 | 73 |
| 311 6th St | 0.39mi | 3/2.5 (-1) | 1,350 (-4%) | 2mo | $205,000 | $152 | 66 |
| 226 Orchard St | 0.04mi | 3/2.0 (-1) | 1,288 (-8%) | 22mo | $149,000 | $116 | 61 |
| 506 6th St | 0.42mi | 3/2.0 (-1) | 1,420 (+1%) | 22mo | $214,900 | $151 | 56 |
| 536 Independence St | 0.51mi | 3/2.0 (-1) | 1,248 (-11%) | 2mo | $220,000 | $176 | 51 |
| 543 6th St | 0.48mi | 3/2.0 (-1) | 1,224 (-13%) | 0mo | $205,000 | $167 | 51 |
| 429 Eagle St | 0.54mi | 3/1.0 (-1) | 1,496 (+7%) | 8mo | $207,000 | $138 | 48 |
| 425 5th St | 0.52mi | 3/1.5 (-1) | 1,557 (+11%) | 20mo | $208,500 | $134 | 34 |
| 617 New 4th St | 0.69mi | 3/1.0 (-1) | 1,238 (-12%) | 14mo | $148,000 | $120 | 28 |
Match score weights: distance 35% · size 25% · config 20% · recency 20%. Top-matched comps best support the ARV.
Projected returns pro-forma
-3.0% appreciation · 3.68% rent growth · sell at horizon
- IRR
- -14.5%
- Equity multiple
- 0.48×
- Total profit
- $-28,479
- Equity at exit
- $29,060
- IRR
- -4.6%
- Equity multiple
- 0.69×
- Total profit
- $-17,152
- Equity at exit
- $16,851
Cash invested: $54,572 (down + closing). Projections, not guarantees.
Landlord ↔ Tenant lean methodology
- Overall (STATE)
- 73 Landlord-Friendly
- State Ohio
- 73 Landlord-Friendly · R+6
- County
- — inherits STATE
- City
- — inherits STATE
ZIP-level market 44077
- Rents YoY
- 3.7%
- Active inventory
- 275
- Price-to-rent
- 9.1×
Monthly cashflow live
- Estimated rent
- $1,780 medium interval (Pro) →
- Mortgage (P&I)
- −$1,022
- Tax from tax record
- −$274 /mo · $3,293/yr
- Insurance
- −$81
- HOA
- −$0
- Vacancy / Maint / Mgmt
- −$374
- Net cashflow
- $29
Break-even live
Sensitivity live
| Price | -10% $139 | -5% $84 | +0% $29 | +5% $-26 | +10% $-82 |
|---|---|---|---|---|---|
| Rent | -10% $-112 | -5% $-42 | +0% $29 | +5% $99 | +10% $169 |
| Rate | -1.0pp $127 | -0.5pp $78 | base $29 | +0.5pp $-22 | +1.0pp $-73 |
UW: 25.0% down · 7.5% · 30yr · 1.5% tax · 5.0% vac · 8.0% maint · 8.0% mgmt
Financing live
Cash to close
- Down payment
- $48,725
- Closing costs
- $5,847
- Reserves months
- —
- Total cash needed
- —
Loan-product check · same deal, 3 products live
Conventional
25% down · 7.5% · 30yr
- Down + closing
- —
- Monthly P&I
- —
- Monthly cashflow
- —
- DSCR
- —
- Eligible?
- —
Personal DTI + credit; lowest rate.
DSCR
20% down · 8.5% · 30yr
- Down + closing
- —
- Monthly P&I
- —
- Monthly cashflow
- —
- DSCR
- —
- Eligible?
- —
No personal income docs; deal must DSCR.
Hard money
10% down · 12.0% · 12mo
- Down + closing
- —
- Monthly P&I
- —
- Monthly cashflow
- —
- DSCR
- —
- Eligible?
- —
Short-term bridge; refi at stabilization.
Listing history 20 events
-
2026-06-17status $194,900 Pending 23 DOM
-
2026-06-17days on market $194,900 Contingent 23 DOM
-
2026-06-16days on market $194,900 Contingent 22 DOM
-
2026-06-15days on market $194,900 Contingent 21 DOM
-
2026-06-13days on market $194,900 Contingent 19 DOM
-
2026-06-13days on market $194,900 Contingent 18 DOM
-
2026-06-09days on market $194,900 Contingent 15 DOM
-
2026-06-08days on market $194,900 Contingent 14 DOM
-
2026-06-07days on market $194,900 Contingent 13 DOM
-
2026-06-05statusdays on market $194,900 Contingent 10 DOM
-
2026-06-03days on market $194,900 Active 9 DOM
-
2026-06-02days on market $194,900 Active 8 DOM
-
2026-06-01days on market $194,900 Active 7 DOM
-
2026-05-31days on market $194,900 Active 6 DOM
-
2026-05-25$194,900 Active
-
2009-11-02soldstatus $109,900
-
1992-08-21soldstatus $77,500 78-char remark
Show marketing remark (78 chars)
Immaculate Condition In Area Of Nice Homes. Extra Room Is Bedroom In Basement.
-
1992-08-21soldstatus $77,500
Show marketing remark (78 chars)
Immaculate Condition In Area Of Nice Homes. Extra Room Is Bedroom In Basement.
-
1992-06-01$77,500 78-char remark
Show marketing remark (78 chars)
Immaculate Condition In Area Of Nice Homes. Extra Room Is Bedroom In Basement.
-
1985-11-22soldstatus $57,000
ⓘ Source: listings_history table (triggers on properties + properties_extension) + one-shot
backfill from property_details.listing_events for pre-trigger history.
Tax reassessment forecast OH · Partial reset (capped growth)
- Current annual tax
- $3,293 · $274/mo
- Projected year-2 tax
- $3,293 · $274/mo
- Expected delta
- $0/yr ($0/mo · 0.0%)
ⓘ Screening estimate from a state-policy table — verify with the county assessor before closing.
Climate risk First Street
- Flood 1/10 Low FEMA zone X (unshaded) · 0% chance over 30 yrs
- Wildfire 1/10 Low
- Heat 3/10 Moderate 7 d/yr ≥94°F today · 18 d/yr by 30 yrs out
- Wind 1/10 Low
- Air quality 4/10 Moderate 4 unhealthy d/yr today · 5 by 30 yrs out
Nearby sold comps map
Loading sold comps map…
Walkable amenities ~0.75 mi
Loading nearby amenities…
Taxation est. · year 1
- Rental income
- $21,364
- − Mortgage interest
- −$10,917
- − Property taxes
- −$3,293
- − Insurance
- −$974
- − Repairs & maintenance
- −$1,709
- − Management
- −$1,709
- − Depreciation
- −$5,670
- Taxable loss
- −$2,909
- Est. tax savings @ 24.0%
- +$698
- After-tax cash flow
- $1,043/yr
For passive investors: Depreciation is non-cash, so a rental often shows a tax loss while cash-flowing — sheltering income. Rental losses are passive: they offset passive income freely, and up to $25,000/yr can offset ordinary (W-2) income if you actively participate and your MAGI is under $100k (phasing out to $0 by $150k); unused losses carry forward. On sale, claimed depreciation is recaptured at up to 25%, and gains may owe capital-gains tax (a 1031 exchange can defer both). Figures are a year-1 estimate at your 24.0% rate — not tax advice; consult a CPA.
Schools (NCES district)
- District
- Fairport Harbor Exempted Village
- NCES district ID
- 3904536
- Math proficiency
- 26% ▼ -16.00%
- Reading proficiency
- 45% ▼ -13.00%
- Median HH income
- $46,266
- Composite
- 30.33/100
- National rank
- #6270
- State rank
- #558 of 656 in OH
Livability — Fairport Harbor
- Score
- 71/100
- State rank
- #446
- US rank
- #7313
Category grades
Schools grade is shown separately in the Schools card above.
Census & demographics
- Census place
- Fairport Harbor, OH
- County
- Lake County · 204,927 people
- Metro
- Cleveland-Elyria, OH
- Population (ZIP)
- 57,325
- Household income
- $85,056
- Rent vs Own
- Severe rent burden
- 1333.0
Population outlook (Lake County) Hauer SSP2
- Today (2025)
- 230,022 people
- By 2030
- 228,151 · -0.8%
- By 2040
- 221,018 · -3.9%
- By 2050
- 212,754 · -7.5%
- By 2075
- 200,309 · -12.9%
- By 2100
- 183,315 · -20.3%
Race, ethnicity, and origin ACS 2023
- Neighborhood character
- Predominantly White (78%)
- Race & ethnicity
- White 78% Hispanic / Latino 12% Two or more races 7% Black 5% Asian 1%
- Hispanic origin (detail)
- Mexican 7% Puerto Rican 3%
- Common ancestry
- Romanian 6% Lithuanian 2% Slovak 2%
- Foreign-born
- 6% · Canada, China
- Languages at home
- 88% English-only · Spanish 9% Russian/Polish/Slavic 1% Other Indo-European 1%
Political lean MEDSL · Lake
- 2024 margin
- R (+14.3) · D 42.4% · R 56.7%
- 2008→2024 swing
- -15.2pp toward R · 2008: 0.8pp · 2024: -14.3pp
- All cycles
- 2024: R+14.3 2020: R+13.6 2016: R+15.6 2012: R+1.7 2008: D+0.8
Not yet ingested
- Civics
- —
Market trends
- HPI YoY
- ▼ -183.05%
- Current HPI
- 181.2976
- Rent YoY
- ▲ 3.68%
- Metro
- Cleveland-Elyria, OH
- State GDP YoY
- ▲ 1.98%
- F500 in state
- 48
Industry mix (Fortune 500 HQ in OH)
| Industry | F500 HQs | Revenue |
|---|---|---|
| Insurance | 3 | $145B |
|
||
| Industrial Machinery | 3 | $49B |
|
||
| Financial Services | 3 | $24B |
|
||
| Consumer Goods | 2 | $93B |
|
||
| Aerospace / Defense | 2 | $47B |
|
||
| Utilities | 2 | $33B |
|
||
Price history
+241.9% since first listed6 events — show timeline
- 2026-05-25 Listed $194,900 MLSNOW
- 2009-11-02 Sold (Public Records) $109,900 Public Records
- 1992-08-21 Sold (Public Records) $77,500 Public Records
- 1992-08-21 Sold (MLS) $77,500 MLSNOW
- 1992-06-01 Listed $77,500 MLSNOW
- 1985-11-22 Sold (Public Records) $57,000 Public Records
Property tax history
+4.1%/yrLatest (2025): $3,293 · +2.1% YoY. Source: county tax records.
Cash-flow waterfall
monthlySold comps — $/sqft
last 12 mo · ≤1 miLoading sold comps…