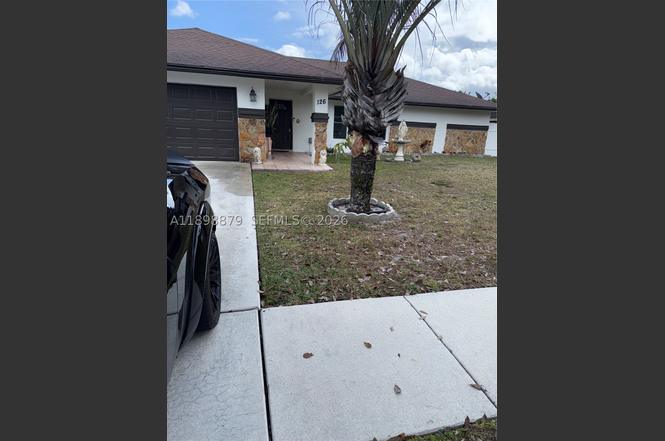
126 Sunflower Cir · Royal Palm Beach, FL
Flood risk 1/10 · Minimal
- FEMA flood zone
- X (unshaded)
- Chance of flooding over 30 yrs
- 0.0%
- Est. flood insurance / yr
- $507 – $1,088
Fire risk 2/10 · Minimal
- Est. fire insurance / yr
- $947 – $1,759
Heat risk 9/10 · Severe
- Hot days now (above 107°F)
- 7 days/yr
- Hot days in 30 yrs
- 25 days/yr
Wind risk 10/10 · Severe
- Chance of severe wind over 30 yrs
- 99.0%
Air-quality risk 2/10 · Minimal
- Unhealthy air days now
- 0 days/yr
- Unhealthy air days in 30 yrs
- 1 days/yr
Risk factors via First Street. Map © Google.
Why this score? — see what drove the D grade
The composite is a weighted blend of 9 inputs, each scored 0–100. Each bar is that input's sub-score; the figure is the points it added to the 100-point composite (weight × sub-score).
- Appreciation +10.0/10.0
- ARV discount +7.5/15.0
- Cash flow +6.7/30.0
- Schools +4.3/10.0
- Livability +4.0/5.0
- Rent growth +2.7/5.0
- Condition / age +2.5/5.0
- 1% rule +1.6/10.0
- DSCR +1.0/10.0
$590,000
🖨 Deal sheet 📄 Offer letter ✓ Due diligence
Listing remarks MLS
Bank owned! 4 bedroom home with great floorplan! Separate family room, 2 car garage, and large screened patio overlooking beautiful yard with preferred East exposure! Bank addendum will be given upon acceptance of an offer.
Key facts
- Full impact windows
- No hoa
- 0.23 acre lot
Tags
Property features AI
Finance
- Financial info: No pet restrictions
Exterior
- Parking: Attached covered garage with 2 spaces; Driveway; Garage door opener
- Security: Security/high impact doors; Smoke detector(s)
- Utilities: Public water; Public sewer; Cable available
- Home design: Single-story; Faces west; Slab foundation
- Construction: Block construction; Shingle roof; Effective year built
- Exterior features: Enclosed porch; Screened porch; Fence; Fruit trees; Room for pool; Above-ground pool
Interior
- Kitchen: Built-in oven; Electric range; Microwave; Dishwasher; Disposal; Icemaker
- Flooring: Ceramic tile
- Bathrooms: 2 full bathrooms
- Heating & cooling: Central heating (electric); Central air; Ceiling fan(s)
- Interior features: First floor entry; Pantry; Walk-in closet(s); Family room
- Laundry & utility: Washer hookup; Dryer hookup; Electric water heater
Neighborhood map
What this means for you Summary
Snapshot
- This is a 4-bed/2.0-bath single-family listed at $590k.
Deal economics
- At list price, monthly cash flow is $-941 ($-11k/yr) — negative.
- To cash-flow at today's rent, offer at most $424k (28.2% below list).
- To meet the 1% rule (rent ≥ 1% of price), the offer needs to be $392k (33.6% below list).
- Recommended offer: $392k (33.6% below list) — sets the bar for 1% rule.
Location & tenants
- Location reads 79/100 on livability (#135 in FL, #2,039 nationally) — a middle-class / working-renter tenant base. Strengths: employment A+, housing A+, health & safety A+; Watch: cost of living C-, amenities F, commute F.
- Palm Beach (suburban): math 46% / reading 53% proficiency, ranked #34 of 73 in FL (top 47%) — families likely to look elsewhere, expect single-tenant / working-renter base with shorter leases.
- Market conditions: Rents flat; 574 active listings in the ZIP; 17 comparable units currently listed for rent nearby; rentals at typical pace (median 22d on market — plan ~3-4 weeks tenant-placement turnaround); solid renter incomes; 3,974 units permitted in Palm Beach County in 2024 (1,012 in 5+ unit buildings).
- At $3,918/mo this rent would consume 51% of the median local household income ($93k/yr) (locally 1870% of renters already pay >50% of income on rent) — very limited rent-growth headroom before tenants either downsize or default.
Forward outlook
- In year one you build about $63k of equity ($4k loan paydown + $59k appreciation (10.0% local appreciation)).
- Palm Beach County population projected at +30% by 2050 — long-run rental-demand tailwind backs the buy-and-hold thesis.
- By year 2, paydown + projected appreciation supports a ~$101k cash-out refi (75% LTV) — recoverable capital for the next deal without selling this one.
Negotiation context
- It's been on market 242 days — a 12% lower offer ($519k) is reasonable based on typical stale-listing flexibility.
- 4 sale attempts since 18y ago with the ask held roughly flat each time — persistent listings suggest the price (not the market) is what's stuck; bring a comps-based counter.
- Current owner paid $160k; list at $590k implies a 269% gain — meaningful room to come down on a strong offer.
Risks & watch-outs
- Climate carrying-cost: severe wind risk, 99% chance of damaging wind over 30y; extreme-heat days projected 7→25/yr by 2055 (HVAC capex compounding) — expect insurance premiums to compound above CPI over the hold.
Questions for the listing agent
- What do current leases actually rent for vs. the listed asking? Can we see a recent rent roll and the last 12 months of T-12 income?
- It's been on market 242 days. Have you received any prior offers? Is the seller open to a 34% concession, seller financing, or rate buy-down credit?
- Why hasn't it sold? Are there any deal-killer items the seller is aware of (foundation, flood, title, zoning, code violations)?
- Is there a deadline driving the sale (1031 exchange, divorce, estate, relocation)? That informs how much negotiation room exists.
- Schools are B-rated — typically a magnet for longer-tenancy family renters. What's the average tenant stay here, and is there a school-zone premium baked into asking?
- The area grade is low — what's the realistic commute time and amenity access for the typical tenant pool here? Any planned neighborhood developments (good or bad) we should know about?
- What's the average days-on-market for RENTAL listings here right now (not sales)? A rising rental-DOM trend means longer vacancies and softer asking-rent achievability than the comps imply.
- What's the recent tenant-quality profile in this submarket — average credit score on applications, eviction rate, late-payment / NSF rate, and stable-employment percentage? A property-management company in the area should have these aggregated.
- How much new for-sale + rental construction is in the pipeline within 1–3 miles? Heavy new supply typically softens prices + rents 12–24 months out; constrained supply supports both.
Investment metrics
- 1% rule
- 0.66% ✗
- Cap rate
- 4.38%
- Cash-on-cash
- -6.84%
- DSCR
- 0.70
- GRM
- 12.5
CMA / ARV
No comps found within radius.
Projected returns pro-forma
10.0% appreciation · 0.85% rent growth · sell at horizon
- IRR
- 18.9%
- Equity multiple
- 2.53×
- Total profit
- $253,134
- Equity at exit
- $531,519
- IRR
- 17.1%
- Equity multiple
- 5.70×
- Total profit
- $777,232
- Equity at exit
- $1,146,240
Cash invested: $165,200 (down + closing). Projections, not guarantees.
Landlord ↔ Tenant lean methodology
- Overall (STATE)
- 87 Strongly Landlord-Friendly
- State Florida
- 87 Strongly Landlord-Friendly · R+3
- County
- — inherits STATE
- City
- — inherits STATE
ZIP-level market 33411
- Home prices YoY
- 1.9%
- Rents YoY
- 0.8%
- Active inventory
- 574
- Price-to-rent
- 12.5×
Monthly cashflow live
- Estimated rent
- $3,918 high interval (Pro) →
- Mortgage (P&I)
- −$3,094
- Tax from tax record
- −$697 /mo · $8,358/yr
- Insurance
- −$246
- HOA
- −$0
- Vacancy / Maint / Mgmt
- −$823
- Net cashflow
- $-941
Break-even live
UW: 25.0% down · 7.5% · 30yr · 1.5% tax · 5.0% vac · 8.0% maint · 8.0% mgmt
Financing live
Cash to close
- Down payment
- $147,500
- Closing costs
- $17,700
- Reserves months
- —
- Total cash needed
- —
Loan-product check · same deal, 3 products live
Conventional
25% down · 7.5% · 30yr
- Down + closing
- —
- Monthly P&I
- —
- Monthly cashflow
- —
- DSCR
- —
- Eligible?
- —
Personal DTI + credit; lowest rate.
DSCR
20% down · 8.5% · 30yr
- Down + closing
- —
- Monthly P&I
- —
- Monthly cashflow
- —
- DSCR
- —
- Eligible?
- —
No personal income docs; deal must DSCR.
Hard money
10% down · 12.0% · 12mo
- Down + closing
- —
- Monthly P&I
- —
- Monthly cashflow
- —
- DSCR
- —
- Eligible?
- —
Short-term bridge; refi at stabilization.
Rent comps 17 comps
| Address | Beds | Baths | Sqft | Rent | $/sqft | DOM | Units | Dist |
|---|---|---|---|---|---|---|---|---|
| 147 Sunflower Cir Royal Palm Beach, FL | 4.0 | 2.0 | 2000 | $4,300 | $2.15 | 19d | 1 | 0.02mi |
| 147 Sunflower Cir Royal Palm Beach, FL | 4.0 | 2.0 | 2000 | $4,100 | $2.05 | 1d | 1 | 0.02mi |
| 100 Miramar Ave Royal Palm Beach, FL | 3.0 | 2.0 | 1812 | $3,600 | $1.99 | 24d | 1 | 0.76mi |
| 191 Parkwood Dr Royal Palm Beach, FL | 3.0 | 3.0 | 2200 | $4,000 | $1.82 | 24d | 1 | 0.79mi |
| 190 Parkwood Dr Royal Palm Beach, FL | 3.0 | 2.0 | 1644 | $3,200 | $1.95 | 24d | 1 | 0.81mi |
| 113 Madrid St Royal Palm Beach, FL | 3.0 | 3.0 | 1720 | $4,500 | $2.62 | 10d | 1 | 0.87mi |
| 113 Madrid St Royal Palm Beach, FL | 4.0 | 3.0 | 1720 | $4,500 | $2.62 | 24d | 1 | 0.87mi |
| 2418 Westmont Dr Royal Palm Beach, FL | 4.0 | 3.0 | 2361 | $4,950 | $2.10 | 3d | 1 | 0.91mi |
| 147 Alcazar St Royal Palm Beach, FL | 4.0 | 3.0 | 2182 | $3,950 | $1.81 | 4d | 1 | 1.13mi |
| 212 Trace Ct Royal Palm Beach, FL | 3.0 | 2.0 | 1740 | $3,050 | $1.75 | 5d | 1 | 1.24mi |
| 240 Bilbao St Royal Palm Beach, FL | 3.0 | 2.0 | 1440 | $3,400 | $2.36 | 24d | 1 | 1.36mi |
| 101 Fairway Ln Royal Palm Beach, FL | 3.0 | 2.5 | 1684 | $3,300 | $1.96 | 22d | 1 | 1.38mi |
| 148 Ponce de Leon St Royal Palm Beach, FL | 3.0 | 2.0 | 2022 | $3,500 | $1.73 | 24d | 1 | 1.45mi |
| 13351 40th St N West Palm Beach, FL | 4.0 | 3.0 | 2586 | $4,500 | $1.74 | 24d | 1 | 1.45mi |
| 180 Heatherwood Dr Royal Palm Beach, FL | 3.0 | 2.0 | 1462 | $2,710 | $1.85 | 5d | 1 | 1.46mi |
| 221 Bilbao St Royal Palm Beach, FL | 3.0 | 2.0 | 1657 | $3,700 | $2.23 | 24d | 1 | 1.48mi |
| 13393 40th Ln N West Palm Beach, FL | 4.0 | 2.0 | 2150 | $3,700 | $1.72 | 20d | 1 | 1.49mi |
Listing history 23 events
-
2026-06-18days on market $590,000 Active 242 DOM
-
2026-06-17days on market $590,000 Active 241 DOM
-
2026-06-16days on market $590,000 Active 240 DOM
-
2026-06-15days on market $590,000 Active 239 DOM
-
2026-06-13days on market $590,000 Active 237 DOM
-
2026-06-09days on market $590,000 Active 233 DOM
-
2026-06-07days on market $590,000 Active 231 DOM
-
2026-06-04days on market $590,000 Active 228 DOM
-
2026-06-03days on market $590,000 Active 227 DOM
-
2026-06-01days on market $590,000 Active 225 DOM
-
2026-05-31days on market $590,000 Active 224 DOM
-
2026-02-20status Active
-
2026-01-25historical Active Under Contract
-
2025-12-16price $590,000
-
2025-10-19$595,000 Active
-
2010-09-20soldstatus $160,070 223-char remark
Show marketing remark (223 chars)
Bank owned! 4 bedroom home with great floorplan! Separate family room, 2 car garage, and large screened patio overlooking beautiful yard with preferred East exposure! Bank addendum will be given upon acceptance of an offer.
-
2010-07-22historical 223-char remark
Show marketing remark (223 chars)
Bank owned! 4 bedroom home with great floorplan! Separate family room, 2 car garage, and large screened patio overlooking beautiful yard with preferred East exposure! Bank addendum will be given upon acceptance of an offer.
-
2010-07-07$145,900 223-char remark
Show marketing remark (223 chars)
Bank owned! 4 bedroom home with great floorplan! Separate family room, 2 car garage, and large screened patio overlooking beautiful yard with preferred East exposure! Bank addendum will be given upon acceptance of an offer.
-
2010-03-20historical
-
2008-05-14$145,000
-
1991-03-20soldstatus $108,000
-
1986-09-01soldstatus $918,000
-
1985-07-01soldstatus $13,007,000
ⓘ Source: listings_history table (triggers on properties + properties_extension) + one-shot
backfill from property_details.listing_events for pre-trigger history.
Tax reassessment forecast FL · Resets to sale price
- Current annual tax
- $8,358 · $697/mo
- Projected year-2 tax
- $8,358 · $697/mo
- Expected delta
- $0/yr ($0/mo · 0.0%)
ⓘ Screening estimate from a state-policy table — verify with the county assessor before closing.
Climate risk First Street
- Flood 1/10 Low FEMA zone X (unshaded) · 0% chance over 30 yrs
- Wildfire 2/10 Low
- Heat 9/10 Extreme 7 d/yr ≥107°F today · 25 d/yr by 30 yrs out
- Wind 10/10 Extreme 99% chance of damaging wind over 30 yrs
- Air quality 2/10 Low 0 unhealthy d/yr today · 1 by 30 yrs out
Nearby sold comps map
Loading sold comps map…
Walkable amenities ~0.75 mi
Loading nearby amenities…
Taxation est. · year 1
- Rental income
- $47,019
- − Mortgage interest
- −$33,049
- − Property taxes
- −$8,358
- − Insurance
- −$2,950
- − Repairs & maintenance
- −$3,762
- − Management
- −$3,762
- − Depreciation
- −$17,164
- Taxable loss
- −$22,025
- Est. tax savings @ 24.0%
- +$5,286
- After-tax cash flow
- $-6,006/yr
For passive investors: Depreciation is non-cash, so a rental often shows a tax loss while cash-flowing — sheltering income. Rental losses are passive: they offset passive income freely, and up to $25,000/yr can offset ordinary (W-2) income if you actively participate and your MAGI is under $100k (phasing out to $0 by $150k); unused losses carry forward. On sale, claimed depreciation is recaptured at up to 25%, and gains may owe capital-gains tax (a 1031 exchange can defer both). Figures are a year-1 estimate at your 24.0% rate — not tax advice; consult a CPA.
Schools (NCES district)
- District
- Palm Beach
- NCES district ID
- 1201500
- Math proficiency
- 46% ▼ -16.00%
- Reading proficiency
- 53% ▼ -4.00%
- Median HH income
- $53,943
- Composite
- 42.72/100
- National rank
- #3160
- State rank
- #34 of 73 in FL
Livability — Royal Palm Beach
- Score
- 79/100
- State rank
- #135
- US rank
- #2039
Category grades
Schools grade is shown separately in the Schools card above.
Census & demographics
- Census place
- Royal Palm Beach, FL
- County
- Palm Beach County · 1,438,312 people
- City population
- 75,299
- Metro
- Miami-Fort Lauderdale-Pompano Beach, FL
- Population (ZIP)
- 76,863
- Household income
- $92,591
- Rent vs Own
- Severe rent burden
- 1870.0
Population outlook (Palm Beach County) Hauer SSP2
- Today (2025)
- 1,637,487 people
- By 2030
- 1,743,255 · +6.5%
- By 2040
- 1,948,712 · +19.0%
- By 2050
- 2,132,979 · +30.3%
- By 2075
- 2,530,027 · +54.5%
- By 2100
- 2,706,979 · +65.3%
Race, ethnicity, and origin ACS 2023
- Neighborhood character
- Diverse neighborhood (Simpson 0.70)
- Race & ethnicity
- White 44% Hispanic / Latino 24% Black 23% Two or more races 16% Asian 5%
- Hispanic origin (detail)
- Mexican 2% Puerto Rican 5% Cuban 4% Dominican 2%
- Common ancestry
- Hispanic 6% Romanian 2% Italian 1%
- Foreign-born
- 26% · Canada, Jamaica, China
- Languages at home
- 73% English-only · Spanish 17% French/Haitian/Cajun 4% Other Indo-European 2%
Political lean MEDSL · Palm Beach
- 2024 margin
- Toss-up / Even · D 50.0% · R 49.2%
- 2008→2024 swing
- -22.1pp toward R · 2008: 22.9pp · 2024: 0.8pp
- All cycles
- 2024: D+0.8 2020: D+12.8 2016: D+15.3 2012: D+17.0 2008: D+22.9
Not yet ingested
- Civics
- —
Market trends
- HPI YoY
- ▲ 17.04%
- Current HPI
- 903.78
- Rent YoY
- ▲ 0.85%
- Metro
- Miami-Fort Lauderdale-Pompano Beach, FL
- State GDP YoY
- ▲ 3.28%
- F500 in state
- 36
Industry mix (Fortune 500 HQ in FL)
| Industry | F500 HQs | Revenue |
|---|---|---|
| Industrial Technology | 2 | $29B |
|
||
| Insurance | 2 | $17B |
|
||
| Retail | 1 | $60B |
|
||
| Technology Distribution | 1 | $58B |
|
||
| Homebuilding | 1 | $35B |
|
||
| Technology Manufacturing | 1 | $35B |
|
||
Price history
-95.5% since first listed12 events — show timeline
- 2026-02-20 Relisted — MARMLS
- 2026-01-25 Contingent — MARMLS
- 2025-12-16 Price Changed $590,000 MARMLS
- 2025-10-19 Listed $595,000 MARMLS
- 2010-09-20 Sold (MLS) $160,070 Beaches MLS
- 2010-07-22 Listing Removed — Beaches MLS
- 2010-07-07 Listed $145,900 Beaches MLS
- 2010-03-20 Listing Removed — Beaches MLS
- 2008-05-14 Listed $145,000 Beaches MLS
- 1991-03-20 Sold (Public Records) $108,000 Public Records
- 1986-09-01 Sold (Public Records) $918,000 Public Records
- 1985-07-01 Sold (Public Records) $13,007,000 Public Records
Property tax history
+8.8%/yrLatest (2025): $8,358 · +108.1% YoY. Source: county tax records.
Cash-flow waterfall
monthlySold comps — $/sqft
last 12 mo · ≤1 miLoading sold comps…