3909 E Fourth Plain Blvd · Vancouver, WA
Flood risk No data
- FEMA flood zone
- —
- Chance of flooding over 30 yrs
- —
- Est. flood insurance / yr
- —
Fire risk No data
- Est. fire insurance / yr
- —
Heat risk No data
- Hot days now (above threshold)
- —
- Hot days in 30 yrs
- —
Wind risk No data
- Chance of severe wind over 30 yrs
- —
Air-quality risk No data
- Unhealthy air days now
- —
- Unhealthy air days in 30 yrs
- —
Risk factors via First Street. Map © Google.
Why this score? — see what drove the B+ grade
The composite is a weighted blend of 9 inputs, each scored 0–100. Each bar is that input's sub-score; the figure is the points it added to the 100-point composite (weight × sub-score).
- Cash flow +30.0/30.0
- ARV discount +15.0/15.0
- 1% rule +10.0/10.0
- DSCR +10.0/10.0
- Schools +4.3/10.0
- Livability +4.1/5.0
- Rent growth +3.0/5.0
- Condition / age +2.5/5.0
- Appreciation +0.0/10.0
$40,000
🖨 Deal sheet 📄 Offer letter ✓ Due diligence
Listing remarks
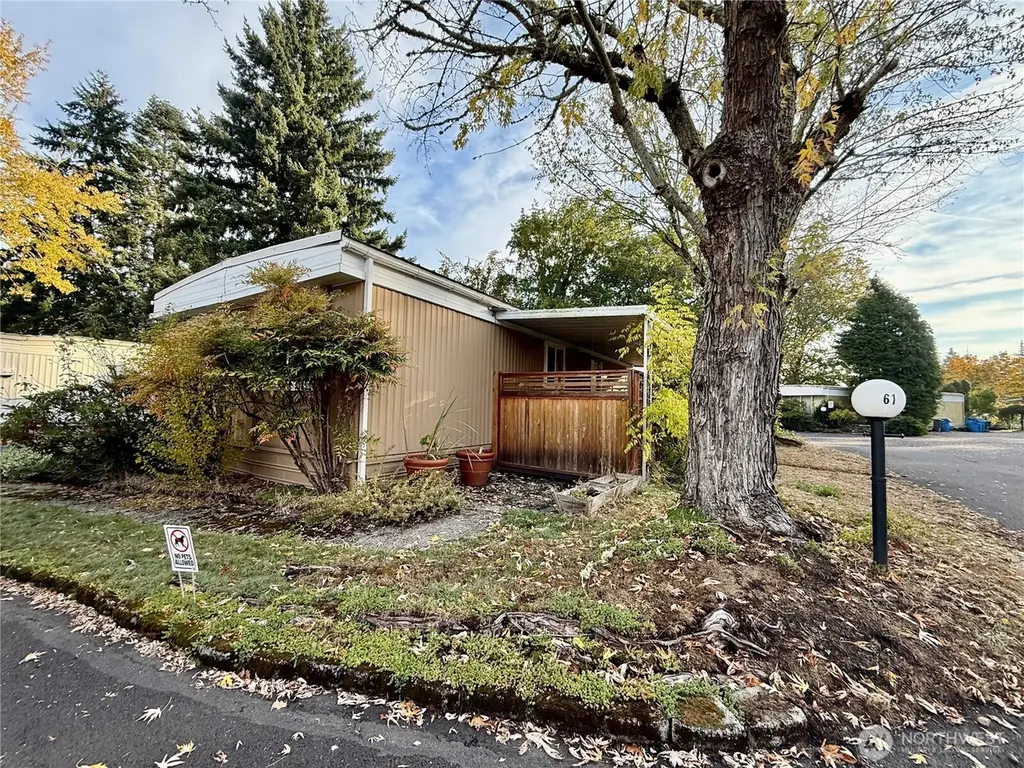
Welcome to this inviting 2-bedroom, 2-bath home offering 1,120 square feet of comfortable living space within the Totem Pole 55+ community. Inside, you'll find a spacious living room, dining room with charming built-ins, a large primary bedroom with a walk-in closet, and a convenient in-home laundry area. Step outside to a partially fenced in covered patio, perfect for morning coffee or meals outdoors. Single car carport, and a handy tool shed complete with a small workshop space perfect for hobbies or extra storage. Located in a community with great amenities, including a clubhouse, on-site laundry, and RV storage, this home combines functionality with a relaxed lifestyle.
Key facts
- In-home laundry area
- Tool shed
- Clubhouse
Tags
Neighborhood map
What this means for you Summary
Snapshot
- This is a 2-bed/2.0-bath land listed at $40k.
Deal economics
- At list price, monthly cash flow is $1k ($12k/yr) — positive.
- The deal already cash-flows at list — no discount required.
- Meets the 1% rule at list price ($2k rent vs $40k).
- Recommended offer: $35k (12.0% below list) — sets the bar for market timing.
- Cap rate 37.2% vs local median 2.7% in Vancouver — top-decile yield for the area; either an underpriced asset or a hidden risk that comps aren't pricing in. Stress-test before assuming the spread holds.
Location & tenants
- Location reads 82/100 on livability (#62 in WA, #1,133 nationally) — a professional / high-income tenant draw. Strengths: amenities A+, commute A+, housing A+; Watch: crime F, cost of living D-.
- Vancouver School District (suburban): math 43% / reading 53% proficiency, ranked #156 of 291 in WA (top 54%) — families likely to look elsewhere, expect single-tenant / working-renter base with shorter leases.
- Market conditions: Rents rising (+2.0%/yr); 266 active listings in the ZIP; 40 comparable units currently listed for rent nearby; rentals at typical pace (median 18d on market — plan ~3-4 weeks tenant-placement turnaround); solid renter incomes; 3,547 units permitted in Clark County in 2024 (1,361 in 5+ unit buildings).
Forward outlook
- Local home prices are declining (-3.0%/yr); year-one equity from $277 of loan paydown is wiped out by about $1k of value loss. Plan a longer hold.
- Clark County population projected at +29% by 2050 — long-run rental-demand tailwind backs the buy-and-hold thesis.
- At projected returns (-3.0% appreciation + 2.0% rent growth), your $11k cash investment doubles in ~1 year — after that, you're playing with house money.
Negotiation context
- It's been on market 209 days — a 12% lower offer ($35k) is reasonable based on typical stale-listing flexibility.
- 4 sale attempts since 26y ago; this cycle's ask has dropped $35k (47%) from the opening price — seller is motivated, your offer sets the floor, not the list.
- Current owner paid $6k; list at $40k implies a 515% gain — meaningful room to come down on a strong offer.
Questions for the listing agent
- It's been on market 209 days. Have you received any prior offers? Is the seller open to a 12% concession, seller financing, or rate buy-down credit?
- Built in 1969 — when were the roof, HVAC, electrical panel, plumbing, and water heater last replaced?
- Why hasn't it sold? Are there any deal-killer items the seller is aware of (foundation, flood, title, zoning, code violations)?
- Is there a deadline driving the sale (1031 exchange, divorce, estate, relocation)? That informs how much negotiation room exists.
- Crime grade is F in this area — have there been break-ins, vandalism, or insurance claims at this property in the last 3 years? What carrier currently insures it and at what premium?
- What's the average days-on-market for RENTAL listings here right now (not sales)? A rising rental-DOM trend means longer vacancies and softer asking-rent achievability than the comps imply.
- What's the recent tenant-quality profile in this submarket — average credit score on applications, eviction rate, late-payment / NSF rate, and stable-employment percentage? A property-management company in the area should have these aggregated.
- How much new for-sale + rental construction is in the pipeline within 1–3 miles? Heavy new supply typically softens prices + rents 12–24 months out; constrained supply supports both.
Investment metrics
- 1% rule
- 4.14% ✓
- Cap rate
- 37.21%
- Cash-on-cash
- 110.43%
- DSCR
- 5.91
- GRM
- 2.0
CMA / ARV
- ARV (median comp)
- $77,816
- List price
- $40,000
- Delta
- -48.60%
- Verdict
- UNDERPRICED
- Comps
- 4 within 1.0 mi
Projected returns pro-forma
-3.0% appreciation · 2.05% rent growth · sell at horizon
- IRR
- —
- Equity multiple
- 6.14×
- Total profit
- $57,621
- Equity at exit
- $5,964
- IRR
- —
- Equity multiple
- 12.47×
- Total profit
- $128,497
- Equity at exit
- $3,458
Cash invested: $11,200 (down + closing). Projections, not guarantees.
Landlord ↔ Tenant lean methodology
- Overall (STATE)
- 28 Tenant-Leaning
- State Washington
- 28 Tenant-Leaning · D+8
- County
- — inherits STATE
- City
- — inherits STATE
ZIP-level market 98661
- Rents YoY
- 2.0%
- Active inventory
- 266
- Price-to-rent
- 2.0×
Monthly cashflow live
- Estimated rent
- $1,655 high interval (Pro) →
- Mortgage (P&I)
- −$210
- Tax est. 1.5%
- −$50 /mo · $600/yr
- Insurance
- −$17
- HOA
- −$0
- Vacancy / Maint / Mgmt
- −$347
- Net cashflow
- $1,031
Break-even live
UW: 25.0% down · 7.5% · 30yr · 1.5% tax · 5.0% vac · 8.0% maint · 8.0% mgmt
Financing live
Cash to close
- Down payment
- $10,000
- Closing costs
- $1,200
- Reserves months
- —
- Total cash needed
- —
Loan-product check · same deal, 3 products live
Conventional
25% down · 7.5% · 30yr
- Down + closing
- —
- Monthly P&I
- —
- Monthly cashflow
- —
- DSCR
- —
- Eligible?
- —
Personal DTI + credit; lowest rate.
DSCR
20% down · 8.5% · 30yr
- Down + closing
- —
- Monthly P&I
- —
- Monthly cashflow
- —
- DSCR
- —
- Eligible?
- —
No personal income docs; deal must DSCR.
Hard money
10% down · 12.0% · 12mo
- Down + closing
- —
- Monthly P&I
- —
- Monthly cashflow
- —
- DSCR
- —
- Eligible?
- —
Short-term bridge; refi at stabilization.
Rent comps 40 comps
| Address | Beds | Baths | Sqft | Rent | $/sqft | DOM | Units | Dist |
|---|---|---|---|---|---|---|---|---|
| 3700 E Fourth Plain Blvd Vancouver, WA | 2.0 | 1.0 | 700 | $1,409 | $2.01 | 7d | 1 | 0.18mi |
| 3903 E 18th St #13 Vancouver, WA | 2.0 | 1.0 | 900 | $1,495 | $1.66 | 21d | 1 | 0.23mi |
| 1604 Bryant St #13 Vancouver, WA | 2.0 | 1.0 | 780 | $1,475 | $1.89 | 23d | 1 | 0.26mi |
| 4325 E 17th St Unit 1 Vancouver, WA | 2.0 | 1.0 | 700 | $1,489 | $2.13 | 12d | 1 | 0.29mi |
| 2478 Rossiter Ln Vancouver, WA | 2.0–3.0 | 1.0–1.5 | 1100 | $1,749 | $1.59 | 2d | 6 | 0.29mi |
| 4012 E 16th St Unit A Vancouver, WA | 2.0 | 1.0 | 950 | $1,350 | $1.42 | 19d | 1 | 0.31mi |
| 3911 Plomondon St Vancouver, WA | 2.0 | 1.5 | 900 | $1,795 | $1.99 | 23d | 1 | 0.33mi |
| 4706 Sheridan Dr Vancouver, WA | 3.0 | 1.0 | 1000 | $2,300 | $2.30 | 2d | 1 | 0.33mi |
| 3408 E 18th St Unit 3408-J Vancouver, WA | 2.0 | 1.0 | 830 | $1,695 | $2.04 | 23d | 1 | 0.34mi |
| 3408 E 18th St Unit J Vancouver, WA | 2.0 | 1.0 | 830 | $1,695 | $2.04 | 21d | 1 | 0.34mi |
| 2920 Falk Rd Vancouver, WA | 2.0–3.0 | 2.5–3.0 | 1268 | $2,375 | $1.87 | 1d | 1 | 0.38mi |
| 3311 E 21st St Apt 12 Vancouver, WA | 2.0 | 1.0 | 825 | $1,200 | $1.45 | 17d | 1 | 0.39mi |
| 3308 E 24th Cir Vancouver, WA | 1.0 | 1.0 | 700 | $1,795 | $2.56 | 17d | 1 | 0.40mi |
| 2615 Neals Ln Vancouver, WA | 2.0 | 1.0 | 850 | $1,390 | $1.64 | 2d | 1 | 0.40mi |
| 2815 Caples Ave Unit 1 Vancouver, WA | 2.0 | 1.0 | 814 | $1,695 | $2.08 | 14d | 1 | 0.40mi |
| 4402 Gibbons St Unit 1 Vancouver, WA | 2.0 | 1.0 | 890 | $1,649 | $1.85 | 23d | 1 | 0.41mi |
| 4601 E 18th St Vancouver, WA | 1.0–3.0 | 1.0–2.0 | 1010 | $1,752 | $1.74 | 2d | 13 | 0.43mi |
| 2900 General Anderson Ave Vancouver, WA | 1.0–3.0 | 1.0–2.0 | 880 | $1,591 | $1.81 | 2d | 5 | 0.43mi |
| 3306 E 18th St Unit WA3304-1 Vancouver, WA | 3.0 | 2.0 | 1150 | $1,825 | $1.59 | 23d | 1 | 0.43mi |
| 2817 Neals Ln Vancouver, WA | 2.0 | 1.0 | 900 | $1,275 | $1.42 | 23d | 1 | 0.44mi |
| 2009 Norris Rd Unit 6 Vancouver, WA | 2.0 | 1.0 | 850 | $1,295 | $1.52 | 23d | 1 | 0.44mi |
| 4420 Gibbons St Unit B Vancouver, WA | 2.0 | 1.0 | 900 | $1,395 | $1.55 | 12d | 1 | 0.44mi |
| 3100 Falk Rd Vancouver, WA | 2.0–3.0 | 2.0–3.0 | 1234 | $1,649 | $1.34 | 1d | 4 | 0.47mi |
| 2212 Carlson Rd Vancouver, WA | 2.0 | 1.0 | 780 | $1,420 | $1.82 | 11d | 1 | 0.48mi |
| 3622 E 13th St Vancouver, WA | 2.0 | 1.0 | 800 | $1,700 | $2.12 | 19d | 1 | 0.50mi |
| 1530 Ash St Vancouver, WA | 2.0 | 1.5 | 1020 | $1,450 | $1.42 | 14d | 1 | 0.54mi |
| 3212 E 13th St Unit 3214-2 Vancouver, WA | 2.0 | 1.0 | 952 | $1,595 | $1.68 | 23d | 1 | 0.62mi |
| 2815 E 19th St Unit D Vancouver, WA | 2.0 | 1.0 | 850 | $1,395 | $1.64 | 23d | 1 | 0.63mi |
| 2815 E 19th St Apt Q Vancouver, WA | 2.0 | 1.0 | 850 | $1,395 | $1.64 | 21d | 1 | 0.63mi |
| 4918 Plomondon St Vancouver, WA | 2.0 | 2.0 | 1000 | $1,695 | $1.70 | 7d | 1 | 0.63mi |
| 4500 Nicholson Rd Vancouver, WA | 2.0–3.0 | 2.0 | 1034 | $1,549 | $1.50 | 2d | 8 | 0.66mi |
| NE 47 NE 47th Ct Vancouver, WA | 3.0 | 2.5 | 1475 | $2,850 | $1.93 | 1d | 5 | 0.66mi |
| 5301 Plomondon St Unit A6 Vancouver, WA | 2.0 | 2.5 | 1491 | $1,995 | $1.34 | 21d | 1 | 0.67mi |
| 4316 NE 34th Cir Vancouver, WA | 3.0 | 2.5 | 1482 | $2,450 | $1.65 | 1d | 1 | 0.70mi |
| 5500 NE Fourth Plain Blvd Vancouver, WA | 1.0–2.0 | 1.0–2.0 | 768 | $1,659 | $2.16 | 2d | 4 | 0.73mi |
| 3011 Fairmount Ave Unit 3011 Vancouver, WA | 2.0 | 1.0 | 1000 | $1,725 | $1.73 | 23d | 1 | 0.74mi |
| 5203 Ogden Ct Unit B Vancouver, WA | 2.0 | 2.0 | 1118 | $1,999 | $1.79 | 7d | 1 | 0.75mi |
| 3218 Edgewood Dr Unit 3224 D Vancouver, WA | 2.0 | 1.0 | 890 | $1,495 | $1.68 | 23d | 1 | 0.76mi |
| 2012 Y St Unit 2014 Vancouver, WA | 2.0 | 1.0 | 720 | $1,450 | $2.01 | 10d | 1 | 0.82mi |
| 5114 NE 34th St Vancouver, WA | 2.0 | 2.0 | 998 | $1,595 | $1.60 | 23d | 1 | 0.82mi |
Listing history 20 events
-
2026-06-13statusdays on market $40,000 Pending 209 DOM
-
2026-06-09days on market $40,000 Active 208 DOM
-
2026-06-08days on market $40,000 Active 207 DOM
-
2026-06-07days on market $40,000 Active 206 DOM
-
2026-06-03days on market $40,000 Active 202 DOM
-
2026-06-02days on market $40,000 Active 201 DOM
-
2026-06-01days on market $40,000 Active 200 DOM
-
2026-05-31days on market $40,000 Active 199 DOM
-
2026-05-15price $40,000
-
2026-05-15status Active
-
2026-05-01historical
-
2026-04-07price $50,000
-
2026-03-05price $55,000
-
2026-01-12price $65,000
-
2025-10-30$75,000 Active
-
2012-08-14status Pending
-
2012-08-01$6,500 Active
-
2012-07-28soldstatus $6,500 Sold
-
2000-08-30
-
1994-11-22soldstatus $31,292
ⓘ Source: listings_history table (triggers on properties + properties_extension) + one-shot
backfill from property_details.listing_events for pre-trigger history.
Nearby sold comps map
Loading sold comps map…
Walkable amenities ~0.75 mi
Loading nearby amenities…
Taxation est. · year 1
- Rental income
- $19,855
- − Mortgage interest
- −$2,241
- − Property taxes
- −$600
- − Insurance
- −$200
- − Repairs & maintenance
- −$1,588
- − Management
- −$1,588
- − Depreciation
- −$1,164
- Taxable income
- $12,474
- Est. tax owed @ 24.0%
- −$2,994
- After-tax cash flow
- $9,374/yr
For passive investors: Depreciation is non-cash, so a rental often shows a tax loss while cash-flowing — sheltering income. Rental losses are passive: they offset passive income freely, and up to $25,000/yr can offset ordinary (W-2) income if you actively participate and your MAGI is under $100k (phasing out to $0 by $150k); unused losses carry forward. On sale, claimed depreciation is recaptured at up to 25%, and gains may owe capital-gains tax (a 1031 exchange can defer both). Figures are a year-1 estimate at your 24.0% rate — not tax advice; consult a CPA.
Schools (NCES district)
- District
- Vancouver School District
- NCES district ID
- 5309270
- Math proficiency
- 43% ▬ 0.00%
- Reading proficiency
- 53% ▬ 0.00%
- Median HH income
- $52,562
- Composite
- 43.45/100
- National rank
- #6479
- State rank
- #156 of 291 in WA
Livability — Vancouver
- Score
- 82/100
- State rank
- #62
- US rank
- #1133
Category grades
Schools grade is shown separately in the Schools card above.
Census & demographics
- Census place
- Vancouver, WA
- County
- Clark County · 513,189 people
- City population
- 360,195
- Metro
- Portland-Vancouver-Hillsboro, OR-WA
- Population (ZIP)
- 50,743
- Household income
- $76,913
- Rent vs Own
- Severe rent burden
- 2384.0
Population outlook (Clark County) Hauer SSP2
- Today (2025)
- 529,610 people
- By 2030
- 563,242 · +6.4%
- By 2040
- 625,905 · +18.2%
- By 2050
- 681,558 · +28.7%
- By 2075
- 805,967 · +52.2%
- By 2100
- 877,450 · +65.7%
Race, ethnicity, and origin ACS 2023
- Neighborhood character
- Majority White (64%)
- Race & ethnicity
- White 64% Hispanic / Latino 21% Two or more races 14% Black 4% Asian 3% Pacific Islander 2%
- Hispanic origin (detail)
- Mexican 18%
- Common ancestry
- Lithuanian 3% Portuguese 3% Subsaharan African 3%
- Foreign-born
- 15% · Canada, Vietnam
- Languages at home
- 76% English-only · Spanish 14% Russian/Polish/Slavic 4% Other Indo-European 2%
Political lean MEDSL · Clark
- 2024 margin
- Lean D (+7.0) · D 52.1% · R 45.1% · Other 2.8%
- 2008→2024 swing
- +0.9pp no change · 2008: 6.1pp · 2024: 7.0pp
- All cycles
- 2024: D+7.0 2020: D+5.1 2016: D+0.1 2012: D+0.1 2008: D+6.1
Not yet ingested
- Civics
- —
Market trends
- HPI YoY
- ▼ -567.83%
- Current HPI
- 308.3632
- Rent YoY
- ▲ 2.05%
- Metro
- Portland-Vancouver-Hillsboro, OR-WA
- State GDP YoY
- ▲ 4.65%
- F500 in state
- 22
Industry mix (Fortune 500 HQ in WA)
| Industry | F500 HQs | Revenue |
|---|---|---|
| Retail | 2 | $269B |
|
||
| Technology / Retail | 1 | $638B |
|
||
| Technology | 1 | $245B |
|
||
| Telecommunications | 1 | $38B |
|
||
| Food / Beverage | 1 | $36B |
|
||
| Automotive / Trucks | 1 | $34B |
|
||
Price history
+27.8% since first listed12 events — show timeline
- 2026-05-15 Price Changed $40,000 NWMLS as Distributed by MLS Grid
- 2026-05-15 Relisted — NWMLS as Distributed by MLS Grid
- 2026-05-01 Delisted — NWMLS as Distributed by MLS Grid
- 2026-04-07 Price Changed $50,000 NWMLS as Distributed by MLS Grid
- 2026-03-05 Price Changed $55,000 NWMLS as Distributed by MLS Grid
- 2026-01-12 Price Changed $65,000 NWMLS as Distributed by MLS Grid
- 2025-10-30 Listed $75,000 NWMLS as Distributed by MLS Grid
- 2012-08-14 Pending — NWMLS as Distributed by MLS Grid
- 2012-08-01 Listed $6,500 NWMLS as Distributed by MLS Grid
- 2012-07-28 Sold (MLS) $6,500 NWMLS as Distributed by MLS Grid
- 2000-08-30 Listed — RMLS
- 1994-11-22 Sold (Public Records) $31,292 Public Records
Property tax history
+4.8%/yrLatest (2026): $34,464 · +9.3% YoY. Source: county tax records.
Cash-flow waterfall
monthlySold comps — $/sqft
last 12 mo · ≤1 miLoading sold comps…