505 9th Ave · Dayton, KY
Flood risk 1/10 · Minimal
- FEMA flood zone
- X (unshaded)
- Chance of flooding over 30 yrs
- 0.0%
- Est. flood insurance / yr
- $507 – $1,088
Fire risk 1/10 · Minimal
- Est. fire insurance / yr
- $839 – $1,559
Heat risk 5/10 · Moderate
- Hot days now (above 103°F)
- 7 days/yr
- Hot days in 30 yrs
- 19 days/yr
Wind risk 2/10 · Minimal
- Chance of severe wind over 30 yrs
- 1.0%
Air-quality risk 3/10 · Minor
- Unhealthy air days now
- 2 days/yr
- Unhealthy air days in 30 yrs
- 3 days/yr
Risk factors via First Street. Map © Google.
Why this score? — see what drove the B grade
The composite is a weighted blend of 9 inputs, each scored 0–100. Each bar is that input's sub-score; the figure is the points it added to the 100-point composite (weight × sub-score).
- Cash flow +30.0/30.0
- 1% rule +10.0/10.0
- DSCR +10.0/10.0
- ARV discount +7.5/15.0
- Rent growth +4.3/5.0
- Livability +4.0/5.0
- Condition / age +2.5/5.0
- Schools +2.3/10.0
- Appreciation +0.0/10.0
$129,900
🖨 Deal sheet 📄 Offer letter ✓ Due diligence
Listing remarks MLS
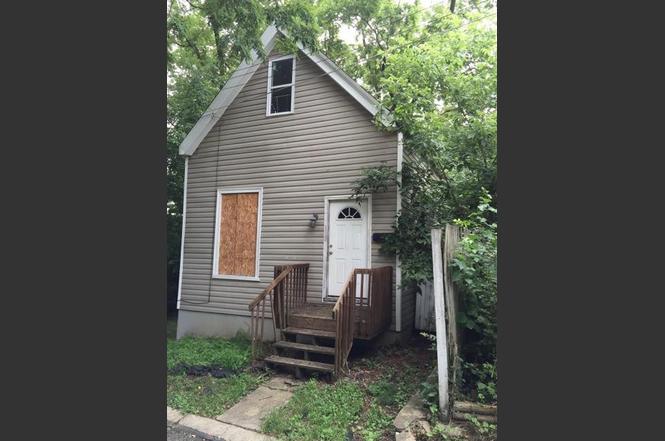
Bank owned 2 story, wooded lot,hardwood floors, some updates, will need rehab, convenient location.Property sold as is.
Key facts
- Hard wood floors
- Wooded lot
- Lower level
Tags
Property features AI
Exterior
- Parking: On-street parking
- Utilities: Public water; Private sewer; Cable available; Natural gas available; Sewer available
- Home design: Single-family house; Two levels; Existing structure
- Construction: Aluminum siding; Block foundation
- Exterior features: Deck; Porch; Corner lot; Vinyl-framed windows; Asphalt roof
Interior
- Kitchen: Electric oven; Refrigerator
- Bedrooms: Primary bedroom (10 x 10); Bedroom 2 (10 x 10); Bedroom 3 (14 x 11)
- Bathrooms: 2 full bathrooms
- Heating & cooling: Central air conditioning; Forced air heating
- Interior features: Electric oven; Refrigerator
Neighborhood map
What this means for you Summary
Snapshot
- This is a 3-bed/2.0-bath single-family listed at $130k.
Deal economics
- At list price, monthly cash flow is $1k ($12k/yr) — positive.
- The deal already cash-flows at list — no discount required.
- Meets the 1% rule at list price ($2k rent vs $130k).
- Recommended offer: $122k (6.0% below list) — sets the bar for market timing.
- Cap rate 15.6% vs local median 6.9% in Dayton — top-decile yield for the area; either an underpriced asset or a hidden risk that comps aren't pricing in. Stress-test before assuming the spread holds.
Location & tenants
- Location reads 81/100 on livability (#67 in KY, #1,485 nationally) — a professional / high-income tenant draw. Strengths: commute A+, cost of living A+, housing A+; Watch: employment D+.
- Dayton Independent (suburban): math 23% / reading 32% proficiency, ranked #129 of 165 in KY (top 78%) — low school quality limits family demand, transient renter base, plan for 1-2y turnover; 71% free/reduced lunch — lower-income household profile, screen leases tightly.
- Zoned schools: Lincoln Elementary School (math 20% / reading 29%, grade F, #489 of 676 statewide, top 76%, 487 students, 82% FRL); Dayton High School (math 27% / reading 37%, grade F, #97 of 254 statewide, top 46%, 372 students, 78% FRL).
- Market conditions: Rents rising fast (+7.2%/yr); 53 active listings in the ZIP; 6 comparable units currently listed for rent nearby; rentals leasing fast (median 2d on market — plan ~1-2 weeks tenant-placement turnaround); 247 units permitted in Campbell County in 2024 (77 in 5+ unit buildings).
- This rent runs 42% of the median local income ($66k/yr) — at the standard rent-burdened threshold; future hikes will face affordability resistance.
Forward outlook
- Local home prices are declining (-3.0%/yr); year-one equity from $898 of loan paydown is wiped out by about $4k of value loss. Plan a longer hold.
- At projected returns (-3.0% appreciation + 7.2% rent growth), your $36k cash investment doubles in ~4 years — after that, you're playing with house money.
Negotiation context
- It's been on market 88 days — a 6% lower offer ($122k) is reasonable based on typical stale-listing flexibility.
- 6 sale attempts since 22y ago with the ask held roughly flat each time — persistent listings suggest the price (not the market) is what's stuck; bring a comps-based counter.
- Current owner paid $10k; list at $130k implies a 1199% gain — meaningful room to come down on a strong offer.
Risks & watch-outs
- Watch-outs: built in 1850 — expect roof / HVAC / electrical / plumbing capex.
- Climate carrying-cost: extreme-heat days projected 7→19/yr by 2055 (HVAC capex compounding) — expect insurance premiums to compound above CPI over the hold.
Questions for the listing agent
- It's been on market 88 days. Have you received any prior offers? Is the seller open to a 6% concession, seller financing, or rate buy-down credit?
- Built in 1850 — when were the roof, HVAC, electrical panel, plumbing, and water heater last replaced?
- Why hasn't it sold? Are there any deal-killer items the seller is aware of (foundation, flood, title, zoning, code violations)?
- Is there a deadline driving the sale (1031 exchange, divorce, estate, relocation)? That informs how much negotiation room exists.
- Schools are D-rated, which usually means shorter tenancies and higher turnover. Who's the typical renter profile here, and what's been the actual vacancy rate?
- What's the average days-on-market for RENTAL listings here right now (not sales)? A rising rental-DOM trend means longer vacancies and softer asking-rent achievability than the comps imply.
- What's the recent tenant-quality profile in this submarket — average credit score on applications, eviction rate, late-payment / NSF rate, and stable-employment percentage? A property-management company in the area should have these aggregated.
- How much new for-sale + rental construction is in the pipeline within 1–3 miles? Heavy new supply typically softens prices + rents 12–24 months out; constrained supply supports both.
Investment metrics
- 1% rule
- 1.76% ✓
- Cap rate
- 15.57%
- Cash-on-cash
- 33.12%
- DSCR
- 2.47
- GRM
- 4.7
CMA / ARV
No comps found within radius.
Projected returns pro-forma
-3.0% appreciation · 7.15% rent growth · sell at horizon
- IRR
- 32.7%
- Equity multiple
- 2.45×
- Total profit
- $52,821
- Equity at exit
- $19,369
- IRR
- 41.8%
- Equity multiple
- 5.75×
- Total profit
- $172,763
- Equity at exit
- $11,231
Cash invested: $36,372 (down + closing). Projections, not guarantees.
Landlord ↔ Tenant lean methodology
- Overall (STATE)
- 83 Strongly Landlord-Friendly
- State Kentucky
- 83 Strongly Landlord-Friendly · R+16
- County
- — inherits STATE
- City
- — inherits STATE
ZIP-level market 41074
- Rents YoY
- 7.2%
- Active inventory
- 53
- Price-to-rent
- 4.7×
Monthly cashflow live
- Estimated rent
- $2,290 high interval (Pro) →
- Mortgage (P&I)
- −$681
- Tax from tax record
- −$70 /mo · $843/yr
- Insurance
- −$54
- HOA
- −$0
- Vacancy / Maint / Mgmt
- −$481
- Net cashflow
- $1,004
Break-even live
UW: 25.0% down · 7.5% · 30yr · 1.5% tax · 5.0% vac · 8.0% maint · 8.0% mgmt
Financing live
Cash to close
- Down payment
- $32,475
- Closing costs
- $3,897
- Reserves months
- —
- Total cash needed
- —
Loan-product check · same deal, 3 products live
Conventional
25% down · 7.5% · 30yr
- Down + closing
- —
- Monthly P&I
- —
- Monthly cashflow
- —
- DSCR
- —
- Eligible?
- —
Personal DTI + credit; lowest rate.
DSCR
20% down · 8.5% · 30yr
- Down + closing
- —
- Monthly P&I
- —
- Monthly cashflow
- —
- DSCR
- —
- Eligible?
- —
No personal income docs; deal must DSCR.
Hard money
10% down · 12.0% · 12mo
- Down + closing
- —
- Monthly P&I
- —
- Monthly cashflow
- —
- DSCR
- —
- Eligible?
- —
Short-term bridge; refi at stabilization.
Rent comps 6 comps
| Address | Beds | Baths | Sqft | Rent | $/sqft | DOM | Units | Dist |
|---|---|---|---|---|---|---|---|---|
| 1065 Manhattan Blvd Dayton, KY | 1.0–3.0 | 1.0–2.0 | 1038 | $2,749 | $2.65 | 1d | 19 | 0.66mi |
| 2401 Salutaris Ave Cincinnati, OH | 1.0–2.0 | 1.0 | 800 | $1,300 | $1.62 | 23d | 1 | 0.95mi |
| 2330 Victory Pkwy Cincinnati, OH | 1.0–2.0 | 1.0–2.0 | 693 | $1,999 | $2.88 | 2d | 6 | 1.07mi |
| 2533 Woodburn Ave Cincinnati, OH | 3.0 | 1.0–3.0 | 912 | $3,320 | $3.64 | 1d | 39 | 1.13mi |
| 3001-A Woodburn Ave Cincinnati, OH | 1.0–2.0 | 1.0–2.0 | 947 | $2,252 | $2.38 | 1d | 12 | 1.40mi |
| 1055 St Paul Pl Cincinnati, OH | 3.0 | 1.0–2.0 | 975 | $2,995 | $3.07 | 1d | 10 | 1.41mi |
Listing history 20 events
-
2026-06-09days on market $129,900 Active 88 DOM
-
2026-06-08days on market $129,900 Active 87 DOM
-
2026-06-07days on market $129,900 Active 86 DOM
-
2026-06-03days on market $129,900 Active 82 DOM
-
2026-06-02days on market $129,900 Active 81 DOM
-
2026-06-01days on market $129,900 Active 80 DOM
-
2026-05-31days on market $129,900 Active 79 DOM
-
2026-03-11$129,900 Active
-
2015-09-18soldstatus $10,000 119-char remark
Show marketing remark (119 chars)
Bank owned 2 story, wooded lot,hardwood floors, some updates, will need rehab, convenient location.Property sold as is.
-
2015-07-10$24,900 119-char remark
Show marketing remark (119 chars)
Bank owned 2 story, wooded lot,hardwood floors, some updates, will need rehab, convenient location.Property sold as is.
-
2015-06-29historical
-
2015-01-27$29,900
-
2014-10-01historical
-
2013-08-06$65,000
-
2007-11-30soldstatus $17,000
-
2007-11-30soldstatus $17,000
-
2007-11-20soldstatus $17,000
-
2007-07-20$24,000
-
2005-02-19historical
-
2004-08-19$32,000
ⓘ Source: listings_history table (triggers on properties + properties_extension) + one-shot
backfill from property_details.listing_events for pre-trigger history.
Tax reassessment forecast KY · Resets to sale price
- Current annual tax
- $843 · $70/mo
- Projected year-2 tax
- $1,117 · $93/mo
- Expected delta
- +$274/yr (+$23/mo · 32.5%)
ⓘ Screening estimate from a state-policy table — verify with the county assessor before closing.
Climate risk First Street
- Flood 1/10 Low FEMA zone X (unshaded) · 0% chance over 30 yrs
- Wildfire 1/10 Low
- Heat 5/10 Major 7 d/yr ≥103°F today · 19 d/yr by 30 yrs out
- Wind 2/10 Low 100% chance of damaging wind over 30 yrs
- Air quality 3/10 Moderate 2 unhealthy d/yr today · 3 by 30 yrs out
Nearby sold comps map
Loading sold comps map…
Walkable amenities ~0.75 mi
Loading nearby amenities…
Taxation est. · year 1
- Rental income
- $27,484
- − Mortgage interest
- −$7,276
- − Property taxes
- −$843
- − Insurance
- −$650
- − Repairs & maintenance
- −$2,199
- − Management
- −$2,199
- − Depreciation
- −$3,779
- Taxable income
- $10,538
- Est. tax owed @ 24.0%
- −$2,529
- After-tax cash flow
- $9,516/yr
For passive investors: Depreciation is non-cash, so a rental often shows a tax loss while cash-flowing — sheltering income. Rental losses are passive: they offset passive income freely, and up to $25,000/yr can offset ordinary (W-2) income if you actively participate and your MAGI is under $100k (phasing out to $0 by $150k); unused losses carry forward. On sale, claimed depreciation is recaptured at up to 25%, and gains may owe capital-gains tax (a 1031 exchange can defer both). Figures are a year-1 estimate at your 24.0% rate — not tax advice; consult a CPA.
Schools (NCES district)
- District
- Dayton Independent
- NCES district ID
- 2101530
- Math proficiency
- 23% ▼ -13.00%
- Reading proficiency
- 32% ▼ -12.00%
- Median HH income
- $38,533
- Composite
- 23.0/100
- National rank
- #7978
- State rank
- #129 of 165 in KY
Livability — Dayton
- Score
- 81/100
- State rank
- #67
- US rank
- #1485
Category grades
Schools grade is shown separately in the Schools card above.
Census & demographics
- Census place
- Dayton, KY
- County
- Campbell County · 84,793 people
- City population
- 5,756
- Metro
- Cincinnati, OH-KY-IN
- Population (ZIP)
- 5,756
- Household income
- $66,087
- Rent vs Own
- Severe rent burden
- 215.0
Population outlook (Campbell County) Hauer SSP2
- Today (2025)
- 95,668 people
- By 2030
- 96,886 · +1.3%
- By 2040
- 97,734 · +2.2%
- By 2050
- 96,413 · +0.8%
- By 2075
- 90,211 · -5.7%
- By 2100
- 79,434 · -17.0%
Race, ethnicity, and origin ACS 2023
- Neighborhood character
- Predominantly White (89%)
- Race & ethnicity
- White 89% Two or more races 7% Hispanic / Latino 3% Black 1%
- Common ancestry
- Slovak 5% Italian 3% Lithuanian 2%
- Foreign-born
- 2% · Canada
- Languages at home
- 98% English-only · Spanish 1%
Political lean MEDSL · Campbell
- 2024 margin
- R (+19.7) · D 39.2% · R 58.9% · Other 1.9%
- 2008→2024 swing
- +1.2pp toward D · 2008: -20.9pp · 2024: -19.7pp
- All cycles
- 2024: R+19.7 2020: R+18.6 2016: R+24.5 2012: R+22.8 2008: R+20.9
Not yet ingested
- Civics
- —
Market trends
- HPI YoY
- ▼ -171.48%
- Current HPI
- 235.1437
- Rent YoY
- ▲ 7.15%
- Metro
- Cincinnati, OH-KY-IN
- State GDP YoY
- ▲ 1.81%
- F500 in state
- 4
Industry mix (Fortune 500 HQ in KY)
| Industry | F500 HQs | Revenue |
|---|---|---|
| Healthcare | 1 | $118B |
|
||
| Food / Beverage | 1 | $7B |
|
||
Price history
+305.9% since first listed13 events — show timeline
- 2026-03-11 Listed $129,900 NKMLS
- 2015-09-18 Sold (MLS) $10,000 NKMLS
- 2015-07-10 Listed $24,900 NKMLS
- 2015-06-29 Listing Removed — NKMLS
- 2015-01-27 Listed $29,900 NKMLS
- 2014-10-01 Listing Removed — NKMLS
- 2013-08-06 Listed $65,000 NKMLS
- 2007-11-30 Sold (Public Records) $17,000 Public Records
- 2007-11-30 Sold (Public Records) $17,000 Public Records
- 2007-11-20 Sold (MLS) $17,000 NKMLS
- 2007-07-20 Listed $24,000 NKMLS
- 2005-02-19 Listing Removed — NKMLS
- 2004-08-19 Listed $32,000 NKMLS
Property tax history
+1.5%/yrLatest (2025): $843 · +0.5% YoY. Source: county tax records.
Cash-flow waterfall
monthlySold comps — $/sqft
last 12 mo · ≤1 miLoading sold comps…