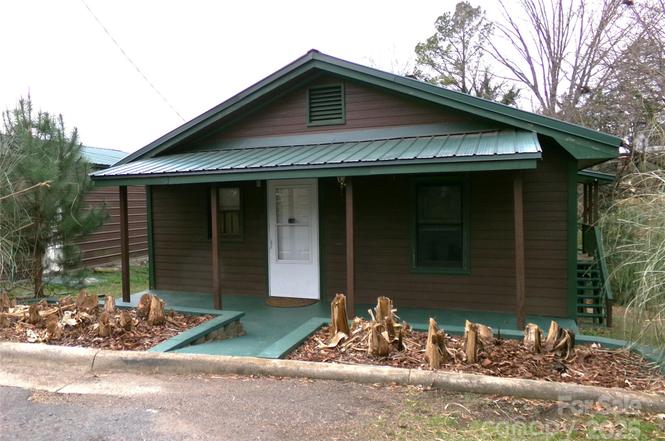
306 Dunlap St · Albemarle, NC
Flood risk 9/10 · Severe
- FEMA flood zone
- X (unshaded)
- Chance of flooding over 30 yrs
- 0.99%
- Est. flood insurance / yr
- $507 – $1,088
Fire risk 1/10 · Minimal
- Est. fire insurance / yr
- $906 – $1,684
Heat risk 6/10 · Moderate
- Hot days now (above 106°F)
- 7 days/yr
- Hot days in 30 yrs
- 16 days/yr
Wind risk 6/10 · Moderate
- Chance of severe wind over 30 yrs
- 27.0%
Air-quality risk 3/10 · Minor
- Unhealthy air days now
- 2 days/yr
- Unhealthy air days in 30 yrs
- 3 days/yr
Risk factors via First Street. Map © Google.
Why this score? — see what drove the C- grade
The composite is a weighted blend of 9 inputs, each scored 0–100. Each bar is that input's sub-score; the figure is the points it added to the 100-point composite (weight × sub-score).
- Cash flow +17.6/30.0
- ARV discount +15.0/15.0
- DSCR +5.5/10.0
- 1% rule +4.8/10.0
- Schools +3.4/10.0
- Livability +3.4/5.0
- Rent growth +2.5/5.0
- Condition / age +2.5/5.0
- Appreciation +0.0/10.0
$128,000
🖨 Deal sheet (PDF) 📄 Offer letter ✓ Due diligence
Listing remarks MLS
Great investment property. New paint and floor coverings make this property move-in ready.
Key facts
- In sink dishwasher
- Laundry area
- Remodeled cabinetry
Tags
Property features AI
Finance
- Other: No community amenities listed; No horse amenities
- HOA & community: No HOA
Exterior
- Parking: Detached 2-car garage (approx. 780 sq ft)
- Utilities: City water; Public sewer; Cable available
- Home design: Single-family residence; Site-built construction; One story; Zoned R-8
- Construction: Wood construction; Metal roof; Crawl space foundation; Built in (site built)
- Exterior features: Front porch; Side porch; Creek frontage; Hilly lot; Asphalt / paved public road access
Interior
- Kitchen: Electric range; Exhaust fan / hood; Refrigerator
- Bedrooms: 2 bedrooms on the main level
- Flooring: Carpet; Vinyl
- Bathrooms: 1 full bathroom on the main level
- Heating & cooling: Central heating (forced air) powered by natural gas; Central air conditioning; Ceiling fans
- Interior features: Built-in features; Ceiling fans in multiple rooms; Six total rooms
- Laundry & utility: Dedicated laundry room; Washer and dryer included; Dryer
Neighborhood map
What this means for you Summary
Snapshot
- This is a 2-bed/1.0-bath single-family listed at $128k.
Deal economics
- At list price, monthly cash flow is $35 ($419/yr) — positive.
- The deal already cash-flows at list — no discount required.
- To meet the 1% rule (rent ≥ 1% of price), the offer needs to be $125k (2.5% below list).
- Recommended offer: $113k (12.0% below list) — sets the bar for market timing.
- Cap rate 7.2% vs local median 3.3% in Albemarle — top-decile yield for the area; either an underpriced asset or a hidden risk that comps aren't pricing in. Stress-test before assuming the spread holds.
Location & tenants
- Location reads 68/100 on livability (#167 in NC) — a middle-class / working-renter tenant base. Strengths: cost of living A+, housing A+, health & safety A+; Watch: crime D-, amenities F, commute F.
- Stanly County Schools (rural): math 38% / reading 42% proficiency, ranked #113 of 178 in NC (top 64%) — families likely to look elsewhere, expect single-tenant / working-renter base with shorter leases.
- Zoned schools: Central Elementary (math 25% / reading 26%, grade F, #1,093 of 1,410 statewide, top 78%, 546 students, 100% FRL); Albemarle Middle (math 22% / reading 35%, grade F, #355 of 475 statewide, top 76%, 409 students, 99% FRL); Albemarle High (math 42% / reading 27%, grade F, #427 of 535 statewide, top 81%, 390 students, 97% FRL) — zoned schools average 98% FRL vs 46% district-wide (52 pts higher); higher-poverty schools than district average — tighter screening recommended.
- Market conditions: 278 active listings in the ZIP; 12 comparable units currently listed for rent nearby; rentals at typical pace (median 26d on market — plan ~3-4 weeks tenant-placement turnaround); 367 units permitted in Stanly County in 2024 (0 in 5+ unit buildings).
Forward outlook
- Local home prices are declining (-3.0%/yr); year-one equity from $885 of loan paydown is wiped out by about $4k of value loss. Plan a longer hold.
- Stanly County population projected at -10% by 2050 — secular population decline; favor cash flow + early exit over multi-decade hold.
Negotiation context
- It's been on market 297 days — a 12% lower offer ($113k) is reasonable based on typical stale-listing flexibility.
- 3 sale attempts since 12y ago; this cycle's ask has dropped $31k (19%) from the opening price — seller is motivated, your offer sets the floor, not the list.
- Current owner paid $20k; list at $128k implies a 540% gain — meaningful room to come down on a strong offer.
Risks & watch-outs
- Watch-outs: flood insurance adds $66/mo; built in 1910 — expect roof / HVAC / electrical / plumbing capex.
- Climate carrying-cost: severe flood risk; major wind risk, 27% chance of damaging wind over 30y; extreme-heat days projected 7→16/yr by 2055 (HVAC capex compounding) — expect insurance premiums to compound above CPI over the hold.
Questions for the listing agent
- It's been on market 297 days. Have you received any prior offers? Is the seller open to a 12% concession, seller financing, or rate buy-down credit?
- Built in 1910 — when were the roof, HVAC, electrical panel, plumbing, and water heater last replaced?
- What's the actual annual flood-insurance premium (NFIP or private), and is the property in a SFHA with mandatory coverage?
- Why hasn't it sold? Are there any deal-killer items the seller is aware of (foundation, flood, title, zoning, code violations)?
- Is there a deadline driving the sale (1031 exchange, divorce, estate, relocation)? That informs how much negotiation room exists.
- Schools are D-rated, which usually means shorter tenancies and higher turnover. Who's the typical renter profile here, and what's been the actual vacancy rate?
- Crime grade is D in this area — have there been break-ins, vandalism, or insurance claims at this property in the last 3 years? What carrier currently insures it and at what premium?
- What's the average days-on-market for RENTAL listings here right now (not sales)? A rising rental-DOM trend means longer vacancies and softer asking-rent achievability than the comps imply.
- What's the recent tenant-quality profile in this submarket — average credit score on applications, eviction rate, late-payment / NSF rate, and stable-employment percentage? A property-management company in the area should have these aggregated.
- How much new for-sale + rental construction is in the pipeline within 1–3 miles? Heavy new supply typically softens prices + rents 12–24 months out; constrained supply supports both.
Investment metrics
- 1% rule
- 0.98% ✗
- Cap rate
- 7.24%
- Cash-on-cash
- 3.39%
- DSCR
- 1.15
- GRM
- 8.5
CMA / ARV
- ARV (on-the-fly)
- $158,112
- Comps found
- 12
Show comp detail 12 sales within ~0.75 mi
| Address | Dist | Beds/Ba | Sqft | Sold | Price | $/sf | Match |
|---|---|---|---|---|---|---|---|
| 1121 Lundix St | 0.28mi | 3/1.5 (+1) | 900 (+4%) | 0mo | $140,000 | $156 | 73 |
| 1224 Bailey St | 0.34mi | 2/1.0 | 921 (+7%) | 0mo | $82,000 | $89 | 73 |
| 416 Richardson St | 0.31mi | 3/2.0 (+1) | 870 (+1%) | 5mo | $182,500 | $210 | 71 |
| 520 Waddell Dr | 0.35mi | 2/1.0 | 914 (+6%) | 13mo | $166,000 | $182 | 63 |
| 529 Colston St | 0.27mi | 2/1.0 | 815 (-6%) | 22mo | $97,500 | $120 | 60 |
| 426 Lincoln St | 0.19mi | 2/1.0 | 759 (-12%) | 19mo | $128,000 | $169 | 55 |
| 616 Lee St | 0.51mi | 2/1.0 | 765 (-12%) | 6mo | $140,000 | $183 | 52 |
| 221 8th Street None | 0.40mi | 2/1.0 | 945 (+9%) | 17mo | $194,900 | $206 | 52 |
| 415 Peachtree St | 0.68mi | 3/1.0 (+1) | 936 (+8%) | 9mo | $185,000 | $198 | 42 |
| 754 S 5th St | 0.71mi | 2/1.0 | 748 (-13%) | 4mo | $161,500 | $216 | 42 |
| 402 Peachtree St | 0.66mi | 2/1.0 | 804 (-7%) | 23mo | $160,000 | $199 | 39 |
| 808 S 4th St | 0.68mi | 2/1.0 | 991 (+15%) | 7mo | $75,000 | $76 | 38 |
Match score weights: distance 35% · size 25% · config 20% · recency 20%. Top-matched comps best support the ARV.
Projected returns pro-forma
-3.0% appreciation · 3.0% rent growth · sell at horizon
- IRR
- -14.4%
- Equity multiple
- 0.48×
- Total profit
- $-18,459
- Equity at exit
- $19,085
- IRR
- -5.6%
- Equity multiple
- 0.64×
- Total profit
- $-12,969
- Equity at exit
- $11,067
Cash invested: $35,840 (down + closing). Projections, not guarantees.
Landlord ↔ Tenant lean methodology
- Overall (STATE)
- 85 Strongly Landlord-Friendly
- State North Carolina
- 85 Strongly Landlord-Friendly · R+3
- County
- — inherits STATE
- City
- — inherits STATE
ZIP-level market 28001
- Home prices YoY
- -33.1%
- Active inventory
- 278
- Price-to-rent
- 8.5×
Monthly cashflow live
- Estimated rent
- $1,248 high interval (Pro) →
- Mortgage (P&I)
- −$671
- Tax est. 1.5%
- −$160 /mo · $1,920/yr
- Insurance
- −$53
- Flood insurance flood zone
- −$66 /mo · $798/yr
- HOA
- −$0
- Vacancy / Maint / Mgmt
- −$262
- Net cashflow
- $35
Break-even live
Sensitivity live
| Price | -10% $123 | -5% $79 | +0% $35 | +5% $-9 | +10% $-54 |
|---|---|---|---|---|---|
| Rent | -10% $-64 | -5% $-14 | +0% $35 | +5% $84 | +10% $133 |
| Rate | -1.0pp $99 | -0.5pp $67 | base $35 | +0.5pp $2 | +1.0pp $-32 |
UW: 25.0% down · 7.5% · 30yr · 1.5% tax · 5.0% vac · 8.0% maint · 8.0% mgmt
Financing live
Cash to close
- Down payment
- $32,000
- Closing costs
- $3,840
- Reserves months
- —
- Total cash needed
- —
Loan-product check · same deal, 3 products live
Conventional
25% down · 7.5% · 30yr
- Down + closing
- —
- Monthly P&I
- —
- Monthly cashflow
- —
- DSCR
- —
- Eligible?
- —
Personal DTI + credit; lowest rate.
DSCR
20% down · 8.5% · 30yr
- Down + closing
- —
- Monthly P&I
- —
- Monthly cashflow
- —
- DSCR
- —
- Eligible?
- —
No personal income docs; deal must DSCR.
Hard money
10% down · 12.0% · 12mo
- Down + closing
- —
- Monthly P&I
- —
- Monthly cashflow
- —
- DSCR
- —
- Eligible?
- —
Short-term bridge; refi at stabilization.
Rent comps 12 comps
| Address | Beds | Baths | Sqft | Rent | $/sqft | DOM | Units | Dist |
|---|---|---|---|---|---|---|---|---|
| 435 Davis St Albemarle, NC | 2.0 | 1.0 | 576 | $895 | $1.55 | 25d | 1 | 0.26mi |
| 117 N 6th St Albemarle, NC | 1.0 | 1.0 | 739 | $950 | $1.29 | 25d | 1 | 0.32mi |
| 121 Heath St Apt 16 Albemarle, NC | 2.0 | 1.0 | 750 | $995 | $1.33 | 14d | 1 | 0.33mi |
| 412 N 4th St Albemarle, NC | 2.0 | 1.5 | 820 | $1,400 | $1.71 | 25d | 1 | 0.67mi |
| 255 N 3rd St Albemarle, NC | 2.0 | 2.0 | 1100 | $1,000 | $0.91 | 25d | 1 | 0.71mi |
| 197 N 2nd St Albemarle, NC | 2.0 | 1.0 | 1100 | $2,365 | $2.15 | 25d | 1 | 0.72mi |
| 197 N 2nd St Unit 005 Albemarle, NC | 1.0 | 1.0 | 733 | $1,225 | $1.67 | 25d | 1 | 0.72mi |
| 197 N 2nd St Unit 301 Albemarle, NC | 1.0 | 1.0 | 872 | $1,800 | $2.06 | 25d | 1 | 0.72mi |
| 404 Moss Springs Rd Albemarle, NC | 2.0 | 2.0 | 999 | $1,700 | $1.70 | 25d | 1 | 0.73mi |
| 100 Fairway St Unit 37 Albemarle, NC | 2.0 | 1.5 | 878 | $925 | $1.05 | 22d | 1 | 0.84mi |
| 330 N Depot St Albemarle, NC | 2.0 | 1.0 | 950 | $1,350 | $1.42 | 6d | 1 | 0.96mi |
| 1110 Magnolia St Albemarle, NC | 1.0 | 1.0 | 708 | $1,525 | $2.15 | 14d | 1 | 1.01mi |
Listing history 26 events
-
2026-06-21days on market $128,000 Active 297 DOM
-
2026-06-18days on market $128,000 Active 294 DOM
-
2026-06-17days on market $128,000 Active 293 DOM
-
2026-06-16days on market $128,000 Active 292 DOM
-
2026-06-15days on market $128,000 Active 291 DOM
-
2026-06-13days on market $128,000 Active 289 DOM
-
2026-06-09days on market $128,000 Active 285 DOM
-
2026-06-08days on market $128,000 Active 284 DOM
-
2026-06-07days on market $128,000 Active 283 DOM
-
2026-06-04days on market $128,000 Active 280 DOM
-
2026-06-03days on market $128,000 Active 279 DOM
-
2026-06-02days on market $128,000 Active 278 DOM
-
2026-06-02remarks 611-char remark
-
2026-06-02pricestatus $128,000 Active 277 DOM
-
2026-06-01days on market $148,600 Active Under Contract 277 DOM
-
2026-05-31days on market $148,600 Active Under Contract 276 DOM
-
2026-05-06historical Active Under Contract
-
2026-04-01price $148,600
-
2025-12-01status Active
-
2025-08-27$158,600 Active
-
2014-12-30soldstatus $20,000 Closed 91-char remark
Show marketing remark (91 chars)
Great investment property. New paint and floor coverings make this property move-in ready.
-
2014-12-10historical Under Contract - Show 91-char remark
Show marketing remark (91 chars)
Great investment property. New paint and floor coverings make this property move-in ready.
-
2014-11-17price $23,000 91-char remark
Show marketing remark (91 chars)
Great investment property. New paint and floor coverings make this property move-in ready.
-
2014-10-28price $26,000 91-char remark
Show marketing remark (91 chars)
Great investment property. New paint and floor coverings make this property move-in ready.
-
2014-07-10$28,000 Active 91-char remark
Show marketing remark (91 chars)
Great investment property. New paint and floor coverings make this property move-in ready.
-
2003-06-12soldstatus $55,000
ⓘ Source: listings_history table (triggers on properties + properties_extension) + one-shot
backfill from property_details.listing_events for pre-trigger history.
Climate risk First Street
- Flood 9/10 Extreme FEMA zone X (unshaded) · 99% chance over 30 yrs
- Wildfire 1/10 Low
- Heat 6/10 Major 7 d/yr ≥106°F today · 16 d/yr by 30 yrs out
- Wind 6/10 Major 27% chance of damaging wind over 30 yrs
- Air quality 3/10 Moderate 2 unhealthy d/yr today · 3 by 30 yrs out
Nearby sold comps map
Loading sold comps map…
Walkable amenities ~0.75 mi
Loading nearby amenities…
Taxation est. · year 1
- Rental income
- $14,976
- − Mortgage interest
- −$7,170
- − Property taxes
- −$1,920
- − Insurance
- −$1,438
- − Repairs & maintenance
- −$1,198
- − Management
- −$1,198
- − Depreciation
- −$3,724
- Taxable loss
- −$1,671
- Est. tax savings @ 24.0%
- +$401
- After-tax cash flow
- $820/yr
For passive investors: Depreciation is non-cash, so a rental often shows a tax loss while cash-flowing — sheltering income. Rental losses are passive: they offset passive income freely, and up to $25,000/yr can offset ordinary (W-2) income if you actively participate and your MAGI is under $100k (phasing out to $0 by $150k); unused losses carry forward. On sale, claimed depreciation is recaptured at up to 25%, and gains may owe capital-gains tax (a 1031 exchange can defer both). Figures are a year-1 estimate at your 24.0% rate — not tax advice; consult a CPA.
Schools (NCES district)
- District
- Stanly County Schools
- NCES district ID
- 3704320
- Math proficiency
- 38% ▼ -1.00%
- Reading proficiency
- 42% ▲ 1.00%
- Median HH income
- $43,802
- Composite
- 33.9/100
- National rank
- #5343
- State rank
- #113 of 178 in NC
Livability — Albemarle
- Score
- 68/100
- State rank
- #167
- US rank
- #8957
Category grades
Schools grade is shown separately in the Schools card above.
Census & demographics
- Census place
- Albemarle, NC
- City population
- 26,187
- Population (ZIP)
- 26,187
Population outlook (Stanly County) Hauer SSP2
- Today (2025)
- 60,082 people
- By 2030
- 59,485 · -1.0%
- By 2040
- 57,407 · -4.5%
- By 2050
- 54,051 · -10.0%
- By 2075
- 45,384 · -24.5%
- By 2100
- 34,694 · -42.3%
Race, ethnicity, and origin ACS 2023
- Neighborhood character
- Predominantly White (75%)
- Race & ethnicity
- White 75% Black 15% Hispanic / Latino 5% Two or more races 3% Asian 3%
- Hispanic origin (detail)
- Mexican 4%
- Common ancestry
- Serbian 3% Slovak 2% Italian 1%
- Foreign-born
- 4% · Canada, Vietnam
- Languages at home
- 93% English-only · Spanish 4% Other Asian/Pacific 2% Vietnamese 1%
Political lean MEDSL · Stanly
- 2024 margin
- Solid R (+50.9) · D 24.2% · R 75.1%
- 2008→2024 swing
- -14.2pp toward R · 2008: -36.7pp · 2024: -50.9pp
- All cycles
- 2024: R+50.9 2020: R+51.1 2016: R+50.2 2012: R+40.4 2008: R+36.7
Not yet ingested
- Civics
- —
Market trends
- HPI YoY
- ▼ -109.68%
- Current HPI
- 221.8601
- Rent YoY
- —
- Metro
- —
- State GDP YoY
- ▲ 3.28%
- F500 in state
- 26
Industry mix (Fortune 500 HQ in NC)
| Industry | F500 HQs | Revenue |
|---|---|---|
| Financial Services | 2 | $213B |
|
||
| Retail | 2 | $95B |
|
||
| Industrial Conglomerate | 1 | $38B |
|
||
| Metals / Steel | 1 | $35B |
|
||
| Utilities | 1 | $30B |
|
||
| Industrial Machinery | 1 | $19B |
|
||
Price history
+170.2% since first listed10 events — show timeline
- 2026-05-06 Contingent — CANOPYMLS as Distributed by MLS Grid
- 2026-04-01 Price Changed $148,600 CANOPYMLS as Distributed by MLS Grid
- 2025-12-01 Relisted — CANOPYMLS as Distributed by MLS Grid
- 2025-08-27 Listed $158,600 CANOPYMLS as Distributed by MLS Grid
- 2014-12-30 Sold (MLS) $20,000 CANOPYMLS as Distributed by MLS Grid
- 2014-12-10 Contingent — CANOPYMLS as Distributed by MLS Grid
- 2014-11-17 Price Changed $23,000 CANOPYMLS as Distributed by MLS Grid
- 2014-10-28 Price Changed $26,000 CANOPYMLS as Distributed by MLS Grid
- 2014-07-10 Listed $28,000 CANOPYMLS as Distributed by MLS Grid
- 2003-06-12 Sold (Public Records) $55,000 Public Records
Property tax history
-3.3%/yrLatest (2025): $212 · -22.5% YoY. Source: county tax records.
Cash-flow waterfall
monthlySold comps — $/sqft
last 12 mo · ≤1 miLoading sold comps…