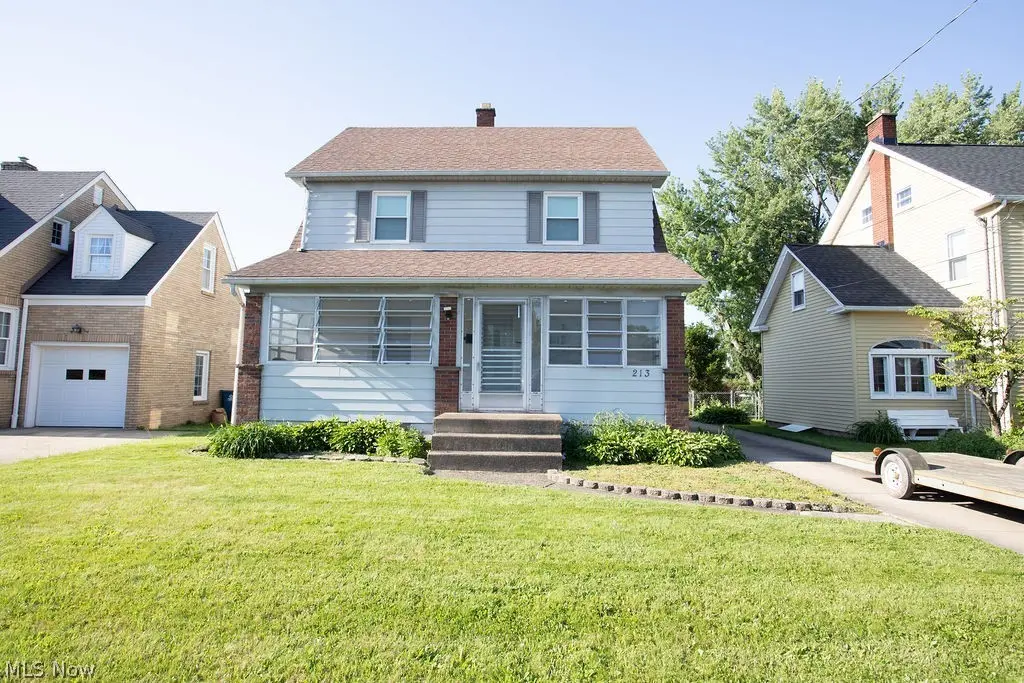
213 Como St · Struthers, OH
Flood risk 1/10 · Minimal
- FEMA flood zone
- X (unshaded)
- Chance of flooding over 30 yrs
- 0.0%
- Est. flood insurance / yr
- $473 – $860
Fire risk 1/10 · Minimal
- Est. fire insurance / yr
- $713 – $1,323
Heat risk 3/10 · Minor
- Hot days now (above 96°F)
- 7 days/yr
- Hot days in 30 yrs
- 17 days/yr
Wind risk 1/10 · Minimal
- Chance of severe wind over 30 yrs
- —
Air-quality risk 2/10 · Minimal
- Unhealthy air days now
- 1 days/yr
- Unhealthy air days in 30 yrs
- 3 days/yr
Risk factors via First Street. Map © Google.
Why this score? — see what drove the C+ grade
The composite is a weighted blend of 9 inputs, each scored 0–100. Each bar is that input's sub-score; the figure is the points it added to the 100-point composite (weight × sub-score).
- Cash flow +23.5/30.0
- ARV discount +11.5/15.0
- DSCR +7.6/10.0
- 1% rule +5.6/10.0
- Schools +4.0/10.0
- Livability +3.6/5.0
- Appreciation +2.9/10.0
- Rent growth +2.5/5.0
- Condition / age +2.5/5.0
$164,900
🖨 Deal sheet 📄 Offer letter ✓ Due diligence
Listing remarks MLS
This home is a Beauty! The interior is meticulously maintained. Huge Rooms! Living room with tall ceilings, fireplace, hardwood floors, and beveled glass French doors to the formal dining room with hardwood floors and a built-in china cabinet with leaded glass details. Large ceramic tiled kitchen. Enclosed front and back porches. 3 bedrooms and updated full bath on the 2nd floor. Walk up 3rd floor attic is a potential 4th bedroom or family room. Full basement! 2 car detached garage with new garage door. Home Warranty is included for a worry-free purchase! Call today to schedule a private tour!
Key facts
- Second bathroom
- Enclosed front porch
- Dry basement
Tags
Property features AI
Finance
- Other: Has home warranty
Exterior
- Parking: Detached garage; 2-car garage; Driveway; Garage faces front; Garage door opener; Lighted driveway/garage; Electricity in garage; Storage and workshop space in garage
- Security: Smoke detectors; Carbon monoxide detectors
- Utilities: Public water; Public sewer
- Home design: Faces south
- Construction: Aluminum siding; Asphalt roof; Full concrete basement (unfinished) with bath stubbed and storage
- Exterior features: Rear porch; Front porch; Glass-enclosed porch; Enclosed deck/patio; Deck; Patio; Porch; Front yard; Back yard; Fenced perimeter (full backyard); City lot; Irregular lot
Interior
- Kitchen: Range; Microwave; Refrigerator; Disposal
- Bathrooms: 1 full bathroom; 1 half bathroom
- Heating & cooling: Forced air gas heating; Central air conditioning; Ceiling fan(s)
- Interior features: Built-in features; Ceiling fans; Crown molding; High ceilings; Laminate counters; Storage; Natural woodwork; Double-pane windows; Blinds
- Laundry & utility: Washer hookup; Dryer; Gas dryer hookup; Laundry tub/sink in basement/lower level
Neighborhood map
What this means for you Summary
Snapshot
- This is a 3-bed/1.5-bath single-family listed at $165k.
Deal economics
- At list price, monthly cash flow is $309 ($4k/yr) — positive.
- The deal already cash-flows at list — no discount required.
- Meets the 1% rule at list price ($2k rent vs $165k).
- Cap rate 8.5% vs local median 6.4% in Struthers — top-decile yield for the area; either an underpriced asset or a hidden risk that comps aren't pricing in. Stress-test before assuming the spread holds.
Location & tenants
- Location reads 71/100 on livability (#418 in OH) — a middle-class / working-renter tenant base. Strengths: cost of living A+, housing A+, crime B; Watch: commute C-, amenities F, employment F.
- Struthers City (suburban): math 45% / reading 52% proficiency, ranked #475 of 656 in OH (top 72%) — families likely to look elsewhere, expect single-tenant / working-renter base with shorter leases.
- Market conditions: 66 active listings in the ZIP; 4 comparable units currently listed for rent nearby; rentals leasing fast (median 13d on market — plan ~1-2 weeks tenant-placement turnaround); 147 units permitted in Mahoning County in 2024 (0 in 5+ unit buildings).
- This rent runs 40% of the median local income ($53k/yr) — at the standard rent-burdened threshold; future hikes will face affordability resistance.
Forward outlook
- Local home prices are declining (-3.0%/yr); year-one equity from $1k of loan paydown is wiped out by about $5k of value loss. Plan a longer hold.
- Mahoning County population projected at -14% by 2050 — secular population decline; favor cash flow + early exit over multi-decade hold.
Negotiation context
- Only 11 days on market — expect competitive offers; lowballing is unlikely to land.
- 8 sale attempts since 18y ago with the ask held roughly flat each time — persistent listings suggest the price (not the market) is what's stuck; bring a comps-based counter.
- Current owner paid $71k; list at $165k implies a 133% gain — meaningful room to come down on a strong offer.
Risks & watch-outs
- Watch-outs: built in 1932 — expect roof / HVAC / electrical / plumbing capex.
Questions for the listing agent
- Built in 1932 — when were the roof, HVAC, electrical panel, plumbing, and water heater last replaced?
- Is there a deadline driving the sale (1031 exchange, divorce, estate, relocation)? That informs how much negotiation room exists.
- Schools are B-rated — typically a magnet for longer-tenancy family renters. What's the average tenant stay here, and is there a school-zone premium baked into asking?
- What's the average days-on-market for RENTAL listings here right now (not sales)? A rising rental-DOM trend means longer vacancies and softer asking-rent achievability than the comps imply.
- What's the recent tenant-quality profile in this submarket — average credit score on applications, eviction rate, late-payment / NSF rate, and stable-employment percentage? A property-management company in the area should have these aggregated.
- How much new for-sale + rental construction is in the pipeline within 1–3 miles? Heavy new supply typically softens prices + rents 12–24 months out; constrained supply supports both.
Investment metrics
- 1% rule
- 1.06% ✓
- Cap rate
- 8.54%
- Cash-on-cash
- 8.03%
- DSCR
- 1.36
- GRM
- 7.9
CMA / ARV
- ARV (on-the-fly)
- $181,034
- Comps found
- 12
Show comp detail 12 sales within ~0.75 mi
| Address | Dist | Beds/Ba | Sqft | Sold | Price | $/sf | Match |
|---|---|---|---|---|---|---|---|
| 227 E Wilson St | 0.07mi | 3/1.0 | 1,365 (+1%) | 1mo | $187,000 | $137 | 92 |
| 93 Morrison St | 0.31mi | 3/1.5 | 1,360 (+1%) | 6mo | $135,000 | $99 | 80 |
| 32 Como St | 0.34mi | 3/2.5 | 1,358 (+0%) | 1mo | $115,000 | $85 | 79 |
| 42 E Wilson St | 0.32mi | 3/2.0 | 1,409 (+4%) | 2mo | $155,000 | $110 | 74 |
| 556 Idora Ln | 0.58mi | 3/1.5 | 1,326 (-2%) | 1mo | $198,000 | $149 | 69 |
| 281 Sexton St | 0.36mi | 3/1.0 | 1,248 (-8%) | 1mo | $175,000 | $140 | 68 |
| 24 Sexton St | 0.47mi | 3/1.0 | 1,440 (+7%) | 1mo | $105,000 | $73 | 64 |
| 537 7th St | 0.65mi | 3/1.0 | 1,280 (-5%) | 3mo | $153,500 | $120 | 56 |
| 2451 W Manor Ave | 0.58mi | 3/2.0 | 1,245 (-8%) | 2mo | $209,900 | $169 | 56 |
| 536 Creed St | 0.62mi | 3/1.0 | 1,272 (-6%) | 4mo | $170,000 | $134 | 56 |
| 101 Ridgeway St | 0.71mi | 3/2.0 | 1,536 (+14%) | 1mo | $136,000 | $89 | 41 |
| 587 Edison St | 0.71mi | 2/2.0 (-1) | 1,163 (-14%) | 2mo | $160,000 | $138 | 35 |
Match score weights: distance 35% · size 25% · config 20% · recency 20%. Top-matched comps best support the ARV.
Projected returns pro-forma
-3.0% appreciation · 3.0% rent growth · sell at horizon
- IRR
- -4.1%
- Equity multiple
- 0.85×
- Total profit
- $-7,050
- Equity at exit
- $24,587
- IRR
- 5.6%
- Equity multiple
- 1.41×
- Total profit
- $19,139
- Equity at exit
- $14,258
Cash invested: $46,172 (down + closing). Projections, not guarantees.
Landlord ↔ Tenant lean methodology
- Overall (STATE)
- 73 Landlord-Friendly
- State Ohio
- 73 Landlord-Friendly · R+6
- County
- — inherits STATE
- City
- — inherits STATE
ZIP-level market 44471
- Home prices YoY
- -1.5%
- Active inventory
- 66
- Price-to-rent
- 7.9×
Monthly cashflow live
- Estimated rent
- $1,742 medium interval (Pro) →
- Mortgage (P&I)
- −$865
- Tax from tax record
- −$133 /mo · $1,601/yr
- Insurance
- −$69
- HOA
- −$0
- Vacancy / Maint / Mgmt
- −$366
- Net cashflow
- $309
Break-even live
UW: 25.0% down · 7.5% · 30yr · 1.5% tax · 5.0% vac · 8.0% maint · 8.0% mgmt
Financing live
Cash to close
- Down payment
- $41,225
- Closing costs
- $4,947
- Reserves months
- —
- Total cash needed
- —
Loan-product check · same deal, 3 products live
Conventional
25% down · 7.5% · 30yr
- Down + closing
- —
- Monthly P&I
- —
- Monthly cashflow
- —
- DSCR
- —
- Eligible?
- —
Personal DTI + credit; lowest rate.
DSCR
20% down · 8.5% · 30yr
- Down + closing
- —
- Monthly P&I
- —
- Monthly cashflow
- —
- DSCR
- —
- Eligible?
- —
No personal income docs; deal must DSCR.
Hard money
10% down · 12.0% · 12mo
- Down + closing
- —
- Monthly P&I
- —
- Monthly cashflow
- —
- DSCR
- —
- Eligible?
- —
Short-term bridge; refi at stabilization.
Rent comps 4 comps
| Address | Beds | Baths | Sqft | Rent | $/sqft | DOM | Units | Dist |
|---|---|---|---|---|---|---|---|---|
| 465 W Omar St Struthers, OH | 3.0 | 2.0 | 1544 | $1,800 | $1.17 | 13d | 1 | 0.58mi |
| 610 Elm St Struthers, OH | 3.0 | 1.0 | 1050 | $1,500 | $1.43 | 13d | 1 | 0.87mi |
| 4807 Sheridan Rd Youngstown, OH | 3.0 | 1.5 | 1586 | $1,750 | $1.10 | 13d | 1 | 1.16mi |
| 1914 S Heights Ave Youngstown, OH | 3.0 | 1.0 | 1115 | $1,950 | $1.75 | 43d | 1 | 1.41mi |
Listing history 10 events
-
2026-06-19days on market $164,900 Active 11 DOM
-
2026-06-18days on market $164,900 Active 10 DOM
-
2026-06-17days on market $164,900 Active 9 DOM
-
2026-06-16days on market $164,900 Active 8 DOM
-
2026-06-15days on market $164,900 Active 7 DOM
-
2026-06-14days on market $164,900 Active 5 DOM
-
2026-06-13days on market $164,900 Active 4 DOM
-
2026-06-10days on market $164,900 Active 2 DOM
-
2026-06-09remarks 699-char remark
-
2026-06-09$164,900 Active 1 DOM
ⓘ Source: listings_history table (triggers on properties + properties_extension) + one-shot
backfill from property_details.listing_events for pre-trigger history.
Tax reassessment forecast OH · Partial reset (capped growth)
- Current annual tax
- $1,601 · $133/mo
- Projected year-2 tax
- $2,087 · $174/mo
- Expected delta
- +$486/yr (+$40/mo · 30.3%)
ⓘ Screening estimate from a state-policy table — verify with the county assessor before closing.
Climate risk First Street
- Flood 1/10 Low FEMA zone X (unshaded) · 0% chance over 30 yrs
- Wildfire 1/10 Low
- Heat 3/10 Moderate 7 d/yr ≥96°F today · 17 d/yr by 30 yrs out
- Wind 1/10 Low
- Air quality 2/10 Low 1 unhealthy d/yr today · 3 by 30 yrs out
Nearby sold comps map
Loading sold comps map…
Walkable amenities ~0.75 mi
Loading nearby amenities…
Taxation est. · year 1
- Rental income
- $20,901
- − Mortgage interest
- −$9,237
- − Property taxes
- −$1,601
- − Insurance
- −$824
- − Repairs & maintenance
- −$1,672
- − Management
- −$1,672
- − Depreciation
- −$4,797
- Taxable income
- $1,098
- Est. tax owed @ 24.0%
- −$263
- After-tax cash flow
- $3,446/yr
For passive investors: Depreciation is non-cash, so a rental often shows a tax loss while cash-flowing — sheltering income. Rental losses are passive: they offset passive income freely, and up to $25,000/yr can offset ordinary (W-2) income if you actively participate and your MAGI is under $100k (phasing out to $0 by $150k); unused losses carry forward. On sale, claimed depreciation is recaptured at up to 25%, and gains may owe capital-gains tax (a 1031 exchange can defer both). Figures are a year-1 estimate at your 24.0% rate — not tax advice; consult a CPA.
Schools (NCES district)
- District
- Struthers City
- NCES district ID
- 3904485
- Math proficiency
- 45% ▼ -12.00%
- Reading proficiency
- 52% ▼ -8.00%
- Median HH income
- $37,753
- Composite
- 40.35/100
- National rank
- #3742
- State rank
- #475 of 656 in OH
Livability — Struthers
- Score
- 71/100
- State rank
- #418
- US rank
- #6867
Category grades
Schools grade is shown separately in the Schools card above.
Census & demographics
- Census place
- Struthers, OH
- County
- Mahoning · 224,175 people
- City population
- 10,296
- Metro
- Youngstown-Warren, OH
- Population (ZIP)
- 10,296
- Household income
- $52,811
- Rent vs Own
- Severe rent burden
- 12.2
Population outlook (Mahoning County) Hauer SSP2
- Today (2025)
- 223,932 people
- By 2030
- 218,387 · -2.5%
- By 2040
- 205,367 · -8.3%
- By 2050
- 193,606 · -13.5%
- By 2075
- 173,694 · -22.4%
- By 2100
- 151,147 · -32.5%
Race, ethnicity, and origin ACS 2023
- Neighborhood character
- Predominantly White (82%)
- Race & ethnicity
- White 82% Hispanic / Latino 8% Two or more races 8% Black 4% Asian 1%
- Hispanic origin (detail)
- Mexican 2% Puerto Rican 5%
- Common ancestry
- Romanian 8% Lithuanian 4% Slovak 1%
- Foreign-born
- 2% · Canada
- Languages at home
- 94% English-only · Spanish 4% Arabic 1% Other Indo-European 1%
Political lean MEDSL · Mahoning
- 2024 margin
- Lean R (+9.4) · D 44.9% · R 54.4%
- 2008→2024 swing
- -36.1pp toward R · 2008: 26.6pp · 2024: -9.4pp
- All cycles
- 2024: R+9.4 2020: R+1.9 2016: D+3.0 2012: D+27.7 2008: D+26.6
Not yet ingested
- Civics
- —
Market trends
- HPI YoY
- ▼ -4.12%
- Current HPI
- 274.6394
- Rent YoY
- —
- Metro
- —
- State GDP YoY
- ▲ 1.98%
- F500 in state
- 48
Industry mix (Fortune 500 HQ in OH)
| Industry | F500 HQs | Revenue |
|---|---|---|
| Insurance | 3 | $145B |
|
||
| Industrial Machinery | 3 | $49B |
|
||
| Financial Services | 3 | $24B |
|
||
| Consumer Goods | 2 | $93B |
|
||
| Aerospace / Defense | 2 | $47B |
|
||
| Utilities | 2 | $33B |
|
||
Price history
+106.4% since first listed19 events — show timeline
- 2026-06-08 Listed $164,900 MLSNOW
- 2018-04-17 Pending — MLSNOW
- 2018-04-10 Sold (Public Records) $70,900 Public Records
- 2018-04-09 Sold (MLS) $70,900 MLSNOW
- 2018-03-15 Contingent — MLSNOW
- 2018-01-31 Listed $69,900 MLSNOW
- 2017-12-31 Listing Removed — MLSNOW
- 2017-12-08 Price Changed $71,900 MLSNOW
- 2017-10-12 Listed $79,000 MLSNOW
- 2011-03-07 Listing Removed — MLSNOW
- 2010-09-17 Listed $69,000 MLSNOW
- 2010-02-28 Listing Removed — MLSNOW
- 2009-06-12 Listed $57,000 MLSNOW
- 2009-02-28 Listing Removed — MLSNOW
- 2008-10-16 Listed $64,900 MLSNOW
- 2008-10-15 Listing Removed — MLSNOW
- 2008-09-15 Listed $79,900 MLSNOW
- 2008-09-14 Listing Removed — MLSNOW
- 2008-03-07 Listed $79,900 MLSNOW
Property tax history
+8.4%/yrLatest (2025): $1,601 · -0.0% YoY. Source: county tax records.
Cash-flow waterfall
monthlySold comps — $/sqft
last 12 mo · ≤1 miLoading sold comps…