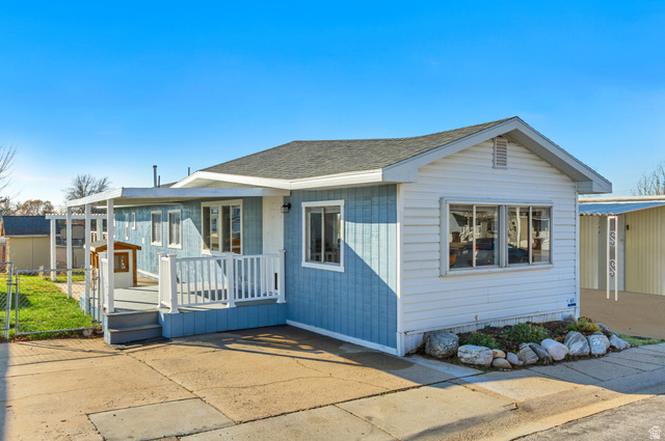
1239 W 400 N #63 · Clearfield, UT
Flood risk 1/10 · Minimal
- FEMA flood zone
- X (unshaded)
- Chance of flooding over 30 yrs
- 0.0%
- Est. flood insurance / yr
- $507 – $1,088
Fire risk 1/10 · Minimal
- Est. fire insurance / yr
- $453 – $841
Heat risk 4/10 · Minor
- Hot days now (above 93°F)
- 7 days/yr
- Hot days in 30 yrs
- 17 days/yr
Wind risk 1/10 · Minimal
- Chance of severe wind over 30 yrs
- —
Air-quality risk 4/10 · Minor
- Unhealthy air days now
- 5 days/yr
- Unhealthy air days in 30 yrs
- 7 days/yr
Risk factors via First Street. Map © Google.
Why this score? — see what drove the B- grade
The composite is a weighted blend of 9 inputs, each scored 0–100. Each bar is that input's sub-score; the figure is the points it added to the 100-point composite (weight × sub-score).
- Cash flow +26.9/30.0
- 1% rule +10.0/10.0
- DSCR +9.3/10.0
- ARV discount +7.5/15.0
- Schools +4.1/10.0
- Livability +3.9/5.0
- Rent growth +3.1/5.0
- Condition / age +2.5/5.0
- Appreciation +0.0/10.0
$49,900
🖨 Deal sheet 📄 Offer letter ✓ Due diligence
Listing remarks MLS
There are no remarks available.
Key facts
- Updated mobile home
- Laminate flooring
- Natural light
Tags
Property features AI
Finance
- HOA & community: Homeowners association with monthly fee; Association fee: $950 monthly; Community amenities: playground and pool; Subdivision: SUNDOWN
Exterior
- Parking: Carport (2 covered spaces); Total of 2 parking spaces
- Security: Fire alarm
- Utilities: Natural gas connected; Electricity connected; Sewer connected; Culinary (connected) water
- Home design: Manufactured home; Single-family zoning
- Construction: Aluminum construction materials; Aluminum roof; Built and standing
- Exterior features: Partially fenced yard; Paved road access; Sidewalks; Covered deck; Awnings; Outbuildings; Exterior lighting; Storage shed(s); Private pool
Interior
- Kitchen: Gas range; Updated kitchen
- Bedrooms: Three main-level bedrooms
- Flooring: Carpet; Laminate; Vinyl
- Bathrooms: One full bathroom
- Heating & cooling: Forced air gas central heating; Evaporative cooling
- Interior features: Updated kitchen; Gas range / free-standing range/oven; Fire alarm; Blinds and drapes; Alarm: Fire
- Laundry & utility: Electric dryer hookup
Neighborhood map
What this means for you Summary
Snapshot
- This is a 3-bed/1.0-bath manufactured listed at $50k.
Deal economics
- At list price, monthly cash flow is $139 ($2k/yr) — positive.
- The deal already cash-flows at list — no discount required.
- Meets the 1% rule at list price ($2k rent vs $50k).
- Recommended offer: $44k (12.0% below list) — sets the bar for market timing.
Location & tenants
- Location reads 78/100 on livability (#45 in UT, #2,413 nationally) — a middle-class / working-renter tenant base. Strengths: commute A+, housing A+, employment B+; Watch: amenities D-.
- Davis District (suburban): math 43% / reading 47% proficiency, ranked #28 of 80 in UT (top 35%) — families likely to look elsewhere, expect single-tenant / working-renter base with shorter leases; only 19% free/reduced lunch — higher-income household profile.
- Zoned schools: Holt School (math 25% / reading 22%, grade F, #494 of 585 statewide, top 85%, 458 students, 41% FRL); West Point Jr High (math 43% / reading 44%, grade D, #51 of 138 statewide, top 38%, 1,469 students, 15% FRL); Clearfield High (math 23% / reading 41%, grade F, #111 of 171 statewide, top 68%, 2,030 students, 22% FRL).
- Zoned-school proficiency averages 33% at this address vs 45% district-wide (-12 pts) — the specific schools serving this property underperform the Davis District average; the district grade overstates school quality for this exact location.
- Market conditions: Rents rising (+2.2%/yr); 387 active listings in the ZIP; 9 comparable units currently listed for rent nearby; rentals at typical pace (median 14d on market — plan ~3-4 weeks tenant-placement turnaround); solid renter incomes; 1,461 units permitted in Davis County in 2024 (508 in 5+ unit buildings).
Forward outlook
- Local home prices are declining (-3.0%/yr); year-one equity from $345 of loan paydown is wiped out by about $1k of value loss. Plan a longer hold.
- Davis County population projected at +39% by 2050 — long-run rental-demand tailwind backs the buy-and-hold thesis.
Negotiation context
- It's been on market 206 days — a 12% lower offer ($44k) is reasonable based on typical stale-listing flexibility.
- 2 sale attempts since 15y ago; this cycle's ask has dropped $5k (9%) from the opening price — seller is motivated, your offer sets the floor, not the list.
Risks & watch-outs
- Watch-outs: HOA is 52% of rent.
Questions for the listing agent
- It's been on market 206 days. Have you received any prior offers? Is the seller open to a 12% concession, seller financing, or rate buy-down credit?
- Built in 1973 — when were the roof, HVAC, electrical panel, plumbing, and water heater last replaced?
- What does the HOA fee cover, when was the last increase, and are there any pending special assessments or reserve-fund shortfalls?
- Why hasn't it sold? Are there any deal-killer items the seller is aware of (foundation, flood, title, zoning, code violations)?
- Is there a deadline driving the sale (1031 exchange, divorce, estate, relocation)? That informs how much negotiation room exists.
- What's the average days-on-market for RENTAL listings here right now (not sales)? A rising rental-DOM trend means longer vacancies and softer asking-rent achievability than the comps imply.
- What's the recent tenant-quality profile in this submarket — average credit score on applications, eviction rate, late-payment / NSF rate, and stable-employment percentage? A property-management company in the area should have these aggregated.
- How much new for-sale + rental construction is in the pipeline within 1–3 miles? Heavy new supply typically softens prices + rents 12–24 months out; constrained supply supports both.
Investment metrics
- 1% rule
- 3.64% ✓
- Cap rate
- 9.63%
- Cash-on-cash
- 11.92%
- DSCR
- 1.53
- GRM
- 2.3
CMA / ARV
No comps found within radius.
Projected returns pro-forma
-3.0% appreciation · 2.25% rent growth · sell at horizon
- IRR
- 0.0%
- Equity multiple
- 1.00×
- Total profit
- $4
- Equity at exit
- $7,440
- IRR
- 8.3%
- Equity multiple
- 1.60×
- Total profit
- $8,373
- Equity at exit
- $4,314
Cash invested: $13,972 (down + closing). Projections, not guarantees.
Landlord ↔ Tenant lean methodology
- Overall (STATE)
- 86 Strongly Landlord-Friendly
- State Utah
- 86 Strongly Landlord-Friendly · R+15
- County
- — inherits STATE
- City
- — inherits STATE
ZIP-level market 84015
- Rents YoY
- 2.2%
- Active inventory
- 387
- Price-to-rent
- 2.3×
Monthly cashflow live
- Estimated rent
- $1,815 high interval (Pro) →
- Mortgage (P&I)
- −$262
- Tax est. 1.5%
- −$62 /mo · $748/yr
- Insurance
- −$21
- HOA
- −$950
- Vacancy / Maint / Mgmt
- −$381
- Net cashflow
- $139
Break-even live
UW: 25.0% down · 7.5% · 30yr · 1.5% tax · 5.0% vac · 8.0% maint · 8.0% mgmt
Financing live
Cash to close
- Down payment
- $12,475
- Closing costs
- $1,497
- Reserves months
- —
- Total cash needed
- —
Loan-product check · same deal, 3 products live
Conventional
25% down · 7.5% · 30yr
- Down + closing
- —
- Monthly P&I
- —
- Monthly cashflow
- —
- DSCR
- —
- Eligible?
- —
Personal DTI + credit; lowest rate.
DSCR
20% down · 8.5% · 30yr
- Down + closing
- —
- Monthly P&I
- —
- Monthly cashflow
- —
- DSCR
- —
- Eligible?
- —
No personal income docs; deal must DSCR.
Hard money
10% down · 12.0% · 12mo
- Down + closing
- —
- Monthly P&I
- —
- Monthly cashflow
- —
- DSCR
- —
- Eligible?
- —
Short-term bridge; refi at stabilization.
Rent comps 9 comps
| Address | Beds | Baths | Sqft | Rent | $/sqft | DOM | Units | Dist |
|---|---|---|---|---|---|---|---|---|
| 163 S 1450 W Clearfield, UT | 2.0–3.0 | 1.5 | 1060 | $1,716 | $1.62 | 14d | 2 | 0.58mi |
| 684 W 800 N Clearfield, UT | 2.0 | 1.0–1.5 | 831 | $1,315 | $1.58 | 23d | 1 | 0.70mi |
| 326 S 1550 W Syracuse, UT | 1.0–4.0 | 1.0–2.5 | 1545 | $2,216 | $1.43 | 14d | 37 | 0.82mi |
| 101 N 2000 W West Point, UT | 1.0–2.0 | 1.0–2.0 | 970 | $1,953 | $2.01 | 13d | 9 | 0.95mi |
| 75 W 250 N Clearfield, UT | 2.0 | 2.0 | 896 | $1,424 | $1.59 | 23d | 1 | 1.10mi |
| 54 W 250 N Apt 2 Clearfield, UT | 2.0 | 1.0 | 900 | $1,095 | $1.22 | 23d | 1 | 1.14mi |
| 101 N Main St Clearfield, UT | 1.0–3.0 | 1.0–2.0 | 1040 | $1,844 | $1.77 | 13d | 8 | 1.19mi |
| 111 Center St Unit 5C Clearfield, UT | 2.0 | 1.5 | 1008 | $1,480 | $1.47 | 23d | 1 | 1.37mi |
| 373 N 2625 W West Point, UT | 2.0 | 1.0 | 800 | $1,350 | $1.69 | 14d | 1 | 1.49mi |
HOA detail
- Monthly dues
- $950 · $11,400/yr
Listing history 20 events
-
2026-06-18days on market $49,900 Active 206 DOM
-
2026-06-17days on market $49,900 Active 205 DOM
-
2026-06-16days on market $49,900 Active 204 DOM
-
2026-06-15days on market $49,900 Active 203 DOM
-
2026-06-14days on market $49,900 Active 201 DOM
-
2026-06-13days on market $49,900 Active 200 DOM
-
2026-06-10days on market $49,900 Active 198 DOM
-
2026-06-09days on market $49,900 Active 197 DOM
-
2026-06-08days on market $49,900 Active 196 DOM
-
2026-06-07days on market $49,900 Active 195 DOM
-
2026-06-05days on market $49,900 Active 192 DOM
-
2026-06-03days on market $49,900 Active 191 DOM
-
2026-06-02days on market $49,900 Active 190 DOM
-
2026-06-01days on market $49,900 Active 189 DOM
-
2026-05-31days on market $49,900 Active 188 DOM
-
2026-05-31days on market $49,900 Active 187 DOM
-
2026-03-27price $49,900
-
2025-11-24$54,900 Active
-
2011-07-05soldstatus 31-char remark
Show marketing remark (31 chars)
There are no remarks available.
-
2011-05-12$11,500 31-char remark
Show marketing remark (31 chars)
There are no remarks available.
ⓘ Source: listings_history table (triggers on properties + properties_extension) + one-shot
backfill from property_details.listing_events for pre-trigger history.
Climate risk First Street
- Flood 1/10 Low FEMA zone X (unshaded) · 0% chance over 30 yrs
- Wildfire 1/10 Low
- Heat 4/10 Moderate 7 d/yr ≥93°F today · 17 d/yr by 30 yrs out
- Wind 1/10 Low
- Air quality 4/10 Moderate 5 unhealthy d/yr today · 7 by 30 yrs out
Nearby sold comps map
Loading sold comps map…
Walkable amenities ~0.75 mi
Loading nearby amenities…
Taxation est. · year 1
- Rental income
- $21,776
- − Mortgage interest
- −$2,795
- − Property taxes
- −$748
- − Insurance
- −$250
- − Repairs & maintenance
- −$1,742
- − Management
- −$1,742
- − HOA
- −$11,400
- − Depreciation
- −$1,452
- Taxable income
- $1,647
- Est. tax owed @ 24.0%
- −$395
- After-tax cash flow
- $1,270/yr
For passive investors: Depreciation is non-cash, so a rental often shows a tax loss while cash-flowing — sheltering income. Rental losses are passive: they offset passive income freely, and up to $25,000/yr can offset ordinary (W-2) income if you actively participate and your MAGI is under $100k (phasing out to $0 by $150k); unused losses carry forward. On sale, claimed depreciation is recaptured at up to 25%, and gains may owe capital-gains tax (a 1031 exchange can defer both). Figures are a year-1 estimate at your 24.0% rate — not tax advice; consult a CPA.
Schools (NCES district)
- District
- Davis District
- NCES district ID
- 4900210
- Math proficiency
- 43% ▼ -9.00%
- Reading proficiency
- 47% ▼ -5.00%
- Median HH income
- $70,511
- Composite
- 40.59/100
- National rank
- #3698
- State rank
- #28 of 80 in UT
Livability — Clearfield
- Score
- 78/100
- State rank
- #45
- US rank
- #2413
Category grades
Schools grade is shown separately in the Schools card above.
Census & demographics
- Census place
- Clearfield, UT
- County
- Davis County · 341,755 people
- City population
- 71,812
- Metro
- Ogden-Clearfield, UT
- Population (ZIP)
- 71,812
- Household income
- $95,519
- Rent vs Own
- Severe rent burden
- 985.0
Population outlook (Davis County) Hauer SSP2
- Today (2025)
- 399,271 people
- By 2030
- 430,528 · +7.8%
- By 2040
- 493,485 · +23.6%
- By 2050
- 555,187 · +39.1%
- By 2075
- 688,589 · +72.5%
- By 2100
- 769,646 · +92.8%
Race, ethnicity, and origin ACS 2023
- Neighborhood character
- Predominantly White (75%)
- Race & ethnicity
- White 75% Hispanic / Latino 16% Two or more races 9% Asian 2% Black 1%
- Hispanic origin (detail)
- Mexican 12%
- Common ancestry
- Slovak 3% Italian 3% Portuguese 2%
- Foreign-born
- 6% · Canada, Vietnam
- Languages at home
- 88% English-only · Spanish 9% Other Asian/Pacific 1% Tagalog/Filipino 1%
Political lean MEDSL · Davis
- 2024 margin
- Strong R (+24.9) · D 36.0% · R 60.8% · Other 3.2%
- 2008→2024 swing
- +17.4pp toward D · 2008: -42.3pp · 2024: -24.9pp
- All cycles
- 2024: R+24.9 2020: R+27.5 2016: R+23.3 2012: R+61.8 2008: R+42.3
Not yet ingested
- Civics
- —
Market trends
- HPI YoY
- ▼ -249.80%
- Current HPI
- 330.669
- Rent YoY
- ▲ 2.25%
- Metro
- Ogden-Clearfield, UT
- State GDP YoY
- ▲ 3.54%
- F500 in state
- 2
Industry mix (Fortune 500 HQ in UT)
| Industry | F500 HQs | Revenue |
|---|---|---|
| Financial Services | 1 | $3B |
|
||
Price history
+333.9% since first listed4 events — show timeline
- 2026-03-27 Price Changed $49,900 WFRMLS
- 2025-11-24 Listed $54,900 WFRMLS
- 2011-07-05 Sold (MLS) — WFRMLS
- 2011-05-12 Listed $11,500 WFRMLS
Cash-flow waterfall
monthlySold comps — $/sqft
last 12 mo · ≤1 miLoading sold comps…