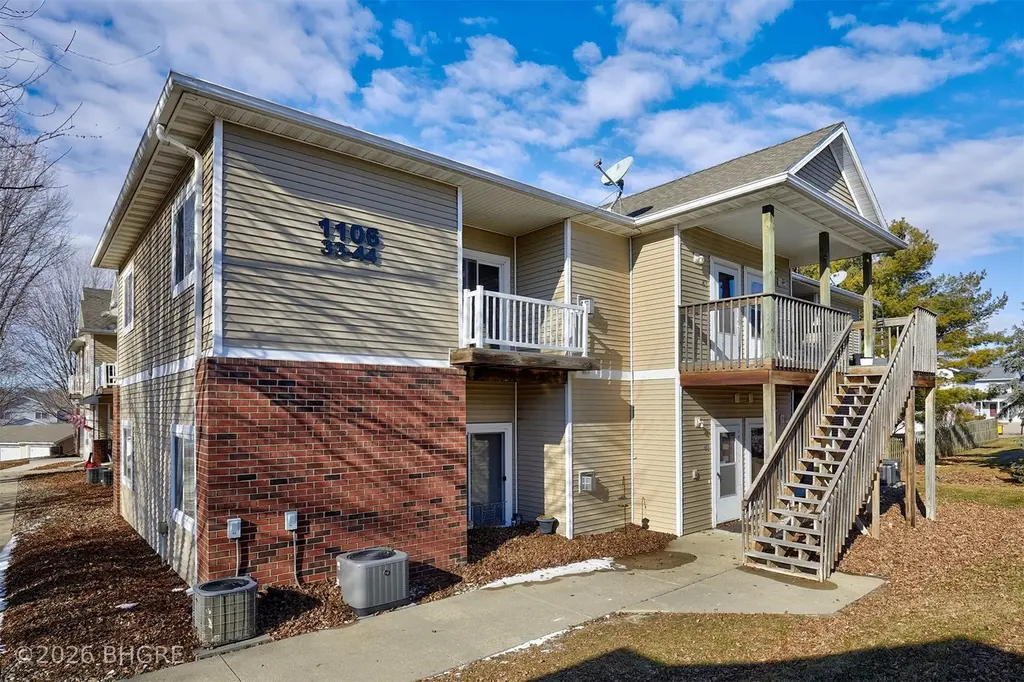
1106 N 6th St #43 · Indianola, IA
Flood risk 1/10 · Minimal
- FEMA flood zone
- X (unshaded)
- Chance of flooding over 30 yrs
- 0.0%
- Est. flood insurance / yr
- $507 – $1,088
Fire risk 1/10 · Minimal
- Est. fire insurance / yr
- $902 – $1,676
Heat risk 3/10 · Minor
- Hot days now (above 103°F)
- 7 days/yr
- Hot days in 30 yrs
- 16 days/yr
Wind risk 2/10 · Minimal
- Chance of severe wind over 30 yrs
- —
Air-quality risk 1/10 · Minimal
- Unhealthy air days now
- 0 days/yr
- Unhealthy air days in 30 yrs
- 0 days/yr
Risk factors via First Street. Map © Google.
Why this score? — see what drove the C+ grade
The composite is a weighted blend of 9 inputs, each scored 0–100. Each bar is that input's sub-score; the figure is the points it added to the 100-point composite (weight × sub-score).
- Cash flow +23.7/30.0
- 1% rule +8.2/10.0
- DSCR +7.6/10.0
- ARV discount +7.4/15.0
- Schools +6.3/10.0
- Livability +4.4/5.0
- Rent growth +2.5/5.0
- Condition / age +2.5/5.0
- Appreciation +0.0/10.0
$132,900
🖨 Deal sheet (PDF) 📄 Offer letter ✓ Due diligence
Listing remarks MLS
This beautifully refreshed 2-bedroom, 2-bath condo is ready to impress! Fresh paint throughout (yes, even the ceilings!) and new LVP flooring give the space a clean, modern feel. The spacious open-concept living and dining areas is perfect for relaxing or entertaining, complete with a cozy fireplace. Plus, enjoy the convenience of a one-car detached garage - the closest one to the building! All of this in a fantastic location close to shopping and everyday conveniences.
Key facts
- Fantastic location
- New lvp flooring
- Cozy fireplace
Tags
Neighborhood map
What this means for you Summary
Snapshot
- This is a 2-bed/2.0-bath condo listed at $133k.
Deal economics
- At list price, monthly cash flow is $252 ($3k/yr) — positive.
- The deal already cash-flows at list — no discount required.
- Meets the 1% rule at list price ($2k rent vs $133k).
- Recommended offer: $117k (12.0% below list) — sets the bar for market timing.
- Cap rate 8.6% vs local median 2.3% in Indianola — top-decile yield for the area; either an underpriced asset or a hidden risk that comps aren't pricing in. Stress-test before assuming the spread holds.
Location & tenants
- Location reads 87/100 on livability (#10 in IA, #332 nationally) — a professional / high-income tenant draw. Strengths: schools A+, amenities A+, cost of living A+; Watch: commute F.
- Indianola Community School District (town): math 74% / reading 72% proficiency, ranked #83 of 289 in IA (top 29%) — strong family-tenant draw, lease renewals of 3-5y typical.
- Market conditions: 241 active listings in the ZIP; 7 comparable units currently listed for rent nearby; rentals at typical pace (median 15d on market — plan ~3-4 weeks tenant-placement turnaround); 439 units permitted in Warren County in 2024 (0 in 5+ unit buildings).
Forward outlook
- Local home prices are declining (-3.0%/yr); year-one equity from $919 of loan paydown is wiped out by about $4k of value loss. Plan a longer hold.
- Warren County population projected at +22% by 2050 — long-run rental-demand tailwind backs the buy-and-hold thesis.
Negotiation context
- It's been on market 146 days — a 12% lower offer ($117k) is reasonable based on typical stale-listing flexibility.
- 3 sale attempts since 22y ago with the ask held roughly flat each time — persistent listings suggest the price (not the market) is what's stuck; bring a comps-based counter.
- Current owner paid $78k; list at $133k implies a 70% gain — meaningful room to come down on a strong offer.
Questions for the listing agent
- It's been on market 146 days. Have you received any prior offers? Is the seller open to a 12% concession, seller financing, or rate buy-down credit?
- What does the HOA fee cover, when was the last increase, and are there any pending special assessments or reserve-fund shortfalls?
- Any open or pending special assessments — roof, HVAC, plumbing, elevator, façade? What's the per-unit balance and payoff schedule, and is the seller paying it off at close or rolling it to the buyer?
- Why hasn't it sold? Are there any deal-killer items the seller is aware of (foundation, flood, title, zoning, code violations)?
- Is there a deadline driving the sale (1031 exchange, divorce, estate, relocation)? That informs how much negotiation room exists.
- Schools are A-rated — typically a magnet for longer-tenancy family renters. What's the average tenant stay here, and is there a school-zone premium baked into asking?
- What's the average days-on-market for RENTAL listings here right now (not sales)? A rising rental-DOM trend means longer vacancies and softer asking-rent achievability than the comps imply.
- What's the recent tenant-quality profile in this submarket — average credit score on applications, eviction rate, late-payment / NSF rate, and stable-employment percentage? A property-management company in the area should have these aggregated.
- How much new apartment / multifamily construction is in the pipeline within 1–3 miles? Heavy new supply (>2% of stock underway) typically softens rents 12–24 months out; light construction supports rent growth.
Investment metrics
- 1% rule
- 1.32% ✓
- Cap rate
- 8.57%
- Cash-on-cash
- 8.12%
- DSCR
- 1.36
- GRM
- 6.3
CMA / ARV
- ARV (median comp)
- $132,737
- List price
- $132,900
- Delta
- 0.12%
- Verdict
- FAIR
- Comps
- 20 within 1.0 mi
Projected returns pro-forma
-3.0% appreciation · 3.0% rent growth · sell at horizon
- IRR
- -3.8%
- Equity multiple
- 0.86×
- Total profit
- $-5,337
- Equity at exit
- $19,816
- IRR
- 6.0%
- Equity multiple
- 1.45×
- Total profit
- $16,645
- Equity at exit
- $11,491
Cash invested: $37,212 (down + closing). Projections, not guarantees.
Landlord ↔ Tenant lean methodology
- Overall (STATE)
- 83 Strongly Landlord-Friendly
- State Iowa
- 83 Strongly Landlord-Friendly · R+6
- County
- — inherits STATE
- City
- — inherits STATE
ZIP-level market 50125
- Home prices YoY
- -34.5%
- Active inventory
- 241
- Price-to-rent
- 6.3×
Monthly cashflow live
- Estimated rent
- $1,750 high interval (Pro) →
- Mortgage (P&I)
- −$697
- Tax from tax record
- −$178 /mo · $2,140/yr
- Insurance
- −$55
- HOA
- −$200
- Vacancy / Maint / Mgmt
- −$368
- Net cashflow
- $252
Break-even live
Sensitivity live
| Price | -10% $327 | -5% $289 | +0% $252 | +5% $214 | +10% $177 |
|---|---|---|---|---|---|
| Rent | -10% $114 | -5% $183 | +0% $252 | +5% $321 | +10% $390 |
| Rate | -1.0pp $319 | -0.5pp $286 | base $252 | +0.5pp $217 | +1.0pp $182 |
UW: 25.0% down · 7.5% · 30yr · 1.5% tax · 5.0% vac · 8.0% maint · 8.0% mgmt
Financing live
Cash to close
- Down payment
- $33,225
- Closing costs
- $3,987
- Reserves months
- —
- Total cash needed
- —
Loan-product check · same deal, 3 products live
Conventional
25% down · 7.5% · 30yr
- Down + closing
- —
- Monthly P&I
- —
- Monthly cashflow
- —
- DSCR
- —
- Eligible?
- —
Personal DTI + credit; lowest rate.
DSCR
20% down · 8.5% · 30yr
- Down + closing
- —
- Monthly P&I
- —
- Monthly cashflow
- —
- DSCR
- —
- Eligible?
- —
No personal income docs; deal must DSCR.
Hard money
10% down · 12.0% · 12mo
- Down + closing
- —
- Monthly P&I
- —
- Monthly cashflow
- —
- DSCR
- —
- Eligible?
- —
Short-term bridge; refi at stabilization.
Rent comps 7 comps
| Address | Beds | Baths | Sqft | Rent | $/sqft | DOM | Units | Dist |
|---|---|---|---|---|---|---|---|---|
| 1100 N 6th St #8 Indianola, IA | 2.0 | 1.0 | 952 | $2,600 | $2.73 | 20d | 1 | 0.06mi |
| 1100 N 6th St Unit 8-2 Indianola, IA | 2.0 | 1.0 | 952 | $1,300 | $1.37 | 15d | 1 | 0.06mi |
| 1210 N 9th St Indianola, IA | 3.0 | 1.0 | 1008 | $1,195 | $1.19 | 3d | 8 | 0.38mi |
| 1603 N 9th St Indianola, IA | 2.0 | 1.0 | 818 | $1,300 | $1.59 | 3d | 1 | 0.47mi |
| 205 W Boston Ave Apt 1 Indianola, IA | 1.0 | 1.0 | 600 | $990 | $1.65 | 3d | 1 | 0.80mi |
| 311 S Howard St Unit 4 Indianola, IA | 2.0 | 1.0 | 600 | $795 | $1.32 | 15d | 1 | 1.03mi |
| 300 S J St Apt 11 Indianola, IA | 2.0 | 1.0 | 750 | $800 | $1.07 | 45d | 1 | 1.50mi |
HOA detail condo
- Monthly dues
- $200 · $2,400/yr
- Assessments
- None detected in remarks — confirm with the listing agent.
Listing history 24 events
-
2026-06-18days on market $132,900 Active 146 DOM
-
2026-06-17days on market $132,900 Active 145 DOM
-
2026-06-16pricedays on market $132,900 Active 144 DOM
-
2026-06-15days on market $133,900 Active 143 DOM
-
2026-06-14days on market $133,900 Active 141 DOM
-
2026-06-13days on market $133,900 Active 140 DOM
-
2026-06-10days on market $133,900 Active 138 DOM
-
2026-06-09days on market $133,900 Active 137 DOM
-
2026-06-08days on market $133,900 Active 136 DOM
-
2026-06-07days on market $133,900 Active 135 DOM
-
2026-06-05days on market $133,900 Active 132 DOM
-
2026-06-03days on market $133,900 Active 131 DOM
-
2026-06-02days on market $133,900 Active 130 DOM
-
2026-06-01days on market $133,900 Active 129 DOM
-
2026-05-31days on market $133,900 Active 128 DOM
-
2026-05-31days on market $133,900 Active 127 DOM
-
2026-05-11price $133,900 474-char remark
Show marketing remark (474 chars)
This beautifully refreshed 2-bedroom, 2-bath condo is ready to impress! Fresh paint throughout (yes, even the ceilings!) and new LVP flooring give the space a clean, modern feel. The spacious open-concept living and dining areas is perfect for relaxing or entertaining, complete with a cozy fireplace. Plus, enjoy the convenience of a one-car detached garage - the closest one to the building! All of this in a fantastic location close to shopping and everyday conveniences.
-
2026-04-02price $134,900 474-char remark
Show marketing remark (474 chars)
This beautifully refreshed 2-bedroom, 2-bath condo is ready to impress! Fresh paint throughout (yes, even the ceilings!) and new LVP flooring give the space a clean, modern feel. The spacious open-concept living and dining areas is perfect for relaxing or entertaining, complete with a cozy fireplace. Plus, enjoy the convenience of a one-car detached garage - the closest one to the building! All of this in a fantastic location close to shopping and everyday conveniences.
-
2026-01-23$136,000 Active 474-char remark
Show marketing remark (474 chars)
This beautifully refreshed 2-bedroom, 2-bath condo is ready to impress! Fresh paint throughout (yes, even the ceilings!) and new LVP flooring give the space a clean, modern feel. The spacious open-concept living and dining areas is perfect for relaxing or entertaining, complete with a cozy fireplace. Plus, enjoy the convenience of a one-car detached garage - the closest one to the building! All of this in a fantastic location close to shopping and everyday conveniences.
-
2015-08-31soldstatus $78,000
-
2014-07-24historical
-
2014-01-13$85,000
-
2004-06-16$92,500
-
2004-05-26soldstatus $384,000
ⓘ Source: listings_history table (triggers on properties + properties_extension) + one-shot
backfill from property_details.listing_events for pre-trigger history.
Tax reassessment forecast IA · Partial reset (capped growth)
- Current annual tax
- $2,140 · $178/mo
- Projected year-2 tax
- $2,140 · $178/mo
- Expected delta
- $0/yr ($0/mo · 0.0%)
ⓘ Screening estimate from a state-policy table — verify with the county assessor before closing.
Climate risk First Street
- Flood 1/10 Low FEMA zone X (unshaded) · 0% chance over 30 yrs
- Wildfire 1/10 Low
- Heat 3/10 Moderate 7 d/yr ≥103°F today · 16 d/yr by 30 yrs out
- Wind 2/10 Low
- Air quality 1/10 Low 0 unhealthy d/yr today · 0 by 30 yrs out
Nearby sold comps map
Loading sold comps map…
Walkable amenities ~0.75 mi
Loading nearby amenities…
Taxation est. · year 1
- Rental income
- $21,000
- − Mortgage interest
- −$7,444
- − Property taxes
- −$2,140
- − Insurance
- −$664
- − Repairs & maintenance
- −$1,680
- − Management
- −$1,680
- − HOA
- −$2,400
- − Depreciation
- −$3,866
- Taxable income
- $1,125
- Est. tax owed @ 24.0%
- −$270
- After-tax cash flow
- $2,752/yr
For passive investors: Depreciation is non-cash, so a rental often shows a tax loss while cash-flowing — sheltering income. Rental losses are passive: they offset passive income freely, and up to $25,000/yr can offset ordinary (W-2) income if you actively participate and your MAGI is under $100k (phasing out to $0 by $150k); unused losses carry forward. On sale, claimed depreciation is recaptured at up to 25%, and gains may owe capital-gains tax (a 1031 exchange can defer both). Figures are a year-1 estimate at your 24.0% rate — not tax advice; consult a CPA.
Schools (NCES district)
- District
- Indianola Community School District
- NCES district ID
- 1914640
- Math proficiency
- 74% ▼ -3.00%
- Reading proficiency
- 72% ▬ 0.00%
- Median HH income
- $59,896
- Composite
- 62.81/100
- National rank
- #666
- State rank
- #83 of 289 in IA
Livability — Indianola
- Score
- 87/100
- State rank
- #10
- US rank
- #332
Category grades
Schools grade is shown separately in the Schools card above.
Census & demographics
- Census place
- Indianola, IA
- Population (ZIP)
- 20,009
Population outlook (Warren County) Hauer SSP2
- Today (2025)
- 54,222 people
- By 2030
- 56,863 · +4.9%
- By 2040
- 61,691 · +13.8%
- By 2050
- 65,939 · +21.6%
- By 2075
- 75,626 · +39.5%
- By 2100
- 80,425 · +48.3%
Race, ethnicity, and origin ACS 2023
- Neighborhood character
- Predominantly White (93%)
- Race & ethnicity
- White 93% Two or more races 3% Hispanic / Latino 2% Asian 1%
- Common ancestry
- Iranian 4% Portuguese 3% Italian 3%
- Foreign-born
- 2% · Vietnam, Canada
- Languages at home
- 96% English-only · Spanish 1% Russian/Polish/Slavic 1% Vietnamese 1%
Political lean MEDSL · Warren
- 2024 margin
- Strong R (+20.7) · D 38.9% · R 59.7% · Other 1.4%
- 2008→2024 swing
- -21.4pp toward R · 2008: 0.6pp · 2024: -20.7pp
- All cycles
- 2024: R+20.7 2020: R+16.8 2016: R+16.4 2012: R+2.0 2008: D+0.6
Not yet ingested
- Civics
- —
Market trends
- HPI YoY
- ▼ -107.04%
- Current HPI
- 202.9852
- Rent YoY
- —
- Metro
- —
- State GDP YoY
- ▲ 2.48%
- F500 in state
- 4
Industry mix (Fortune 500 HQ in IA)
| Industry | F500 HQs | Revenue |
|---|---|---|
| Financial Services | 1 | $16B |
|
||
| Retail / Convenience | 1 | $15B |
|
||
Price history
-65.1% since first listed8 events — show timeline
- 2026-05-11 Price Changed $133,900 DMMLS
- 2026-04-02 Price Changed $134,900 DMMLS
- 2026-01-23 Listed $136,000 DMMLS
- 2015-08-31 Sold (Public Records) $78,000 Public Records
- 2014-07-24 Listing Removed — DMMLS
- 2014-01-13 Listed $85,000 DMMLS
- 2004-06-16 Listed $92,500 DMMLS
- 2004-05-26 Sold (Public Records) $384,000 Public Records
Property tax history
+3.2%/yrLatest (2025): $2,140 · +1.5% YoY. Source: county tax records.
Cash-flow waterfall
monthlySold comps — $/sqft
last 12 mo · ≤1 miLoading sold comps…