 6-Plex
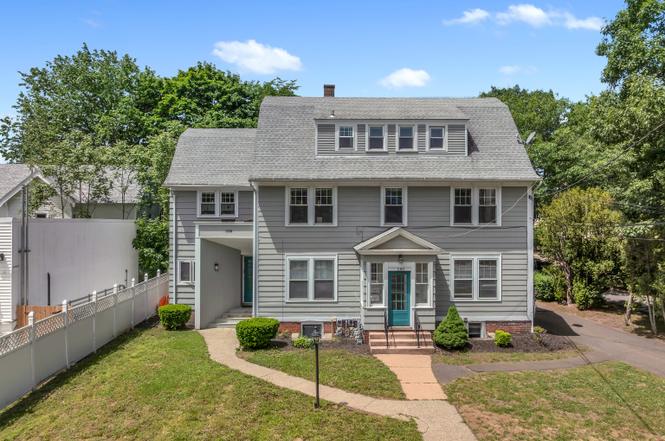
1188 Whitney Ave · Hamden, CT
Flood risk No data
- FEMA flood zone
- —
- Chance of flooding over 30 yrs
- —
- Est. flood insurance / yr
- —
Fire risk No data
- Est. fire insurance / yr
- —
Heat risk No data
- Hot days now (above threshold)
- —
- Hot days in 30 yrs
- —
Wind risk No data
- Chance of severe wind over 30 yrs
- —
Air-quality risk No data
- Unhealthy air days now
- —
- Unhealthy air days in 30 yrs
- —
Risk factors via First Street. Map © Google.
Why this score? — see what drove the B- grade
The composite is a weighted blend of 9 inputs, each scored 0–100. Each bar is that input's sub-score; the figure is the points it added to the 100-point composite (weight × sub-score).
- Cash flow +30.0/30.0
- 1% rule +10.0/10.0
- DSCR +10.0/10.0
- ARV discount +7.5/15.0
- Condition / age +3.8/5.0
- Schools +3.3/10.0
- Rent growth +2.6/5.0
- Livability +2.5/5.0
- Appreciation +0.0/10.0
$725,000
🖨 Deal sheet 📄 Offer letter ✓ Due diligence
Multi-family units
County records classify this as Multi-Family (5+ Unit). Listing-text estimate: 6 units. confirmed
5+ unit building — per-unit beds/baths from public records are typically unavailable; the breakdown below (if shown) is an estimate from the listing text.
Listing remarks
Rare opportunity to own a 6 unit apartment building in the heart of the Whitneyville section of the Hamden! The first floor features two apartments including one large studio with hardwood floors and a spacious one bedroom. The second floor/third floor features two rare two story townhouses with 2 bedrooms and 1.5 bath. The apartments feature large living rooms, amazing natural light, dining areas and two large bedrooms with ample closet space. The lower level features a spacious studio apartment with eat in kitchen and combination living/bedrooms space with a remodeled full bath. The building has a sixth apartment in the basement that is currently being used as a laundry room. The building
Key facts
- 0.27 acre lot
- 8 parking spots
- Built 1930
Property features AI
Exterior
- Parking: Parking for 8 vehicles; Off-street parking
- Utilities: Public water connected; Public sewer connected; Hot water: other
- Home design: Multi-family property (5+ units); Six units total
- Construction: Frame construction; Clapboard siding (grey); Asphalt shingle roof; Brick and stone foundation
- Exterior features: Level lot; Gutters; Exterior lighting; Private paved driveway; Off-street paved parking and driveway
Interior
- Kitchen: No kitchen appliance details provided
- Bedrooms: 8 bedrooms total
- Bathrooms: 6 full bathrooms; 2 half bathrooms
- Heating & cooling: Baseboard heating; Natural gas fuel
- Interior features: 18 total rooms; Full basement, partially finished with walk-out; Has attic with crawl space access via hatch
- Laundry & utility: Common laundry area in basement
Neighborhood map
What this means for you Summary
Snapshot
- This is a 6 × 2-bed/?-bath units multifamily listed at $725k. Condition is rated good.
Deal economics
- At list price, monthly cash flow is $4k ($51k/yr) — positive. Per door: $709/mo.
- The deal already cash-flows at list — no discount required.
- Meets the 1% rule at list price ($12k rent vs $725k).
Location & tenants
- Location reads: area grade B — affects rentability + tenant quality, not the cash-flow math above.
- Hamden School District (suburban): math 30% / reading 43% proficiency, ranked #106 of 153 in CT (top 69%) — families likely to look elsewhere, expect single-tenant / working-renter base with shorter leases.
- Zoned schools: Hamden High School (math 21% / reading 44%, grade F, #125 of 194 statewide, top 66%, 1,672 students, 39% FRL).
- Market conditions: Rents flat; 84 active listings in the ZIP; solid renter incomes; 1,059 units permitted in South Central Connecticut Planning Region in 2024 (779 in 5+ unit buildings).
- At $11,724/mo this rent would consume 135% of the median local household income ($105k/yr) (locally 531% of renters already pay >50% of income on rent) — very limited rent-growth headroom before tenants either downsize or default.
Forward outlook
- Local home prices are declining (-3.0%/yr); year-one equity from $5k of loan paydown is wiped out by about $22k of value loss. Plan a longer hold.
- At projected returns (-3.0% appreciation + 0.2% rent growth), your $203k cash investment doubles in ~6 years — after that, you're playing with house money.
Negotiation context
- Only 2 days on market — expect competitive offers; lowballing is unlikely to land.
Risks & watch-outs
- Watch-outs: built in 1930 — expect roof / HVAC / electrical / plumbing capex.
Questions for the listing agent
- Can we see the unit-by-unit rent roll, current vacancy, and any below-market leases? What's the average tenancy length?
- What capital expenditures (roof, boiler, parking lot, exteriors) have been made in the last 5 years, and what's planned in the next 2?
- Built in 1930 — when were the roof, HVAC, electrical panel, plumbing, and water heater last replaced?
- Is there a deadline driving the sale (1031 exchange, divorce, estate, relocation)? That informs how much negotiation room exists.
- What's the average days-on-market for RENTAL listings here right now (not sales)? A rising rental-DOM trend means longer vacancies and softer asking-rent achievability than the comps imply.
- What's the recent tenant-quality profile in this submarket — average credit score on applications, eviction rate, late-payment / NSF rate, and stable-employment percentage? A property-management company in the area should have these aggregated.
- How much new apartment / multifamily construction is in the pipeline within 1–3 miles? Heavy new supply (>2% of stock underway) typically softens rents 12–24 months out; light construction supports rent growth.
Investment metrics
- 1% rule
- 1.62% ✓
- Cap rate
- 13.33%
- Cash-on-cash
- 25.13%
- DSCR
- 2.12
- GRM
- 5.2
CMA / ARV
No comps found within radius.
Projected returns pro-forma
-3.0% appreciation · 0.21% rent growth · sell at horizon
- IRR
- 15.4%
- Equity multiple
- 1.60×
- Total profit
- $121,466
- Equity at exit
- $108,100
- IRR
- 21.9%
- Equity multiple
- 2.63×
- Total profit
- $330,918
- Equity at exit
- $62,685
Cash invested: $203,000 (down + closing). Projections, not guarantees.
Landlord ↔ Tenant lean methodology
- Overall (STATE)
- 27 Tenant-Leaning
- State Connecticut
- 27 Tenant-Leaning · D+7
- County
- — inherits STATE
- City
- — inherits STATE
ZIP-level market 06517
- Rents YoY
- 0.2%
- Active inventory
- 84
- Price-to-rent
- 30.9×
Monthly cashflow live
- Estimated rent
- $11,724 high interval (Pro) →
- Mortgage (P&I)
- −$3,802
- Tax est. 1.5%
- −$906 /mo · $10,875/yr
- Insurance
- −$302
- HOA
- −$0
- Vacancy / Maint / Mgmt
- −$2,462
- Net cashflow
- $4,252
Break-even live
6-unit breakdown (identical units grouped — click to expand)
| Units | Beds | Baths | Est. rent |
|---|---|---|---|
| 6× units | 2 | — | $11,724 |
| #1 | 2 | — | $1,954 |
| #2 | 2 | — | $1,954 |
| #3 | 2 | — | $1,954 |
| #4 | 2 | — | $1,954 |
| #5 | 2 | — | $1,954 |
| #6 | 2 | — | $1,954 |
| Total (6 units) | $11,724 | ||
UW: 25.0% down · 7.5% · 30yr · 1.5% tax · 5.0% vac · 8.0% maint · 8.0% mgmt
Financing live
Cash to close
- Down payment
- $181,250
- Closing costs
- $21,750
- Reserves months
- —
- Total cash needed
- —
Loan-product check · same deal, 3 products live
Conventional
25% down · 7.5% · 30yr
- Down + closing
- —
- Monthly P&I
- —
- Monthly cashflow
- —
- DSCR
- —
- Eligible?
- —
Personal DTI + credit; lowest rate.
DSCR
20% down · 8.5% · 30yr
- Down + closing
- —
- Monthly P&I
- —
- Monthly cashflow
- —
- DSCR
- —
- Eligible?
- —
No personal income docs; deal must DSCR.
Hard money
10% down · 12.0% · 12mo
- Down + closing
- —
- Monthly P&I
- —
- Monthly cashflow
- —
- DSCR
- —
- Eligible?
- —
Short-term bridge; refi at stabilization.
Listing history 3 events
-
2026-06-18days on market $725,000 Active 2 DOM
-
2026-06-16remarks 699-char remark
-
2026-06-16$725,000 Active 1 DOM
ⓘ Source: listings_history table (triggers on properties + properties_extension) + one-shot
backfill from property_details.listing_events for pre-trigger history.
Nearby sold comps map
Loading sold comps map…
Walkable amenities ~0.75 mi
Loading nearby amenities…
Taxation est. · year 1
- Rental income
- $140,688
- − Mortgage interest
- −$40,611
- − Property taxes
- −$10,875
- − Insurance
- −$3,625
- − Repairs & maintenance
- −$11,255
- − Management
- −$11,255
- − Depreciation
- −$21,091
- Taxable income
- $41,976
- Est. tax owed @ 24.0%
- −$10,074
- After-tax cash flow
- $40,946/yr
For passive investors: Depreciation is non-cash, so a rental often shows a tax loss while cash-flowing — sheltering income. Rental losses are passive: they offset passive income freely, and up to $25,000/yr can offset ordinary (W-2) income if you actively participate and your MAGI is under $100k (phasing out to $0 by $150k); unused losses carry forward. On sale, claimed depreciation is recaptured at up to 25%, and gains may owe capital-gains tax (a 1031 exchange can defer both). Figures are a year-1 estimate at your 24.0% rate — not tax advice; consult a CPA.
Condition & rehab AI · 13 photos
A well-maintained multi-family home with good condition and potential for cosmetic updates to increase its resale and rental value.
Repairs flagged
- Moderate kitchen cabinets — dated and worn
- Moderate bathroom fixtures — dated and worn
- Minor kitchen appliances — slightly outdated
Value-add opportunities
- Both update kitchen cabinets and appliances — modernizes kitchen and improves functionality
- Both update bathroom fixtures — enhances bathroom aesthetics and functionality
- Both paint exterior — enhances curb appeal and value
Renovation cost estimate screening
| Repair item | Severity | Est. cost |
|---|---|---|
| kitchen cabinets · dated and worn | Moderate | $3,000–15,000 |
| bathroom fixtures · dated and worn | Moderate | $3,000–15,000 |
| kitchen appliances · slightly outdated | Minor | $500–3,000 |
| Total estimated repair cost · 3 items | $6,500–33,000 |
Value-add ROI direction
- Both update kitchen cabinets and appliances — modernizes kitchen and improves functionality ↑
- Both update bathroom fixtures — enhances bathroom aesthetics and functionality ↑
- Both paint exterior — enhances curb appeal and value ↑
ⓘ Cost ranges are severity-bucket heuristics (US national rule-of-thumb). Get contractor quotes + a written scope before underwriting a rehab budget.
Schools (NCES district)
- District
- Hamden School District
- NCES district ID
- 0901860
- Math proficiency
- 30% ▼ -13.00%
- Reading proficiency
- 43% ▼ -7.00%
- Median HH income
- $68,821
- Composite
- 33.34/100
- National rank
- #5490
- State rank
- #106 of 153 in CT
Livability — Hamden
No livability data for this city. (Only ~50 U.S. cities are tracked.)
Census & demographics
- County
- New Haven County · 688,236 people
- City population
- 61,150
- Metro
- New Haven-Milford, CT
- Population (ZIP)
- 14,221
- Household income
- $104,550
- Rent vs Own
- Severe rent burden
- 531.0
Population outlook (South Central Connecticut County) Hauer SSP2
- By 2040
- 608,362
Race, ethnicity, and origin ACS 2023
- Neighborhood character
- Diverse neighborhood (Simpson 0.60)
- Race & ethnicity
- White 58% Black 19% Hispanic / Latino 17% Two or more races 7% Asian 2%
- Hispanic origin (detail)
- Puerto Rican 11% Dominican 2%
- Common ancestry
- Romanian 5% Scotch-Irish 2% Lithuanian 2%
- Foreign-born
- 12% · Canada, Jamaica, United Kingdom
- Languages at home
- 80% English-only · Spanish 12% French/Haitian/Cajun 2% Other Indo-European 1%
Political lean MEDSL · South Central Connecticut
- 2024 margin
- Strong D (+20.1) · D 59.0% · R 38.9% · Other 2.1%
- All cycles
- 2024: D+20.1
Not yet ingested
- Civics
- —
Market trends
- HPI YoY
- ▼ -204.00%
- Current HPI
- 255.2756
- Rent YoY
- ▲ 0.21%
- Metro
- New Haven-Milford, CT
- State GDP YoY
- ▲ 1.06%
- F500 in state
- 38
Industry mix (Fortune 500 HQ in CT)
| Industry | F500 HQs | Revenue |
|---|---|---|
| Industrial Machinery | 4 | $38B |
|
||
| Insurance | 3 | $71B |
|
||
| Financial Services | 2 | $25B |
|
||
| Transportation / Logistics | 2 | $18B |
|
||
| Healthcare | 1 | $247B |
|
||
| Telecommunications | 1 | $55B |
|
||
Price history
1 event — show timeline
- 2026-06-16 Listed $725,000 Smart MLS
Cash-flow waterfall
monthlySold comps — $/sqft
last 12 mo · ≤1 miLoading sold comps…