1043 NW 2nd St #14 · Miami, FL
Flood risk 7/10 · Major
- FEMA flood zone
- AE
- Chance of flooding over 30 yrs
- 0.76%
- Est. flood insurance / yr
- $1,737 – $8,500
Fire risk 1/10 · Minimal
- Est. fire insurance / yr
- $947 – $1,759
Heat risk 10/10 · Severe
- Hot days now (above 103°F)
- 7 days/yr
- Hot days in 30 yrs
- 25 days/yr
Wind risk 10/10 · Severe
- Chance of severe wind over 30 yrs
- 99.0%
Air-quality risk 2/10 · Minimal
- Unhealthy air days now
- 1 days/yr
- Unhealthy air days in 30 yrs
- 1 days/yr
Risk factors via First Street. Map © Google.
Why this score? — see what drove the C grade
The composite is a weighted blend of 9 inputs, each scored 0–100. Each bar is that input's sub-score; the figure is the points it added to the 100-point composite (weight × sub-score).
- Cash flow +20.0/30.0
- 1% rule +7.8/10.0
- ARV discount +7.5/15.0
- DSCR +6.3/10.0
- Schools +4.2/10.0
- Livability +3.9/5.0
- Appreciation +2.6/10.0
- Condition / age +2.5/5.0
- Rent growth +2.0/5.0
$175,000
🖨 Deal sheet 📄 Offer letter ✓ Due diligence
Listing remarks
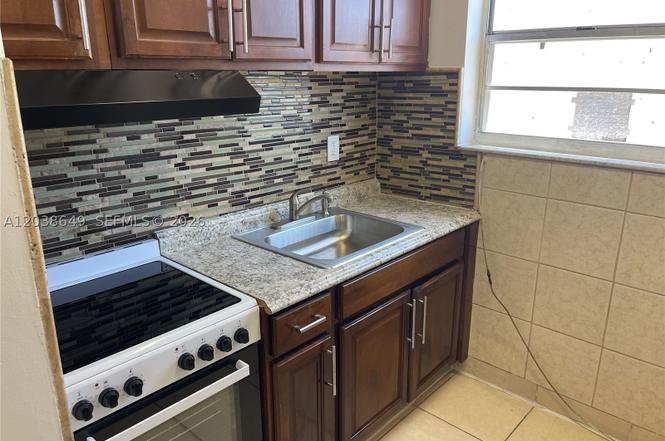
Great corner unit condo with new appliances and split bedroom floor plan. Ample size and bright unit. Consider this condo as an investment property which you can rent right away and get a great return on investment or use is a your primary residence. Centrally located in Miami surrounded by major districts such as the health district / civic center and Downtown Miami and Brickell financial district. Neighboring between the Miami River and Little Havana culture. Catch a Marlins baseball game close by and enjoy all daily amenities nearby. Easy access to all transportation and major highways. Lots of redevelopment in the area.
Key facts
- Easy access
- Centrally located
- Investment property
Tags
Property features AI
Finance
- Other: Pets allowed
- HOA & community: Monthly association fee of $347; HOA covers maintenance of structure, trash, and water
Exterior
- Parking: On-street parking
- Security: Secured lobby; Smoke detectors
- Utilities: Has heating; Has cooling
- Home design: 3-story building; Entry on level 3; Attached property
- Construction: Block construction; Effective year built listed
- Exterior features: No exterior amenities listed; Lobby secured; Smoke detector(s)
Interior
- Kitchen: Electric range; Self-cleaning oven; Refrigerator; Electric water heater
- Flooring: Tile
- Bathrooms: 1 full bathroom
- Heating & cooling: Wall furnace heating; Wall/window air conditioning units
- Interior features: Unfurnished; Living/dining room; Split bedrooms; Tub with shower
- Laundry & utility: Washer; Dryer
Neighborhood map
What this means for you Summary
Snapshot
- This is a 2-bed/1.0-bath condo listed at $175k.
Deal economics
- At list price, monthly cash flow is $-213 ($-3k/yr) — negative.
- To cash-flow at today's rent, offer at most $144k (17.6% below list).
- Meets the 1% rule at list price ($2k rent vs $175k).
- Recommended offer: $144k (17.6% below list) — sets the bar for cash-flow.
- Cap rate 7.8% vs local median 1.9% in Miami — top-decile yield for the area; either an underpriced asset or a hidden risk that comps aren't pricing in. Stress-test before assuming the spread holds.
Location & tenants
- Location reads 78/100 on livability (#177 in FL, #2,724 nationally) — a middle-class / working-renter tenant base. Strengths: amenities A+, commute A+, health & safety A+; Watch: employment C-, crime F, cost of living F.
- Miami-Dade (suburban): math 45% / reading 54% proficiency, ranked #40 of 73 in FL (top 55%) — families likely to look elsewhere, expect single-tenant / working-renter base with shorter leases; 64% free/reduced lunch — lower-income household profile, screen leases tightly.
- Market conditions: Rents soft (-2.1%/yr); 83 active listings in the ZIP; lower-income renter base — watch delinquency; 10,051 units permitted in Miami-Dade County in 2024 (7,758 in 5+ unit buildings).
- At $2,241/mo this rent would consume 63% of the median local household income ($43k/yr) (locally 1087% of renters already pay >50% of income on rent) — very limited rent-growth headroom before tenants either downsize or default.
Forward outlook
- Local home prices are declining (-3.0%/yr); year-one equity from $1k of loan paydown is wiped out by about $5k of value loss. Plan a longer hold.
- Miami-Dade County population projected at +28% by 2050 — long-run rental-demand tailwind backs the buy-and-hold thesis.
Negotiation context
- Only 1 days on market — expect competitive offers; lowballing is unlikely to land.
Risks & watch-outs
- Watch-outs: flood insurance adds $427/mo; built in 1925 — expect roof / HVAC / electrical / plumbing capex.
- Climate carrying-cost: in FEMA flood zone AE (mandatory federal flood insurance); severe wind risk, 99% chance of damaging wind over 30y; extreme-heat days projected 7→25/yr by 2055 (HVAC capex compounding) — expect insurance premiums to compound above CPI over the hold.
Questions for the listing agent
- What do current leases actually rent for vs. the listed asking? Can we see a recent rent roll and the last 12 months of T-12 income?
- Built in 1925 — when were the roof, HVAC, electrical panel, plumbing, and water heater last replaced?
- What's the actual annual flood-insurance premium (NFIP or private), and is the property in a SFHA with mandatory coverage?
- What does the HOA fee cover, when was the last increase, and are there any pending special assessments or reserve-fund shortfalls?
- Any open or pending special assessments — roof, HVAC, plumbing, elevator, façade? What's the per-unit balance and payoff schedule, and is the seller paying it off at close or rolling it to the buyer?
- Is there a deadline driving the sale (1031 exchange, divorce, estate, relocation)? That informs how much negotiation room exists.
- Schools are B-rated — typically a magnet for longer-tenancy family renters. What's the average tenant stay here, and is there a school-zone premium baked into asking?
- Crime grade is F in this area — have there been break-ins, vandalism, or insurance claims at this property in the last 3 years? What carrier currently insures it and at what premium?
- What's the average days-on-market for RENTAL listings here right now (not sales)? A rising rental-DOM trend means longer vacancies and softer asking-rent achievability than the comps imply.
- What's the recent tenant-quality profile in this submarket — average credit score on applications, eviction rate, late-payment / NSF rate, and stable-employment percentage? A property-management company in the area should have these aggregated.
- How much new apartment / multifamily construction is in the pipeline within 1–3 miles? Heavy new supply (>2% of stock underway) typically softens rents 12–24 months out; light construction supports rent growth.
Investment metrics
- 1% rule
- 1.28% ✓
- Cap rate
- 7.76%
- Cash-on-cash
- 5.23%
- DSCR
- 1.23
- GRM
- 6.5
CMA / ARV
No comps found within radius.
Projected returns pro-forma
-3.0% appreciation · 0.0% rent growth · sell at horizon
- IRR
- -30.9%
- Equity multiple
- 0.02×
- Total profit
- $-47,969
- Equity at exit
- $26,093
- IRR
- -76.0%
- Equity multiple
- -0.68×
- Total profit
- $-82,533
- Equity at exit
- $15,131
Cash invested: $49,000 (down + closing). Projections, not guarantees.
Landlord ↔ Tenant lean methodology
- Overall (STATE)
- 87 Strongly Landlord-Friendly
- State Florida
- 87 Strongly Landlord-Friendly · R+3
- County
- — inherits STATE
- City
- — inherits STATE
ZIP-level market 33128
- Home prices YoY
- -1.1%
- Rents YoY
- -2.1%
- Active inventory
- 83
- Price-to-rent
- 6.5×
Monthly cashflow live
- Estimated rent
- $2,241 medium interval (Pro) →
- Mortgage (P&I)
- −$918
- Tax est. 1.5%
- −$219 /mo · $2,625/yr
- Insurance
- −$73
- Flood insurance flood zone
- −$427 /mo · $5,118/yr
- HOA
- −$347
- Vacancy / Maint / Mgmt
- −$471
- Net cashflow
- $-213
Break-even live
UW: 25.0% down · 7.5% · 30yr · 1.5% tax · 5.0% vac · 8.0% maint · 8.0% mgmt
Financing live
Cash to close
- Down payment
- $43,750
- Closing costs
- $5,250
- Reserves months
- —
- Total cash needed
- —
Loan-product check · same deal, 3 products live
Conventional
25% down · 7.5% · 30yr
- Down + closing
- —
- Monthly P&I
- —
- Monthly cashflow
- —
- DSCR
- —
- Eligible?
- —
Personal DTI + credit; lowest rate.
DSCR
20% down · 8.5% · 30yr
- Down + closing
- —
- Monthly P&I
- —
- Monthly cashflow
- —
- DSCR
- —
- Eligible?
- —
No personal income docs; deal must DSCR.
Hard money
10% down · 12.0% · 12mo
- Down + closing
- —
- Monthly P&I
- —
- Monthly cashflow
- —
- DSCR
- —
- Eligible?
- —
Short-term bridge; refi at stabilization.
HOA detail condo
- Monthly dues
- $347 · $4,164/yr
- Assessments
- None detected in remarks — confirm with the listing agent.
Listing history 2 events
-
2026-06-17remarks 631-char remark
-
2026-06-17$175,000 Active 1 DOM
ⓘ Source: listings_history table (triggers on properties + properties_extension) + one-shot
backfill from property_details.listing_events for pre-trigger history.
Climate risk First Street
- Flood 7/10 Severe FEMA zone AE · 76% chance over 30 yrs
- Wildfire 1/10 Low
- Heat 10/10 Extreme 7 d/yr ≥103°F today · 25 d/yr by 30 yrs out
- Wind 10/10 Extreme 99% chance of damaging wind over 30 yrs
- Air quality 2/10 Low 1 unhealthy d/yr today · 1 by 30 yrs out
Nearby sold comps map
Loading sold comps map…
Walkable amenities ~0.75 mi
Loading nearby amenities…
Taxation est. · year 1
- Rental income
- $26,888
- − Mortgage interest
- −$9,803
- − Property taxes
- −$2,625
- − Insurance
- −$5,994
- − Repairs & maintenance
- −$2,151
- − Management
- −$2,151
- − HOA
- −$4,164
- − Depreciation
- −$5,091
- Taxable loss
- −$5,090
- Est. tax savings @ 24.0%
- +$1,222
- After-tax cash flow
- $-1,332/yr
For passive investors: Depreciation is non-cash, so a rental often shows a tax loss while cash-flowing — sheltering income. Rental losses are passive: they offset passive income freely, and up to $25,000/yr can offset ordinary (W-2) income if you actively participate and your MAGI is under $100k (phasing out to $0 by $150k); unused losses carry forward. On sale, claimed depreciation is recaptured at up to 25%, and gains may owe capital-gains tax (a 1031 exchange can defer both). Figures are a year-1 estimate at your 24.0% rate — not tax advice; consult a CPA.
Schools (NCES district)
- District
- Miami-Dade
- NCES district ID
- 1200390
- Math proficiency
- 45% ▼ -16.00%
- Reading proficiency
- 54% ▼ -5.00%
- Median HH income
- $43,928
- Composite
- 41.76/100
- National rank
- #3397
- State rank
- #40 of 73 in FL
Livability — Miami
- Score
- 78/100
- State rank
- #177
- US rank
- #2724
Category grades
Schools grade is shown separately in the Schools card above.
Census & demographics
- Census place
- Miami, FL
- County
- Miami-Dade County · 2,697,751 people
- City population
- 827,308
- Metro
- Miami-Fort Lauderdale-Pompano Beach, FL
- Population (ZIP)
- 9,475
- Household income
- $42,722
- Rent vs Own
- Severe rent burden
- 1087.0
Population outlook (Miami-Dade County) Hauer SSP2
- Today (2025)
- 3,126,439 people
- By 2030
- 3,325,765 · +6.4%
- By 2040
- 3,697,561 · +18.3%
- By 2050
- 4,012,134 · +28.3%
- By 2075
- 4,605,612 · +47.3%
- By 2100
- 4,866,598 · +55.7%
Race, ethnicity, and origin ACS 2023
- Neighborhood character
- Predominantly Hispanic (86%)
- Race & ethnicity
- Hispanic / Latino 86% Two or more races 50% White 8% Black 4%
- Hispanic origin (detail)
- Mexican 2% Puerto Rican 6% Cuban 29% Dominican 1%
- Common ancestry
- Lithuanian 2%
- Foreign-born
- 70% · Canada, Jamaica, Dominican Republic
- Languages at home
- 13% English-only · Spanish 82% Other Indo-European 2% French/Haitian/Cajun 1%
Political lean MEDSL · Miami-Dade
- 2024 margin
- R (+11.4) · D 43.9% · R 55.4%
- 2008→2024 swing
- -27.6pp toward R · 2008: 16.1pp · 2024: -11.4pp
- All cycles
- 2024: R+11.4 2020: D+7.3 2016: D+29.6 2012: D+23.7 2008: D+16.1
Not yet ingested
- Civics
- —
Market trends
- HPI YoY
- ▼ -4.75%
- Current HPI
- 436.8124
- Rent YoY
- ▼ -2.08%
- Metro
- Miami-Fort Lauderdale-Pompano Beach, FL
- State GDP YoY
- ▲ 3.28%
- F500 in state
- 36
Industry mix (Fortune 500 HQ in FL)
| Industry | F500 HQs | Revenue |
|---|---|---|
| Industrial Technology | 2 | $29B |
|
||
| Insurance | 2 | $17B |
|
||
| Retail | 1 | $60B |
|
||
| Technology Distribution | 1 | $58B |
|
||
| Homebuilding | 1 | $35B |
|
||
| Technology Manufacturing | 1 | $35B |
|
||
Price history
-78.1% since first listed2 events — show timeline
- 2026-06-17 Listed $175,000 MARMLS
- 2004-03-16 Sold (Public Records) $800,000 Public Records
Property tax history
-21.1%/yrLatest (2025): $12 · -93.8% YoY. Source: county tax records.
Cash-flow waterfall
monthlySold comps — $/sqft
last 12 mo · ≤1 miLoading sold comps…