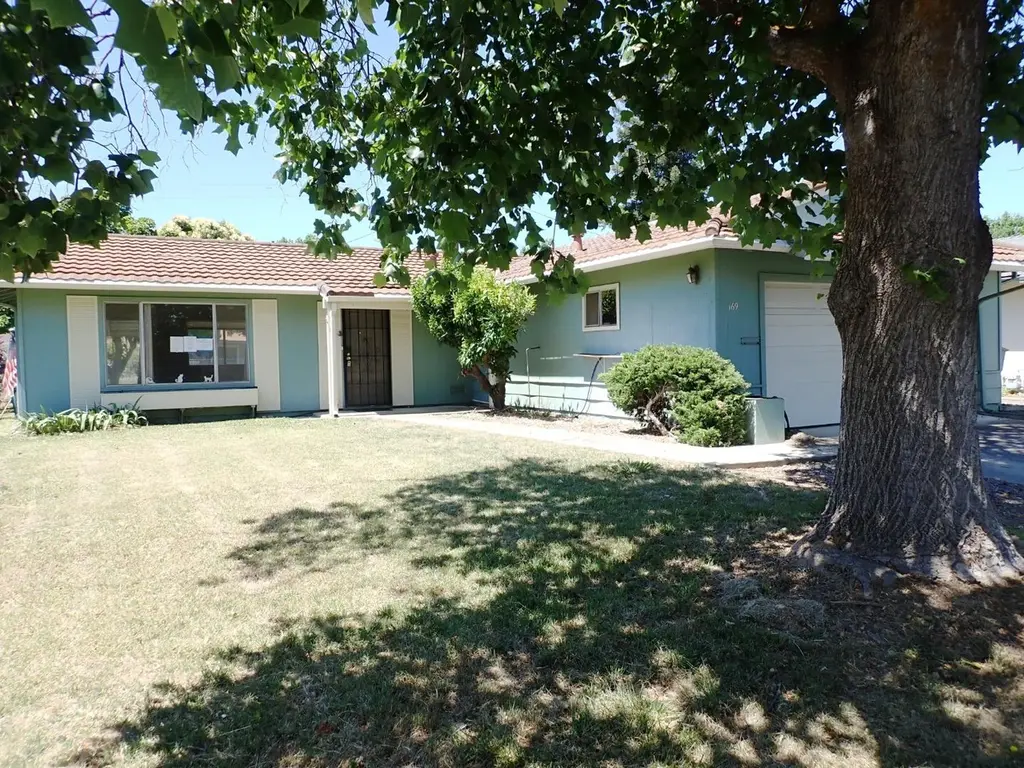
169 Rainier Cir · Vacaville, CA
Flood risk 1/10 · Minimal
- FEMA flood zone
- X (unshaded)
- Chance of flooding over 30 yrs
- 0.0%
- Est. flood insurance / yr
- $507 – $1,088
Fire risk 3/10 · Minor
- Est. fire insurance / yr
- $659 – $1,223
Heat risk 6/10 · Moderate
- Hot days now (above 101°F)
- 7 days/yr
- Hot days in 30 yrs
- 15 days/yr
Wind risk 1/10 · Minimal
- Chance of severe wind over 30 yrs
- —
Air-quality risk 10/10 · Severe
- Unhealthy air days now
- 24 days/yr
- Unhealthy air days in 30 yrs
- 24 days/yr
Risk factors via First Street. Map © Google.
Why this score? — see what drove the D grade
The composite is a weighted blend of 9 inputs, each scored 0–100. Each bar is that input's sub-score; the figure is the points it added to the 100-point composite (weight × sub-score).
- ARV discount +15.0/15.0
- Cash flow +10.3/30.0
- Schools +4.2/10.0
- Livability +3.9/5.0
- DSCR +3.0/10.0
- Condition / age +2.5/5.0
- 1% rule +2.4/10.0
- Rent growth +2.4/5.0
- Appreciation +0.0/10.0
$330,000
🖨 Deal sheet (PDF) 📄 Offer letter ✓ Due diligence
Listing remarks MLS
Charming Ranch Style home located in the wonderful senior community of Leisure Town! A 55+ year senior community. Home sits on a quiet tree lined street and backs up to a large greenbelt. This home boasts a functional floorplan with a spacious Living Room with a dining area. The stylish kitchen has plenty of natural light and loads of counter and cabinet space. Both sunlight filled bedrooms are of ample size. The Leisure Town Community is a park like setting with many amenities such as swimming, Lawn Bowling, Billiards Room, any many more. Don't miss this opportunity, as this home is going to sell fast!
Key facts
- Stylish kitchen
- Ranch style home
- Functional floorplan
Tags
Property features AI
Finance
- HOA & community: HOA fee $91 per month; HOA covers pools, spa, or tennis; common area electricity; common area insurance; common area maintenance; Community identified as a senior community
Exterior
- Parking: Attached 2-car garage; Off-street parking
- Utilities: Public water; Public sewer; Public utilities
- Home design: Detached single-story home; R1 zoning
- Construction: Concrete slab foundation
- Exterior features: Tile roof; Additional roof details listed as 'Other'
Interior
- Kitchen: Electric cooktop
- Bedrooms: 2 bedrooms
- Bathrooms: 2 full bathrooms
- Heating & cooling: Central forced air heating and cooling
- Interior features: Kitchen and family room combined; No formal dining room
- Laundry & utility: Laundry in garage
Neighborhood map
What this means for you Summary
Snapshot
- This is a 2-bed/2.0-bath single-family listed at $330k.
Deal economics
- At list price, monthly cash flow is $-178 ($-2k/yr) — negative.
- To cash-flow at today's rent, offer at most $299k (9.5% below list).
- To meet the 1% rule (rent ≥ 1% of price), the offer needs to be $243k (26.2% below list).
- Recommended offer: $243k (26.2% below list) — sets the bar for 1% rule.
- Cap rate 5.6% vs local median 3.0% in Vacaville — top-decile yield for the area; either an underpriced asset or a hidden risk that comps aren't pricing in. Stress-test before assuming the spread holds.
Location & tenants
- Location reads 77/100 on livability (#88 in CA, #3,156 nationally) — a middle-class / working-renter tenant base. Strengths: amenities A+, employment A+, housing A+; Watch: cost of living F.
- Vacaville Unified (suburban): math 37% / reading 52% proficiency, ranked #522 of 1,400 in CA (top 37%) — families likely to look elsewhere, expect single-tenant / working-renter base with shorter leases.
- Zoned schools: Cooper Elementary (720 students, 41% FRL); Vaca Pena Middle (689 students, 53% FRL); Will C. Wood High (1,670 students, 42% FRL).
- Market conditions: Rents soft (-0.6%/yr); 265 active listings in the ZIP; 13 comparable units currently listed for rent nearby; rentals at typical pace (median 16d on market — plan ~3-4 weeks tenant-placement turnaround); solid renter incomes; 1,472 units permitted in Solano County in 2024 (131 in 5+ unit buildings).
Forward outlook
- Local home prices are declining (-3.0%/yr); year-one equity from $2k of loan paydown is wiped out by about $10k of value loss. Plan a longer hold.
- Solano County population projected at +15% by 2050 — modest demand growth; plan on rents tracking national, not racing it.
Negotiation context
- It's been on market 16 days — a 2% lower offer ($325k) is reasonable based on typical stale-listing flexibility.
- 3 sale attempts with the ask held roughly flat each time — persistent listings suggest the price (not the market) is what's stuck; bring a comps-based counter.
- Current owner paid $97k; list at $330k implies a 240% gain — meaningful room to come down on a strong offer.
Risks & watch-outs
- Climate carrying-cost: extreme-heat days projected 7→15/yr by 2055 (HVAC capex compounding) — expect insurance premiums to compound above CPI over the hold.
Questions for the listing agent
- What do current leases actually rent for vs. the listed asking? Can we see a recent rent roll and the last 12 months of T-12 income?
- Built in 1964 — when were the roof, HVAC, electrical panel, plumbing, and water heater last replaced?
- What does the HOA fee cover, when was the last increase, and are there any pending special assessments or reserve-fund shortfalls?
- Is there a deadline driving the sale (1031 exchange, divorce, estate, relocation)? That informs how much negotiation room exists.
- The area grade is low — what's the realistic commute time and amenity access for the typical tenant pool here? Any planned neighborhood developments (good or bad) we should know about?
- What's the average days-on-market for RENTAL listings here right now (not sales)? A rising rental-DOM trend means longer vacancies and softer asking-rent achievability than the comps imply.
- What's the recent tenant-quality profile in this submarket — average credit score on applications, eviction rate, late-payment / NSF rate, and stable-employment percentage? A property-management company in the area should have these aggregated.
- How much new for-sale + rental construction is in the pipeline within 1–3 miles? Heavy new supply typically softens prices + rents 12–24 months out; constrained supply supports both.
Investment metrics
- 1% rule
- 0.74% ✗
- Cap rate
- 5.65%
- Cash-on-cash
- -2.31%
- DSCR
- 0.90
- GRM
- 11.3
CMA / ARV
- ARV (median comp)
- $431,892
- List price
- $330,000
- Delta
- -23.59%
- Verdict
- UNDERPRICED
- Comps
- 20 within 1.0 mi
Show comp detail 12 sales within ~0.75 mi
| Address | Dist | Beds/Ba | Sqft | Sold | Price | $/sf | Match |
|---|---|---|---|---|---|---|---|
| 178 Mckinley Cir | 0.27mi | 2/2.0 | 1,043 (0%) | 3mo | $405,000 | $388 | 85 |
| 200 Rainier Cir | 0.18mi | 2/2.0 | 1,043 (0%) | 8mo | $350,000 | $336 | 85 |
| 126 Olympic Cir | 0.10mi | 2/2.0 | 1,152 (+10%) | 4mo | $425,000 | $369 | 74 |
| 130 Mckinley Cir | 0.19mi | 2/2.0 | 1,152 (+10%) | 1mo | $426,000 | $370 | 73 |
| 137 Olympic Cir | 0.09mi | 2/2.0 | 1,152 (+10%) | 9mo | $450,000 | $391 | 71 |
| 122 Rainier Cir | 0.11mi | 2/1.0 | 918 (-12%) | 4mo | $385,000 | $419 | 67 |
| 171 Mckinley Cir | 0.23mi | 2/1.0 | 918 (-12%) | 4mo | $375,000 | $408 | 62 |
| 115 Isle Royale Cir | 0.45mi | 2/2.0 | 1,152 (+10%) | 2mo | $410,000 | $356 | 60 |
| 201 Lassen Cir | 0.41mi | 2/2.0 | 1,152 (+10%) | 7mo | $410,000 | $356 | 58 |
| 189 Lassen Cir | 0.38mi | 2/1.0 | 918 (-12%) | 3mo | $409,000 | $446 | 56 |
| 129 Carlsbad Cir | 0.66mi | 2/1.0 | 922 (-12%) | 3mo | $415,000 | $450 | 44 |
| 103 Carlsbad Cir | 0.70mi | 2/2.0 | 1,189 (+14%) | 7mo | $405,000 | $341 | 38 |
Match score weights: distance 35% · size 25% · config 20% · recency 20%. Top-matched comps best support the ARV.
Projected returns pro-forma
-3.0% appreciation · 0.0% rent growth · sell at horizon
- IRR
- -23.3%
- Equity multiple
- 0.22×
- Total profit
- $-72,028
- Equity at exit
- $49,204
- IRR
- -27.6%
- Equity multiple
- -0.14×
- Total profit
- $-105,198
- Equity at exit
- $28,532
Cash invested: $92,400 (down + closing). Projections, not guarantees.
Landlord ↔ Tenant lean methodology
- Overall (STATE)
- 18 Strongly Tenant-Friendly
- State California
- 18 Strongly Tenant-Friendly · D+13
- County
- — inherits STATE
- City
- — inherits STATE
ZIP-level market 95687
- Rents YoY
- -0.6%
- Active inventory
- 265
- Price-to-rent
- 11.3×
Monthly cashflow live
- Estimated rent
- $2,434 high interval (Pro) →
- Mortgage (P&I)
- −$1,731
- Tax from tax record
- −$142 /mo · $1,704/yr
- Insurance
- −$138
- HOA
- −$91
- Vacancy / Maint / Mgmt
- −$511
- Net cashflow
- $-178
Break-even live
Sensitivity live
| Price | -10% $9 | -5% $-85 | +0% $-178 | +5% $-272 | +10% $-365 |
|---|---|---|---|---|---|
| Rent | -10% $-370 | -5% $-274 | +0% $-178 | +5% $-82 | +10% $14 |
| Rate | -1.0pp $-12 | -0.5pp $-94 | base $-178 | +0.5pp $-264 | +1.0pp $-351 |
UW: 25.0% down · 7.5% · 30yr · 1.5% tax · 5.0% vac · 8.0% maint · 8.0% mgmt
Financing live
Cash to close
- Down payment
- $82,500
- Closing costs
- $9,900
- Reserves months
- —
- Total cash needed
- —
Loan-product check · same deal, 3 products live
Conventional
25% down · 7.5% · 30yr
- Down + closing
- —
- Monthly P&I
- —
- Monthly cashflow
- —
- DSCR
- —
- Eligible?
- —
Personal DTI + credit; lowest rate.
DSCR
20% down · 8.5% · 30yr
- Down + closing
- —
- Monthly P&I
- —
- Monthly cashflow
- —
- DSCR
- —
- Eligible?
- —
No personal income docs; deal must DSCR.
Hard money
10% down · 12.0% · 12mo
- Down + closing
- —
- Monthly P&I
- —
- Monthly cashflow
- —
- DSCR
- —
- Eligible?
- —
Short-term bridge; refi at stabilization.
Rent comps 13 comps
| Address | Beds | Baths | Sqft | Rent | $/sqft | DOM | Units | Dist |
|---|---|---|---|---|---|---|---|---|
| 107 Lassen Cir Vacaville, CA | 2.0 | 2.0 | 1043 | $2,150 | $2.06 | 25d | 1 | 0.35mi |
| 188 Glacier Cir Vacaville, CA | 3.0 | 2.0 | 1372 | $2,750 | $2.00 | 15d | 1 | 0.61mi |
| 132 Bryce Way Vacaville, CA | 2.0 | 2.0 | 1292 | $2,350 | $1.82 | 46d | 1 | 0.73mi |
| 3500 Harbison Dr Vacaville, CA | 1.0–2.0 | 1.0–2.0 | 1038 | $2,768 | $2.67 | 15d | 11 | 0.74mi |
| 100 Summerfield Dr Vacaville, CA | 1.0–2.0 | 1.0–2.0 | 900 | $2,535 | $2.82 | 15d | 6 | 0.82mi |
| 555 Elmira Rd Vacaville, CA | 1.0–2.0 | 1.0–2.0 | 822 | $2,325 | $2.83 | 15d | 1 | 1.03mi |
| 1200 Allison Dr Vacaville, CA | 3.0 | 1.0–2.0 | 964 | $2,866 | $2.97 | 15d | 15 | 1.04mi |
| 1000 Allison Dr Vacaville, CA | 1.0–2.0 | 1.0–2.0 | 990 | $3,100 | $3.13 | 15d | 15 | 1.15mi |
| 209 Aegean Way Vacaville, CA | 1.0–2.0 | 1.0–2.0 | 760 | $2,275 | $2.99 | 3d | 12 | 1.22mi |
| 199 Aegean Way Vacaville, CA | 1.0–2.0 | 1.0 | 728 | $1,975 | $2.71 | 0d | 5 | 1.32mi |
| 1407 Callen St Unit C Vacaville, CA | 2.0 | 1.5 | 950 | $2,000 | $2.11 | 45d | 1 | 1.36mi |
| 1801 Marshall Rd Vacaville, CA | 2.0 | 2.0 | 924 | $2,148 | $2.32 | 25d | 2 | 1.40mi |
| 1801 Marshall Rd #805 Vacaville, CA | 2.0 | 2.0 | 948 | $2,300 | $2.43 | 45d | 1 | 1.40mi |
HOA detail
- Monthly dues
- $91 · $1,092/yr
Listing history 16 events
-
2026-06-21days on market $330,000 Active 16 DOM
-
2026-06-18days on market $330,000 Active 13 DOM
-
2026-06-17days on market $330,000 Active 12 DOM
-
2026-06-16days on market $330,000 Active 11 DOM
-
2026-06-15days on market $330,000 Active 10 DOM
-
2026-06-14days on market $330,000 Active 8 DOM
-
2026-06-13days on market $330,000 Active 7 DOM
-
2026-06-10days on market $330,000 Active 5 DOM
-
2026-06-09days on market $330,000 Active 4 DOM
-
2026-06-08remarks 610-char remark
-
2026-06-08days on market $330,000 Active 3 DOM
-
2026-06-07remarks 581-char remark
-
2026-06-07statusdays on market $330,000 Active 2 DOM
-
2026-05-12historical
-
2026-03-21Active
-
1998-01-14soldstatus $97,000
ⓘ Source: listings_history table (triggers on properties + properties_extension) + one-shot
backfill from property_details.listing_events for pre-trigger history.
Tax reassessment forecast CA · Resets to sale price
- Current annual tax
- $1,704 · $142/mo
- Projected year-2 tax
- $2,508 · $209/mo
- Expected delta
- +$804/yr (+$67/mo · 47.2%)
ⓘ Screening estimate from a state-policy table — verify with the county assessor before closing.
Climate risk First Street
- Flood 1/10 Low FEMA zone X (unshaded) · 0% chance over 30 yrs
- Wildfire 3/10 Moderate
- Heat 6/10 Major 7 d/yr ≥101°F today · 15 d/yr by 30 yrs out
- Wind 1/10 Low
- Air quality 10/10 Extreme 24 unhealthy d/yr today · 24 by 30 yrs out
Nearby sold comps map
Loading sold comps map…
Walkable amenities ~0.75 mi
Loading nearby amenities…
Taxation est. · year 1
- Rental income
- $29,209
- − Mortgage interest
- −$18,485
- − Property taxes
- −$1,704
- − Insurance
- −$1,650
- − Repairs & maintenance
- −$2,337
- − Management
- −$2,337
- − HOA
- −$1,092
- − Depreciation
- −$9,600
- Taxable loss
- −$7,996
- Est. tax savings @ 24.0%
- +$1,919
- After-tax cash flow
- $-219/yr
For passive investors: Depreciation is non-cash, so a rental often shows a tax loss while cash-flowing — sheltering income. Rental losses are passive: they offset passive income freely, and up to $25,000/yr can offset ordinary (W-2) income if you actively participate and your MAGI is under $100k (phasing out to $0 by $150k); unused losses carry forward. On sale, claimed depreciation is recaptured at up to 25%, and gains may owe capital-gains tax (a 1031 exchange can defer both). Figures are a year-1 estimate at your 24.0% rate — not tax advice; consult a CPA.
Schools (NCES district)
- District
- Vacaville Unified
- NCES district ID
- 0640590
- Math proficiency
- 37% ▼ -1.00%
- Reading proficiency
- 52% ▲ 2.00%
- Median HH income
- $71,383
- Composite
- 42.48/100
- National rank
- #6877
- State rank
- #522 of 1400 in CA
Livability — Vacaville
- Score
- 77/100
- State rank
- #88
- US rank
- #3156
Category grades
Schools grade is shown separately in the Schools card above.
Census & demographics
- Census place
- Vacaville, CA
- County
- Solano County · 433,239 people
- City population
- 109,591
- Metro
- Vallejo, CA
- Population (ZIP)
- 69,390
- Household income
- $109,566
- Rent vs Own
- Severe rent burden
- 1761.0
Population outlook (Solano County) Hauer SSP2
- Today (2025)
- 478,685 people
- By 2030
- 497,974 · +4.0%
- By 2040
- 528,515 · +10.4%
- By 2050
- 549,115 · +14.7%
- By 2075
- 587,229 · +22.7%
- By 2100
- 571,378 · +19.4%
Race, ethnicity, and origin ACS 2023
- Neighborhood character
- Highly diverse neighborhood (Simpson 0.71)
- Race & ethnicity
- White 44% Hispanic / Latino 26% Two or more races 13% Black 10% Asian 10% Native American 1%
- Hispanic origin (detail)
- Mexican 18% Puerto Rican 2%
- Common ancestry
- Italian 13% Lithuanian 2% Portuguese 1%
- Foreign-born
- 12% · Canada, China
- Languages at home
- 80% English-only · Spanish 12% Tagalog/Filipino 3% Other Indo-European 2%
Political lean MEDSL · Solano
- 2024 margin
- Strong D (+23.0) · D 60.0% · R 37.1% · Other 2.9%
- 2008→2024 swing
- -5.6pp toward R · 2008: 28.6pp · 2024: 23.0pp
- All cycles
- 2024: D+23.0 2020: D+30.3 2016: D+30.5 2012: D+28.1 2008: D+28.6
Not yet ingested
- Civics
- —
Market trends
- HPI YoY
- ▼ -299.59%
- Current HPI
- 268.0777
- Rent YoY
- ▼ -0.55%
- Metro
- Vallejo, CA
- State GDP YoY
- ▲ 3.21%
- F500 in state
- 116
Industry mix (Fortune 500 HQ in CA)
| Industry | F500 HQs | Revenue |
|---|---|---|
| Technology | 27 | $1,492B |
|
||
| Financial Services | 3 | $174B |
|
||
| Retail | 3 | $44B |
|
||
| Insurance | 3 | $26B |
|
||
| Media / Entertainment | 2 | $115B |
|
||
| Pharmaceuticals / Biotech | 2 | $62B |
|
||
Price history
+240.2% since first listed5 events — show timeline
- 2026-06-06 Listed $330,000 bridgeMLS, Bay East AOR, or Contra Costa AOR
- 2026-06-06 Listed $330,000 MLSListings
- 2026-05-12 Listing Removed — bridgeMLS, Bay East AOR, or Contra Costa AOR
- 2026-03-21 Listed — bridgeMLS, Bay East AOR, or Contra Costa AOR
- 1998-01-14 Sold (Public Records) $97,000 Public Records
Property tax history
+1.9%/yrLatest (2025): $1,704 · -0.2% YoY. Source: county tax records.
Cash-flow waterfall
monthlySold comps — $/sqft
last 12 mo · ≤1 miLoading sold comps…