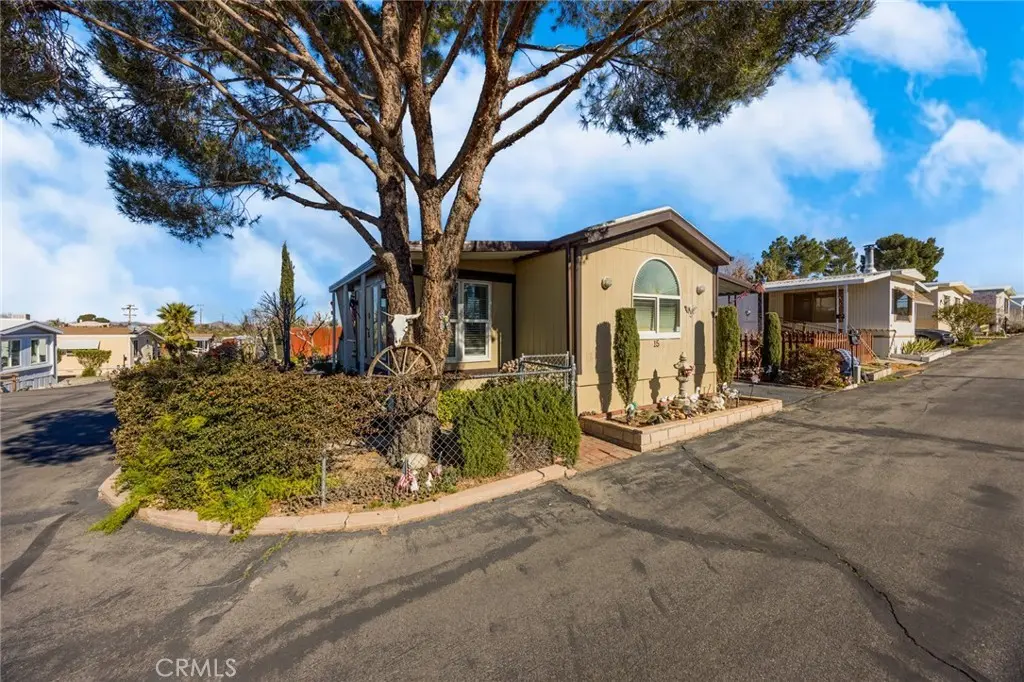
11414 Serra #15 · Apple Valley, CA
Flood risk 1/10 · Minimal
- FEMA flood zone
- D
- Chance of flooding over 30 yrs
- 0.0%
- Est. flood insurance / yr
- $544 – $1,084
Fire risk 6/10 · Moderate
- Est. fire insurance / yr
- $659 – $1,223
Heat risk 6/10 · Moderate
- Hot days now (above 99°F)
- 1 days/yr
- Hot days in 30 yrs
- 3 days/yr
Wind risk 1/10 · Minimal
- Chance of severe wind over 30 yrs
- —
Air-quality risk 10/10 · Severe
- Unhealthy air days now
- 25 days/yr
- Unhealthy air days in 30 yrs
- 30 days/yr
Risk factors via First Street. Map © Google.
Why this score? — see what drove the C+ grade
The composite is a weighted blend of 9 inputs, each scored 0–100. Each bar is that input's sub-score; the figure is the points it added to the 100-point composite (weight × sub-score).
- Cash flow +30.0/30.0
- 1% rule +10.0/10.0
- DSCR +10.0/10.0
- Rent growth +3.6/5.0
- Schools +3.1/10.0
- Livability +3.1/5.0
- Condition / age +2.5/5.0
- ARV discount +0.0/15.0
- Appreciation +0.0/10.0
$70,000
🖨 Deal sheet 📄 Offer letter ✓ Due diligence
Listing remarks MLS
Welcome to this well-maintained 2-bedroom, 1.5-bath manufactured home located in a desirable senior community in Apple Valley. This home offers a functional floor plan with a comfortable living area and the convenience of a half bath for guests. The kitchen provides ample cabinet space and opens to the dining area, making it ideal for everyday living. Both bedrooms are generously sized, with the primary bedroom offering direct access to the bathroom. Indoor laundry and thoughtful storage add to the home’s practicality. Situated in a quiet, age-restricted park, residents enjoy a peaceful environment while remaining close to shopping, dining, medical facilities, and local amenities. This is a great opportunity to own an affordable home in a well-established senior community. Park approval required.
Key facts
- Built 1985
- Listed 139 days
Neighborhood map
What this means for you Summary
Snapshot
- This is a 2-bed/2.0-bath manufactured listed at $70k.
Deal economics
- At list price, monthly cash flow is $924 ($11k/yr) — positive.
- The deal already cash-flows at list — no discount required.
- Meets the 1% rule at list price ($2k rent vs $70k).
- Recommended offer: $62k (12.0% below list) — sets the bar for market timing.
- Cap rate 22.1% vs local median 3.5% in Apple Valley — top-decile yield for the area; either an underpriced asset or a hidden risk that comps aren't pricing in. Stress-test before assuming the spread holds.
Location & tenants
- Location reads 61/100 on livability (#532 in CA) — a middle-class / working-renter tenant base. Strengths: housing A+, commute B+; Watch: employment D+, schools F, crime D-.
- Apple Valley Unified (suburban): math 25% / reading 40% proficiency, ranked #955 of 1,400 in CA (top 68%) — families likely to look elsewhere, expect single-tenant / working-renter base with shorter leases; 60% free/reduced lunch — lower-income household profile, screen leases tightly.
- Market conditions: Rents rising fast (+4.3%/yr); 417 active listings in the ZIP; 6 comparable units currently listed for rent nearby; rentals lingering (median 44d on market — plan ~5-8 weeks vacancy on turnover, expect pricing pressure); 50% of comp listings sitting > 30 days — soft ceiling on asking rent; 5,458 units permitted in San Bernardino County in 2024 (1,500 in 5+ unit buildings).
- This rent runs 31% of the median local income ($67k/yr) — at the standard rent-burdened threshold; future hikes will face affordability resistance.
Forward outlook
- Local home prices are declining (-3.0%/yr); year-one equity from $484 of loan paydown is wiped out by about $2k of value loss. Plan a longer hold.
- San Bernardino County population projected at +15% by 2050 — modest demand growth; plan on rents tracking national, not racing it.
- At projected returns (-3.0% appreciation + 4.3% rent growth), your $20k cash investment doubles in ~2 years — after that, you're playing with house money.
Negotiation context
- It's been on market 139 days — a 12% lower offer ($62k) is reasonable based on typical stale-listing flexibility.
- 4 sale attempts since 7y ago with the ask held roughly flat each time — persistent listings suggest the price (not the market) is what's stuck; bring a comps-based counter.
- Current owner paid $54k; 30% above their basis — modest negotiation headroom, anchor on the comps not their cost.
Risks & watch-outs
- Climate carrying-cost: major wildfire risk; extreme-heat days projected 1→3/yr by 2055 (HVAC capex compounding) — expect insurance premiums to compound above CPI over the hold.
Questions for the listing agent
- It's been on market 139 days. Have you received any prior offers? Is the seller open to a 12% concession, seller financing, or rate buy-down credit?
- Why hasn't it sold? Are there any deal-killer items the seller is aware of (foundation, flood, title, zoning, code violations)?
- Is there a deadline driving the sale (1031 exchange, divorce, estate, relocation)? That informs how much negotiation room exists.
- Schools are F-rated, which usually means shorter tenancies and higher turnover. Who's the typical renter profile here, and what's been the actual vacancy rate?
- Crime grade is D in this area — have there been break-ins, vandalism, or insurance claims at this property in the last 3 years? What carrier currently insures it and at what premium?
- What's the average days-on-market for RENTAL listings here right now (not sales)? A rising rental-DOM trend means longer vacancies and softer asking-rent achievability than the comps imply.
- What's the recent tenant-quality profile in this submarket — average credit score on applications, eviction rate, late-payment / NSF rate, and stable-employment percentage? A property-management company in the area should have these aggregated.
- How much new for-sale + rental construction is in the pipeline within 1–3 miles? Heavy new supply typically softens prices + rents 12–24 months out; constrained supply supports both.
Investment metrics
- 1% rule
- 2.42% ✓
- Cap rate
- 22.13%
- Cash-on-cash
- 56.57%
- DSCR
- 3.52
- GRM
- 3.4
CMA / ARV
- ARV (median comp)
- $54,187
- List price
- $70,000
- Delta
- 29.18%
- Verdict
- OVERPRICED
- Comps
- 7 within 1.0 mi
Show comp detail 5 sales within ~0.75 mi
| Address | Dist | Beds/Ba | Sqft | Sold | Price | $/sf | Match |
|---|---|---|---|---|---|---|---|
| 11414 Serra #51 | 0.00mi | 2/1.0 | 860 (+2%) | 10mo | $57,000 | $66 | 83 |
| 11414 Serra Rd #35 | 0.03mi | 2/1.0 | 860 (+2%) | 11mo | $47,000 | $55 | 82 |
| 11414 Serra Rd #40 | 0.03mi | 1/1.0 (-1) | 840 (0%) | 11mo | $30,000 | $36 | 81 |
| 11414 Serra Rd #46 | 0.03mi | 2/1.0 | 950 (+13%) | 1mo | $55,000 | $58 | 72 |
| 11414 Serra Rd #73 | 0.03mi | 2/2.0 | 960 (+14%) | 7mo | $55,000 | $57 | 68 |
Match score weights: distance 35% · size 25% · config 20% · recency 20%. Top-matched comps best support the ARV.
Projected returns pro-forma
-3.0% appreciation · 4.3% rent growth · sell at horizon
- IRR
- 56.4%
- Equity multiple
- 3.54×
- Total profit
- $49,733
- Equity at exit
- $10,437
- IRR
- 61.8%
- Equity multiple
- 7.55×
- Total profit
- $128,468
- Equity at exit
- $6,052
Cash invested: $19,600 (down + closing). Projections, not guarantees.
Landlord ↔ Tenant lean methodology
- Overall (STATE)
- 18 Strongly Tenant-Friendly
- State California
- 18 Strongly Tenant-Friendly · D+13
- County
- — inherits STATE
- City
- — inherits STATE
ZIP-level market 92308
- Home prices YoY
- -28.8%
- Rents YoY
- 4.3%
- Active inventory
- 417
- Price-to-rent
- 3.4×
Monthly cashflow live
- Estimated rent
- $1,694 high interval (Pro) →
- Mortgage (P&I)
- −$367
- Tax from tax record
- −$18 /mo · $212/yr
- Insurance
- −$29
- HOA
- −$0
- Vacancy / Maint / Mgmt
- −$356
- Net cashflow
- $924
Break-even live
UW: 25.0% down · 7.5% · 30yr · 1.5% tax · 5.0% vac · 8.0% maint · 8.0% mgmt
Financing live
Cash to close
- Down payment
- $17,500
- Closing costs
- $2,100
- Reserves months
- —
- Total cash needed
- —
Loan-product check · same deal, 3 products live
Conventional
25% down · 7.5% · 30yr
- Down + closing
- —
- Monthly P&I
- —
- Monthly cashflow
- —
- DSCR
- —
- Eligible?
- —
Personal DTI + credit; lowest rate.
DSCR
20% down · 8.5% · 30yr
- Down + closing
- —
- Monthly P&I
- —
- Monthly cashflow
- —
- DSCR
- —
- Eligible?
- —
No personal income docs; deal must DSCR.
Hard money
10% down · 12.0% · 12mo
- Down + closing
- —
- Monthly P&I
- —
- Monthly cashflow
- —
- DSCR
- —
- Eligible?
- —
Short-term bridge; refi at stabilization.
Rent comps 6 comps
| Address | Beds | Baths | Sqft | Rent | $/sqft | DOM | Units | Dist |
|---|---|---|---|---|---|---|---|---|
| 11992 Itoya Vista Rd Unit C Apple Valley, CA | 1.0 | 1.0 | 650 | $1,390 | $2.14 | 43d | 1 | 0.66mi |
| 10811 Kiowa Rd Unit 3A Apple Valley, CA | 1.0 | 1.0 | 700 | $1,250 | $1.79 | 2d | 1 | 0.93mi |
| 12212 Kiowa Rd Unit 4 Apple Valley, CA | 2.0 | 2.0 | 990 | $1,700 | $1.72 | 5d | 1 | 1.00mi |
| 21181 Balsa St Apple Valley, CA | 3.0 | 2.0 | 1080 | $2,500 | $2.31 | 43d | 1 | 1.36mi |
| 12525 Kiowa Rd Unit 3 Apple Valley, CA | 2.0 | 1.0 | 799 | $1,675 | $2.10 | 43d | 1 | 1.38mi |
| 21490 Bear Valley Rd Apt A Apple Valley, CA | 2.0 | 1.0 | 875 | $1,595 | $1.82 | 20d | 1 | 1.43mi |
Listing history 21 events
-
2026-06-18days on market $70,000 Active 139 DOM
-
2026-06-17days on market $70,000 Active 138 DOM
-
2026-06-16days on market $70,000 Active 137 DOM
-
2026-06-15days on market $70,000 Active 136 DOM
-
2026-06-13days on market $70,000 Active 134 DOM
-
2026-06-13days on market $70,000 Active 133 DOM
-
2026-06-09days on market $70,000 Active 130 DOM
-
2026-06-08days on market $70,000 Active 129 DOM
-
2026-06-07days on market $70,000 Active 128 DOM
-
2026-06-04days on market $70,000 Active 125 DOM
-
2026-06-03days on market $70,000 Active 124 DOM
-
2026-06-02days on market $70,000 Active 123 DOM
-
2026-06-01days on market $70,000 Active 122 DOM
-
2026-05-31days on market $70,000 Active 121 DOM
-
2026-03-24status Active 813-char remark
Show marketing remark (813 chars)
Welcome to this well-maintained 2-bedroom, 1.5-bath manufactured home located in a desirable senior community in Apple Valley. This home offers a functional floor plan with a comfortable living area and the convenience of a half bath for guests. The kitchen provides ample cabinet space and opens to the dining area, making it ideal for everyday living. Both bedrooms are generously sized, with the primary bedroom offering direct access to the bathroom. Indoor laundry and thoughtful storage add to the home’s practicality. Situated in a quiet, age-restricted park, residents enjoy a peaceful environment while remaining close to shopping, dining, medical facilities, and local amenities. This is a great opportunity to own an affordable home in a well-established senior community. Park approval required.
-
2026-03-19status Pending Sale 813-char remark
Show marketing remark (813 chars)
Welcome to this well-maintained 2-bedroom, 1.5-bath manufactured home located in a desirable senior community in Apple Valley. This home offers a functional floor plan with a comfortable living area and the convenience of a half bath for guests. The kitchen provides ample cabinet space and opens to the dining area, making it ideal for everyday living. Both bedrooms are generously sized, with the primary bedroom offering direct access to the bathroom. Indoor laundry and thoughtful storage add to the home’s practicality. Situated in a quiet, age-restricted park, residents enjoy a peaceful environment while remaining close to shopping, dining, medical facilities, and local amenities. This is a great opportunity to own an affordable home in a well-established senior community. Park approval required.
-
2026-01-25$70,000 Active 813-char remark
Show marketing remark (813 chars)
Welcome to this well-maintained 2-bedroom, 1.5-bath manufactured home located in a desirable senior community in Apple Valley. This home offers a functional floor plan with a comfortable living area and the convenience of a half bath for guests. The kitchen provides ample cabinet space and opens to the dining area, making it ideal for everyday living. Both bedrooms are generously sized, with the primary bedroom offering direct access to the bathroom. Indoor laundry and thoughtful storage add to the home’s practicality. Situated in a quiet, age-restricted park, residents enjoy a peaceful environment while remaining close to shopping, dining, medical facilities, and local amenities. This is a great opportunity to own an affordable home in a well-established senior community. Park approval required.
-
2023-04-07historical
-
2023-03-06$71,000 Active
-
2019-12-12soldstatus $54,000
-
2019-08-18$54,000
ⓘ Source: listings_history table (triggers on properties + properties_extension) + one-shot
backfill from property_details.listing_events for pre-trigger history.
Tax reassessment forecast CA · Resets to sale price
- Current annual tax
- $212 · $18/mo
- Projected year-2 tax
- $532 · $44/mo
- Expected delta
- +$320/yr (+$27/mo · 151.5%)
ⓘ Screening estimate from a state-policy table — verify with the county assessor before closing.
Climate risk First Street
- Flood 1/10 Low FEMA zone D · 0% chance over 30 yrs
- Wildfire 6/10 Major
- Heat 6/10 Major 1 d/yr ≥99°F today · 3 d/yr by 30 yrs out
- Wind 1/10 Low
- Air quality 10/10 Extreme 25 unhealthy d/yr today · 30 by 30 yrs out
Nearby sold comps map
Loading sold comps map…
Walkable amenities ~0.75 mi
Loading nearby amenities…
Taxation est. · year 1
- Rental income
- $20,322
- − Mortgage interest
- −$3,921
- − Property taxes
- −$212
- − Insurance
- −$350
- − Repairs & maintenance
- −$1,626
- − Management
- −$1,626
- − Depreciation
- −$2,036
- Taxable income
- $10,552
- Est. tax owed @ 24.0%
- −$2,532
- After-tax cash flow
- $8,555/yr
For passive investors: Depreciation is non-cash, so a rental often shows a tax loss while cash-flowing — sheltering income. Rental losses are passive: they offset passive income freely, and up to $25,000/yr can offset ordinary (W-2) income if you actively participate and your MAGI is under $100k (phasing out to $0 by $150k); unused losses carry forward. On sale, claimed depreciation is recaptured at up to 25%, and gains may owe capital-gains tax (a 1031 exchange can defer both). Figures are a year-1 estimate at your 24.0% rate — not tax advice; consult a CPA.
Schools (NCES district)
- District
- Apple Valley Unified
- NCES district ID
- 0600017
- Math proficiency
- 25% ▬ 0.00%
- Reading proficiency
- 40% ▬ 0.00%
- Median HH income
- $49,264
- Composite
- 30.91/100
- National rank
- #11351
- State rank
- #955 of 1400 in CA
Livability — Apple Valley
- Score
- 61/100
- State rank
- #532
- US rank
- #17800
Category grades
Schools grade is shown separately in the Schools card above.
Census & demographics
- Census place
- Apple Valley, CA
- County
- San Bernardino County · 2,030,291 people
- City population
- 83,889
- Metro
- Riverside-San Bernardino-Ontario, CA
- Population (ZIP)
- 42,709
- Household income
- $66,568
- Rent vs Own
- Severe rent burden
- 1389.0
Population outlook (San Bernardino County) Hauer SSP2
- Today (2025)
- 2,300,329 people
- By 2030
- 2,378,907 · +3.4%
- By 2040
- 2,523,137 · +9.7%
- By 2050
- 2,642,388 · +14.9%
- By 2075
- 2,880,769 · +25.2%
- By 2100
- 2,909,436 · +26.5%
Race, ethnicity, and origin ACS 2023
- Neighborhood character
- Diverse neighborhood (Simpson 0.65)
- Race & ethnicity
- White 44% Hispanic / Latino 38% Two or more races 19% Black 9% Asian 3%
- Hispanic origin (detail)
- Mexican 34%
- Common ancestry
- Italian 1% Iranian 1% Slovak 1%
- Foreign-born
- 11% · Canada, South Korea
- Languages at home
- 75% English-only · Spanish 20% Tagalog/Filipino 1% Other Asian/Pacific 1%
Political lean MEDSL · San Bernardino
- 2024 margin
- Toss-up / Even · D 47.5% · R 49.7% · Other 2.8%
- 2008→2024 swing
- -8.5pp toward R · 2008: 6.3pp · 2024: -2.1pp
- All cycles
- 2024: R+2.1 2020: D+10.7 2016: D+9.8 2012: D+5.4 2008: D+6.3
Not yet ingested
- Civics
- —
Market trends
- HPI YoY
- ▼ -145.60%
- Current HPI
- 359.2305
- Rent YoY
- ▲ 4.30%
- Metro
- Riverside-San Bernardino-Ontario, CA
- State GDP YoY
- ▲ 3.21%
- F500 in state
- 116
Industry mix (Fortune 500 HQ in CA)
| Industry | F500 HQs | Revenue |
|---|---|---|
| Technology | 27 | $1,492B |
|
||
| Financial Services | 3 | $174B |
|
||
| Retail | 3 | $44B |
|
||
| Insurance | 3 | $26B |
|
||
| Media / Entertainment | 2 | $115B |
|
||
| Pharmaceuticals / Biotech | 2 | $62B |
|
||
Price history
+29.6% since first listed7 events — show timeline
- 2026-03-24 Relisted — CRMLS
- 2026-03-19 Pending — CRMLS
- 2026-01-25 Listed $70,000 CRMLS
- 2023-04-07 Listing Removed — CRMLS
- 2023-03-06 Listed $71,000 CRMLS
- 2019-12-12 Sold (MLS) $54,000 CRMLS
- 2019-08-18 Listed $54,000 CRMLS
Property tax history
+3.2%/yrLatest (2025): $212 · +1.7% YoY. Source: county tax records.
Cash-flow waterfall
monthlySold comps — $/sqft
last 12 mo · ≤1 miLoading sold comps…